

ATM/ATR-mediated phosphorylation of PALB2 promotes RAD51 function
- PMID: 27113759
- PMCID: PMC5341514
- DOI: 10.15252/embr.201541455
ATM/ATR-mediated phosphorylation of PALB2 promotes RAD51 function
Abstract
DNA damage activates the ATM and ATR kinases that coordinate checkpoint and DNA repair pathways. An essential step in homology-directed repair (HDR) of DNA breaks is the formation of RAD51 nucleofilaments mediated by PALB2-BRCA2; however, roles of ATM and ATR in this critical step of HDR are poorly understood. Here, we show that PALB2 is markedly phosphorylated in response to genotoxic stresses such as ionizing radiation and hydroxyurea. This response is mediated by the ATM and ATR kinases through three N-terminal S/Q-sites in PALB2, the consensus target sites for ATM and ATR Importantly, a phospho-deficient PALB2 mutant is unable to support proper RAD51 foci formation, a key PALB2 regulated repair event, whereas a phospho-mimicking PALB2 version supports RAD51 foci formation. Moreover, phospho-deficient PALB2 is less potent in HDR than wild-type PALB2. Further, this mutation reveals a separation in PALB2 function, as the PALB2-dependent checkpoint response is normal in cells expressing the phospho-deficient PALB2 mutant. Collectively, our findings highlight a critical importance of PALB2 phosphorylation as a novel regulatory step in genome maintenance after genotoxic stress.
Keywords: ATM; ATR; DNA damage response; PALB2 phosphorylation; RAD51.
© 2016 The Authors.
Figures

U2OS cells were harvested at the indicated time points after treatment with ionizing radiation (15 Gy) followed by analysis by SDS–PAGE and immunoblotting with antibodies recognizing PALB2 and vinculin (NT, no treatment). The lysate from the 24 h time point was treated with phosphatase (Ppase).
U2OS cells were left untreated or treated with ATM (KU 55933, 10 μM), ATR (ETP‐464, 1 μM), or DNA‐PK (NU7441, 1 μM) inhibitors 30 min prior to exposure to IR (15 Gy, 2 h recovery). Immunoblots were performed with the indicated antibodies.
U2OS cells were left untreated (NT) or exposed to HU (2 mM) for the indicated times. The lysate from the 24 h time point was treated with phosphatase (Ppase). Immunoblots were performed with the indicated antibodies.
Untreated U2OS cells or cells exposed to either HU (2 mM, 24 h) or IR (15 Gy, 2 h recovery) alone or together with ATM inhibitor (KU55933, 10 μM) or inhibitors to ATR (ATR#1: ETP‐464, 1 μM; ATR#2: AZ‐20, 3 μM) were harvested and lysates were prepared. The inhibitors were added 30 min prior to HU or IR treatment. Immunoblots were performed with the indicated antibodies.
ATR kinase assay was performed with N‐terminal PALB2 (aa 1‐560; GST–PALB2–N (Fig 2A)) as a substrate and HA‐tagged ATR as kinase and visualized by Fujifilm Phosphroimager. 293T cells transfected with empty vector (EV), GST, and ATR inhibition (AZ‐20, 30 μM) are controls. HA‐ATR and GST–PALB2–N were controlled by immunoblotting with HA and GST antibodies.

U2OS cells were transfected with UNC (negative control), ATM or ATR siRNA and 48 h later left untreated or treated with HU (2 mM, 24 h, left panel) or IR (15 Gy, 2 h recovery, right panel). The cell lysates were analyzed by SDS–PAGE and Western blotting with PALB2, ATM, ATR, and vinculin antibodies.
HCT116 and MCF10a cells were left untreated (NT) or treated with IR (15 Gy, 2 h recovery) or HU (2 mM for 7 h). The lysates were subsequently treated with phosphatase and analyzed by SDS–PAGE. Immunoblotting was performed with PALB2 and vinculin antibodies.
Immunoprecipitation of the PALB2 cell lines with pS/Q antibody was performed as in Fig 2D. Cells were either left untreated (NT) or exposed to IR (15 Gy, 2 h recovery) or treated with ATM (KU55933, 1 μM) and ATR (AZ‐20, 3 μM) inhibitors 30 min before exposure to IR (15 Gy, 2 h recovery). The values under the IP blot show relative band intensities in the IP samples normalized to the expression levels of the input samples. The non‐treated WT sample was arbitrarily set to one, and the densitometry was performed using ImageJ/Fiji.
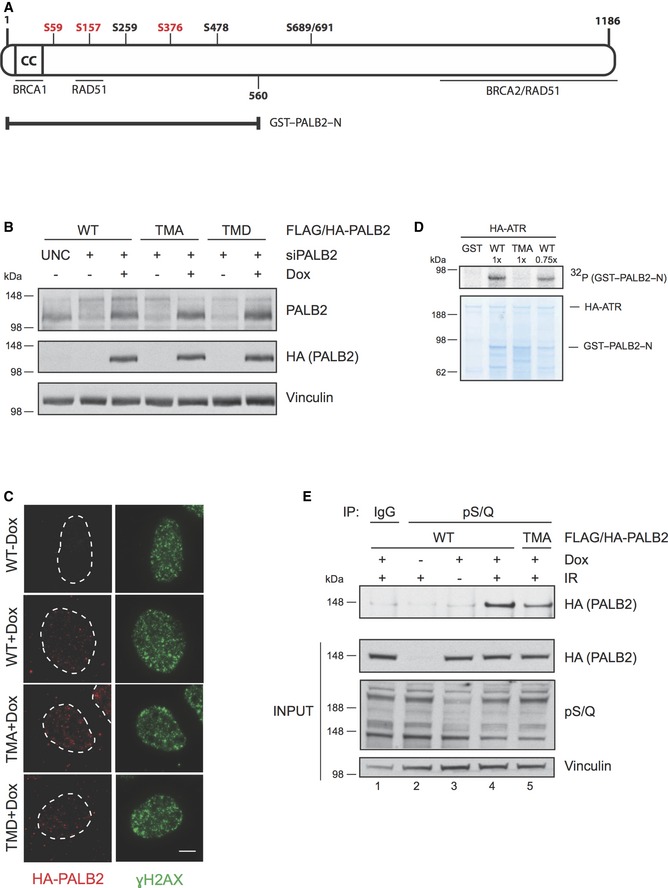
Schematic figure of the human PALB2 protein. The N‐terminus of PALB2 contains a coiled‐coil region (CC) that mediates the interaction between PALB2 and BRCA1. PALB2 interacts with BRCA2 via the C‐terminal WD40 domain, which also harbors interaction sites for RAD51. An additional region for RAD51 interaction is located in the N‐terminus at amino acid residues 101–184. PALB2 has seven potential S/Q phosphorylation sites of which serines S59, S157, and S376 (depicted in red) were mutated either to alanine (triple mutant S to A, TMA) to create a phospho‐deficient mutant, or aspartic acid (triple mutant S to D, TMD) for a phospho‐mimicking mutant. GST–PALB2–N (amino acids 1‐560) contains the N‐terminal serines.
Characterization of the doxycycline‐inducible cell lines expressing siRNA‐resistant wild‐type (WT) or mutant (TMA or TMD) FLAG/HA‐tagged PALB2. The cell lines were transfected with UNC (negative control) or PALB2 siRNA for 24 h prior to induction with doxycycline. Immunoblots were performed with the indicated antibodies.
Cell line characterization of FLAG/HA‐tagged PALB2 localization 2 h following exposure to 15 Gy of IR. Z‐stack max intensity image projection and background subtraction was done using ImageJ/Fiji. Scale bar = 5 μm.
Kinase assay was performed as described in Fig 1E except that the SDS–PAGE gel was Coomassie stained following electrophoresis. WT was used at two different concentrations (1× and 0.75×).
Doxycycline‐inducible stable U2OS cell lines were left untreated or treated with doxycycline and/or IR (15 Gy, 2 h recovery). Following protein extraction, the lysates were immunoprecipitated (IP) with IgG or antibody recognizing phosphorylated S/Q sites (pS/Q) and analyzed by SDS–PAGE. Immunoblots were performed with the indicated antibodies.

PALB2 cell lines transfected with PALB2 siRNA followed by inducible expression of siRNA‐resistant PALB2 versions were exposed to 15 Gy of IR and fixed for IF 2 h later. Z‐stack images were acquired with a 60× oil objective (Deltavision). Z‐stack max intensity projection, background subtraction, and foci count were done using ImageJ/Fiji (*P < 0.0001, unpaired Student's t‐test). Scale bar = 5 μm.
PALB2 cell lines were transfected and the exogenous PALB2 induced as in Fig 3A before they were pulsed with 10 μM EdU for 20 min prior to addition of 2 mM HU. Twenty‐four hours later, the cells were fixed and processed for IF as in (A). Cells in S phase (EdU+) at the time of HU treatment were Click‐IT labeled with an Alexa Fluor 647 azide and RAD51 foci in EdU‐positive cells were enumerated using ImageJ/Fiji (*P < 0.0001, unpaired Student's t‐test). Scale bar = 5 μm.
HeLa DR‐GFP cell line was used to analyze homologous recombination activity. Cells were transfected with PALB2 siRNA followed by transfection of I‐SceI together with empty vector (EV), WT, TMA‐, or TMD‐PALB2 the next day. 72 h later cells were fixed and analyzed by FACS. The percentage of cells with GFP signal from the empty vector sample was set to one (dotted line). The graph shows a representative image from three biological repeats (error bars = SEM).
Phosphorylation of PALB2 supports RAD51 foci. Cells were transfected with siPALB2 overnight followed by forward transfection of siFBH1/siBLM for 6 h then induced for expression of PALB2 (WT and TMA). 24 h following induction cells were pulsed with EdU and exposed to HU as in (B). Cells in S phase (EdU+) at the time of HU treatment were Click‐IT labeled with an Alexa Fluor 647 azide and RAD51 foci in EdU‐positive cells were enumerated using ImageJ/Fiji (*P < 0.0001, unpaired Student's t‐test). Representative images displaying RAD51 (green) and HA‐PALB2 (red) localization in HU‐treated EdU‐positive (not shown) cells. Scale bar = 5 μm.

Influence of PALB2 phosphorylation mutants on RAD51 foci formation following exposure to IR. U2OS cells were siRNA transfected to knock down endogenous PALB2, then transfected with FLAG‐HA WT, S59A, S157/376A, or TMA–PALB2. Twenty‐four hours following construct transfection cells were irradiated with 15 Gy of IR and fixed and processed for IF 2 h later. Transfected cells were identified by HA antibody reactivity and scored for RAD51 foci (WT n = 53, S59A n = 54, S157/376A n = 52, TMA n = 51) (P‐values: *P = 0.0257, **P = 0.0029, ***P = 0.0003, unpaired Student's t‐test). Transient expression of the PALB2 constructs was confirmed by Western blot probing for the HA tag. Scale bar = 5 μm.
Proficiency of clonal PALB2 cell lines to form RAD51 foci in response to DNA damage. Cell lines were assessed for RAD51 foci formation without siRNA transfection and transgene induction. Cells were exposed to IR (15 Gy) or HU (2 mM) and processed for RAD51 foci as in Fig 3A and B, respectively. Representative images are shown. Scale bar = 5 μm.
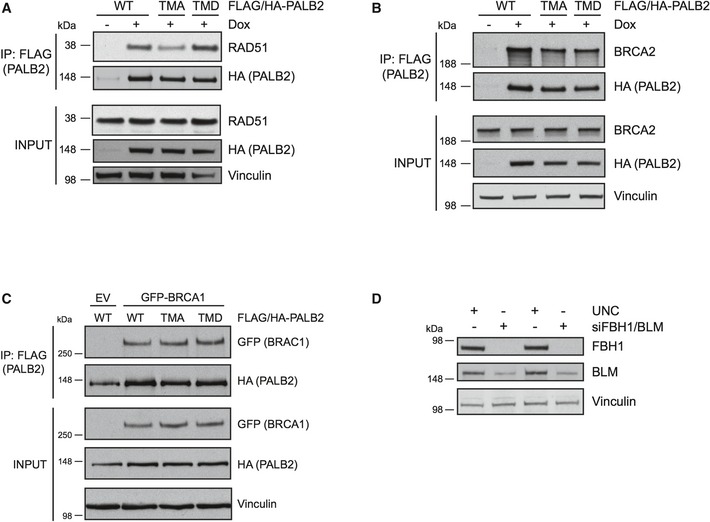
The PALB2 cell lines were untreated or treated with doxycycline followed by exposure to IR treatment (15 Gy, 2 h recovery). The exogenous FLAG/HA‐tagged PALB2 was immunoprecipitated with FLAG‐agarose and the IP and input samples were run on SDS–PAGE. The membranes were blotted with RAD51 and HA antibodies and vinculin was used as a loading control.
The cells were treated and analyzed as in (A). Immunoblotting was performed with BRCA2, HA, and vinculin antibodies.
293T cells were transfected with empty vector (EV) or GFP‐BRCA1 together with FLAG‐/HA‐tagged WT, TMA, or TMD PALB2. Immunoprecipitation was performed using FLAG‐agarose, and the IP and input samples were probed with GFP and HA antibodies. Vinculin was used as a loading control.
Representative immunoblot for Fig 3D showing depletion of FBH1 and BLM. The cell lysates were analyzed by Western blotting and probed with FBH1, BLM, and vinculin antibodies.

U2OS and PALB2 cell lines were transfected with UNC (negative control) or PALB2 siRNA and 24 h later doxycycline was added to the PALB2 cell lines. Left panel, cells were treated the following day with IR (5 Gy) and 2 h later nocodazole was added for 6 h, or treated with only nocodazole for 6 h. Right panel, cells were treated with IR (5 Gy) and left to recover for 16 h. Cells were fixed and stained with the pMPM2 antibody to detect the mitotic cells by flow cytometry. The percentages of mitotic cells in the IR + nocodazole samples were normalized to the nocodazole samples (left panel, n = 3, error bars = SEM). For the samples with the 16‐h recovery after IR, the percentage of mitotic cells in the WT PALB2‐expressing cells was set to one (right panel) (n = 3, **P < 0.005, *P < 0.05, unpaired Student's t‐test, error bars = SEM).
The relative intensity of phosphorylated H2AX (pS139) was examined in the total population of WT and TMA‐PALB2‐expressing cell lines 18 h post‐exposure to IR (5 Gy). Cell lines were prepared as above, fixed at the indicated time point, and stained for pH2AX. Cells were imaged with a 20× air objective on a Scan^R workstation (Olympus); mean relative pH2AX intensity was calculated from background subtracted images using the Scan^R analysis software (*P < 0.0001, unpaired Student's t‐test, error bars = SEM).
Number of 53BP1 nuclear bodies in TMA‐PALB2‐expressing G1 daughter cells. Cell lines were prepared as above and left untreated (NT) or exposed to IR (3 Gy), and 16 h later cytochalasin B was added for 8 h to block cytokinesis. The irradiated binucleated cells were scored for 53BP1 nuclear bodies. Scale bar = 10 μm.

References
-
- Thompson LH (2012) Recognition, signaling, and repair of DNA double‐strand breaks produced by ionizing radiation in mammalian cells: the molecular choreography. Mutat Res 751: 158–246 - PubMed
-
- Shiloh Y, Ziv Y (2013) The ATM protein kinase: regulating the cellular response to genotoxic stress, and more. Nat Rev Mol Cell Biol 14: 197–210 - PubMed
-
- Dobbelstein M, Sorensen CS (2015) Exploiting replicative stress to treat cancer. Nat Rev Drug Discov 14: 405–423 - PubMed
Publication types
MeSH terms
Substances
LinkOut - more resources
Full Text Sources
Other Literature Sources
Research Materials
Miscellaneous
