. 2016 May 5;165(4):1002-11.
doi: 10.1016/j.cell.2016.03.022. Epub 2016 Apr 21.

Whole-Genome Sequencing of a Healthy Aging Cohort

Affiliations

Whole-Genome Sequencing of a Healthy Aging Cohort

Galina A Erikson et al. Cell. .

Abstract

Studies of long-lived individuals have revealed few genetic mechanisms for protection against age-associated disease. Therefore, we pursued genome sequencing of a related phenotype-healthy aging-to understand the genetics of disease-free aging without medical intervention. In contrast with studies of exceptional longevity, usually focused on centenarians, healthy aging is not associated with known longevity variants, but is associated with reduced genetic susceptibility to Alzheimer and coronary artery disease. Additionally, healthy aging is not associated with a decreased rate of rare pathogenic variants, potentially indicating the presence of disease-resistance factors. In keeping with this possibility, we identify suggestive common and rare variant genetic associations implying that protection against cognitive decline is a genetic component of healthy aging. These findings, based on a relatively small cohort, require independent replication. Overall, our results suggest healthy aging is an overlapping but distinct phenotype from exceptional longevity that may be enriched with disease-protective genetic factors. VIDEO ABSTRACT.


Figures

Figure 1
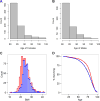
Figure 1. Wellderly Demographic Characteristics
A. The age distribution of Wellderly female individuals. B. The age distribution of male Wellderly individuals. C. The BMI distribution of Wellderly individuals for males (blue) and females (red). D. Survival curves for the Wellderly siblings (red) and the expected survival of a 1920s birth cohort (blue). A significant difference in survival was observed (log-rank test p-value = 3.67 × 10⁻⁸) in middle-age (40–79 years) but not overall longevity. 95% confidence interval is provided for the Wellderly siblings in red shading (only visible at the end of the survival curve).
Figure 2
Figure 2. Common Variant Association Results
A. Principal component plot of the Wellderly (red) and ITMI (blue) cohort based on filtered and LD pruned (R2 > 0.5) common variants (allele frequency > 5%). B. QQ plot of expected −log10(P-values) (x-axis) vs. observed −log10(P-values) (y-axis) (one black point per variant). Expected vs. expected −log10(P-values) (red line) is along the diagonal. The λ value for this QQ plot is 0.98 – no genomic inflation observed. C. Manhattan plot of the unbiased GWAS results. Each point represents a single SNP P-value determined by a logistic model adjusted for the first ten principal components. Points are organized by chromosome and chromosomal coordinate (x-axis) and −log10(P-values) (y-axis). The blue line indicates P-values < 10−5. Green highlighted SNPs correspond to the top most significant regions, plotted in Figure 3. See also Supplemental Table S4.
Figure 3
Figure 3. Regional Association Plots
Regional plots for the top 3 most significant regions for GWAS comparing the Wellderly and ITMI cohorts. For all plots, each point represents a SNP, where the x-axis represents the position of the SNP and the y-axis (right) the −log10 p-value of the genome-wide association results. Each point is color coded with the D′ value as calculated within the Wellderly and ITMI cohorts. The D′ value within the 1000 Genomes European individuals is indicated by connecting lines. Recombination rate is also plotted at each genomic position with the rate indicated on the y-axis (left) A. Lead SNP rs13217620 (chr6:27,653,120) (p-value = 6.1 × 10⁻⁷) is highlighted along with SNPs previously associated with schizophrenia (rs13194053 and rs17693963). B. Lead SNP rs41266839 (chr6:26,409,890) (p-value = 4.1 × 10⁻⁶) is highlighted along with rs1056667, previously associated with cognitive performance. C. Lead SNP rs156033 (p-value = 1.7 × 10⁻⁶) is highlighted along with rs11950562, previously associated with isovalerylcarnitine levels. D. Lead SNP rs10209741 (p-value = 7.0 × 10⁻⁶) is highlighted along with rs895767, previously marginally associated with cognitive decline.
Figure 4
Figure 4. Rare Variant Burden
A. The rate of rare pathogenic cancer, hereditary dementia and common monogenic disease (secondary finding) variants is displayed for the Wellderly (red) and ITMI (blue) cohorts with standard error bars. No difference is observed between the cohorts. See also Supplemental Table S5. B. QQ plot of expected −log10(P-values) (x-axis) vs. observed −log10(P-values) (y-axis) (one black point per gene). Expected vs. expected −log10(P-values) (red line) is along the diagonal. The λ value for this QQ plot is 0.99 – no genomic inflation observed. The point corresponding to the top gene, COL25A1 is labeled. See also, Supplemental Table S6. C. The location, impact, and count of COL25A1 coding variants are indicated along the COL25A1 protein. The COL25A1 protein and domains is displayed horizontally from the N-terminal to C-terminal amino acid (x-axis). The blue region indicates the cytoplasmic region of COL25A1, the maroon region indicates the transmembrane domain, green regions are collagen domains, and grey regions are intervening non-collagen stretches. The cleavage site for secretion of COL25A1 is indicated by the vertical dashed line. COL25A1 interacts with the amyloid beta protein at NC2. Each observed mutation position is indicated by a black pin with red head. The height of each pin corresponds to the number of alleles observed in the Wellderly cohort (all variants observed in a single individual except p.R402C). The coding impact of each variant is indicated next to each pin. Super-script daggers indicate variants that have been previously observed in the Exome Aggregation Consortium database. See also Supplemental Figure S1 and Supplemental Table S7.

Comment in

  • Genetics: Healthy ageing, the genome and the environment.
    Christensen K, McGue M. Christensen K, et al. Nat Rev Endocrinol. 2016 Jul;12(7):378-80. doi: 10.1038/nrendo.2016.79. Epub 2016 May 27. Nat Rev Endocrinol. 2016. PMID: 27230948 Free PMC article.
  • Genes for a 'Wellderly' Life.
    Kauwe JSK, Goate A. Kauwe JSK, et al. Trends Mol Med. 2016 Aug;22(8):637-639. doi: 10.1016/j.molmed.2016.05.011. Epub 2016 Jun 13. Trends Mol Med. 2016. PMID: 27312143 Free PMC article.

Similar articles

Cited by

References

    1. Al-Tassan NA, et al. A new GWAS and meta-analysis with 1000Genomes imputation identifies novel risk variants for colorectal cancer. Scientific reports. 2015;5:10442. - PMC - PubMed
    1. Alexander DH, Lange K. Enhancements to the ADMIXTURE algorithm for individual ancestry estimation. BMC bioinformatics. 2011;12:246. - PMC - PubMed
    1. Atzmon G, et al. Lipoprotein genotype and conserved pathway for exceptional longevity in humans. PLoS biology. 2006;4:e113. - PMC - PubMed
    1. Beekman M, et al. Genome-wide association study (GWAS)-identified disease risk alleles do not compromise human longevity. Proceedings of the National Academy of Sciences of the United States of America. 2010;107:18046–18049. - PMC - PubMed
    1. Bell FC, Miller ML. (Social Security Actuarial Study No 120).Life Tables for the United States Social Security Area 1900–2100. 2005

Publication types