. 2016 Jul 15:135:16-31.
doi: 10.1016/j.neuroimage.2016.04.047. Epub 2016 Apr 23.

Functional connectivity and structural covariance between regions of interest can be measured more accurately using multivariate distance correlation

Affiliations

Functional connectivity and structural covariance between regions of interest can be measured more accurately using multivariate distance correlation

Linda Geerligs et al. Neuroimage. .

Abstract

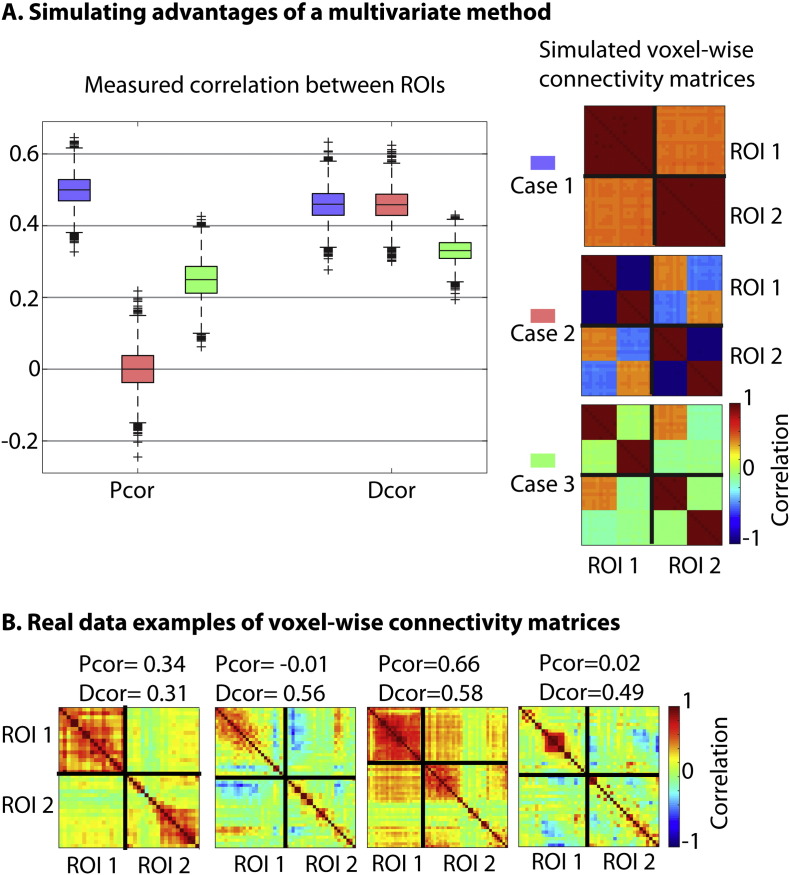
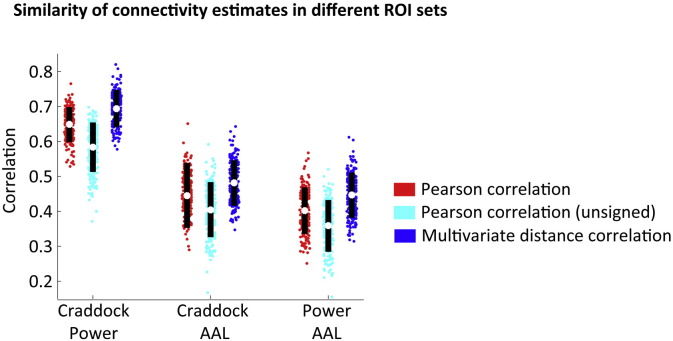
Studies of brain-wide functional connectivity or structural covariance typically use measures like the Pearson correlation coefficient, applied to data that have been averaged across voxels within regions of interest (ROIs). However, averaging across voxels may result in biased connectivity estimates when there is inhomogeneity within those ROIs, e.g., sub-regions that exhibit different patterns of functional connectivity or structural covariance. Here, we propose a new measure based on "distance correlation"; a test of multivariate dependence of high dimensional vectors, which allows for both linear and non-linear dependencies. We used simulations to show how distance correlation out-performs Pearson correlation in the face of inhomogeneous ROIs. To evaluate this new measure on real data, we use resting-state fMRI scans and T1 structural scans from 2 sessions on each of 214 participants from the Cambridge Centre for Ageing & Neuroscience (Cam-CAN) project. Pearson correlation and distance correlation showed similar average connectivity patterns, for both functional connectivity and structural covariance. Nevertheless, distance correlation was shown to be 1) more reliable across sessions, 2) more similar across participants, and 3) more robust to different sets of ROIs. Moreover, we found that the similarity between functional connectivity and structural covariance estimates was higher for distance correlation compared to Pearson correlation. We also explored the relative effects of different preprocessing options and motion artefacts on functional connectivity. Because distance correlation is easy to implement and fast to compute, it is a promising alternative to Pearson correlations for investigating ROI-based brain-wide connectivity patterns, for functional as well as structural data.

Keywords: Distance correlation; Functional connectivity; Graph theory; Multivariate; Resting state; Structural covariance.


Figures

Fig. 1
Fig. 1
A: Illustration of the ROIs in each set. Craddock ROIs contain 23 voxels on average, while Power ROIs contain 65 voxels on average. For the AAL atlas, ROIs typically contain thousands or even tens of thousands of voxels. B: Functional networks based on the Craddock ROIs, defined in Geerligs et al. (2015) from a superset of participants based on Pearson correlations. These networks are used to order the functional connectivity matrices in Fig. 4, Fig. 6, Fig. 9, Fig. 10.
Fig. 2
Fig. 2
A. Demonstration of some important differences between the Pcor and Dcor methods. We simulated two ROIs with different voxel-wise connectivity patterns, which are shown in the figures on the right. The boxplots show the observed Dcor and Pcor estimates between the two ROIs in three different cases. B. Examples of voxel-wise connectivity patterns between two Craddock ROIs in real data.
Fig. 3
Fig. 3
Simulations of potential sources of bias in the Dcor and Pcor connectivity estimates. A. Effects of varying the number of voxels in an ROI. B. Effects of varying the type and the amount of noise in each ROI. C. Effects of varying the autocorrelation of the signals in each ROI. The α and β parameters indicate the amount of autocorrelation in each ROI (see Section 2.6). IQR = inter-quartile range.
Fig. 4
Fig. 4
A: Functional connectivity matrices based on the set of Craddock ROIs for Pearson correlation (Pcor) and univariate and multivariate distance correlation (Dcor). Unsigned Pcor estimates were used to emphasize differences that were due to the multivariate method, rather than the absence of negative correlations. ROIs are ordered by functional network, as indicated by the colors on the left side and bottom of the functional connectivity matrices. B: Illustration of the differences between univariate Dcor and Pcor, and between multivariate Dcor and Pcor. For this illustration, we Z-transformed the connectivity matrices (based on mean and standard deviation over all elements of the matrix), and subtracted the z-scores of Pcor from Dcor. C. Density plot of the association between Pcor and Dcor for average functional connectivity across participants. The black line indicates the average Dcor estimates corresponding to each value of Pcor.
Fig. 5
Fig. 5
A: Regional differences in ROI homogeneity, as measured by the percentage of variance in its functional connectivity patterns that could be explained by the first principal component. B. Correlation between Pcor and Dcor functional connectivity patterns from each brain region to all other regions. Unsigned Pcor values were used to quantify the similarity. C: Differences between Dcor and Pcor in the reliability of regional connectivity patterns (ICC between session 1 and session 2). Red–yellow regions show significantly (p < 0.001) higher reliability for Dcor compared to Pcor; blue regions show significantly higher reliability for Pcor compared to Dcor. D. Associations between the measures of connectivity differences, reliability differences and ROI homogeneity shown in the panels A–C above. E. Scatterplots showing the mean and standard deviation of the within-participant reliability and F. between-participant similarity of the different functional connectivity measures for each of the three ROI sets.
Fig. 6
Fig. 6
The reliability (ICC) of estimates of functional connectivity strength for each pair of Craddock ROIs.
Fig. 7
Fig. 7
Correlation between voxel-wise connectivity matrices, based on different ROI sets.
Fig. 8
Fig. 8
Within-participant reliability and between-participant similarity for different data pre-processing options. White dots indicate the mean, while black bars delineate one standard deviation around the mean.
Fig. 9
Fig. 9
Significant correlations (p < 0.001) between functional connectivity and head motion for Dcor and Pcor, in the Craddock ROI set. ROIs are ordered by functional network, as indicated by the colors on the left side and bottom of the functional connectivity matrices. The red bars indicate regions associated with the somatomotor network, green bars indicate regions in the cerebellar network.
Fig. 10
Fig. 10
A. Matrices of functional connectivity and structural connectivity for the Craddock ROIs, using Pcor or Dcor. Unsigned Pcor values were used to emphasize differences due to the multivariate method, rather than the absence of negative correlations. ROIs are ordered by the functional networks depicted in Fig. 1, as indicated by the colors on the left side and bottom of the functional connectivity matrices. B: Regional differences in ROI homogeneity of grey matter volumes. C. Correlation between Pcor and Dcor structural connectivity patterns from each brain region to all other regions. Unsigned Pcor values were used to quantify the similarity. D. Reliability of the structural connectivity matrix (similarity between session 1 and session 2). E. The similarity between structural connectivity and functional connectivity for each of the ROI sets. *** p < 0.001.

References

    1. Alexander-Bloch A.F., Gogtay N., Meunier D., Birn R., Clasen L., Lalonde F., Lenroot R., Giedd J., Bullmore E.T. Disrupted modularity and local connectivity of brain functional networks in childhood-onset schizophrenia. Front. Syst. Neurosci. 2010;4:147. - PMC - PubMed
    1. Alexander-Bloch A., Raznahan A., Bullmore E., Giedd J. The convergence of maturational change and structural covariance in human cortical networks. J. Neurosci. 2013;33:2889–2899. - PMC - PubMed
    1. Anzellotti S., Caramazza A., Saxe R. bioRxiv preprint; 2016. Multivariate Pattern Connectivity.
    1. Arbabshirani M.R., Damaraju E., Phlypo R., Plis S., Allen E., Ma S., Mathalon D., Preda A., Vaidya J.G., Adali T., Calhoun V.D. Impact of autocorrelation on functional connectivity. NeuroImage. 2014;102:294–308. - PMC - PubMed
    1. Ashburner J., Friston K.J. Voxel-based morphometry — the methods. NeuroImage. 2000;11:805–821. - PubMed

Publication types

MeSH terms