. 2017 Apr 1;27(4):2513-2527.
doi: 10.1093/cercor/bhw106.

Ghosts in the Machine II: Neural Correlates of Memory Interference from the Previous Trial

Affiliations

Ghosts in the Machine II: Neural Correlates of Memory Interference from the Previous Trial

Charalampos Papadimitriou et al. Cereb Cortex. .

Abstract

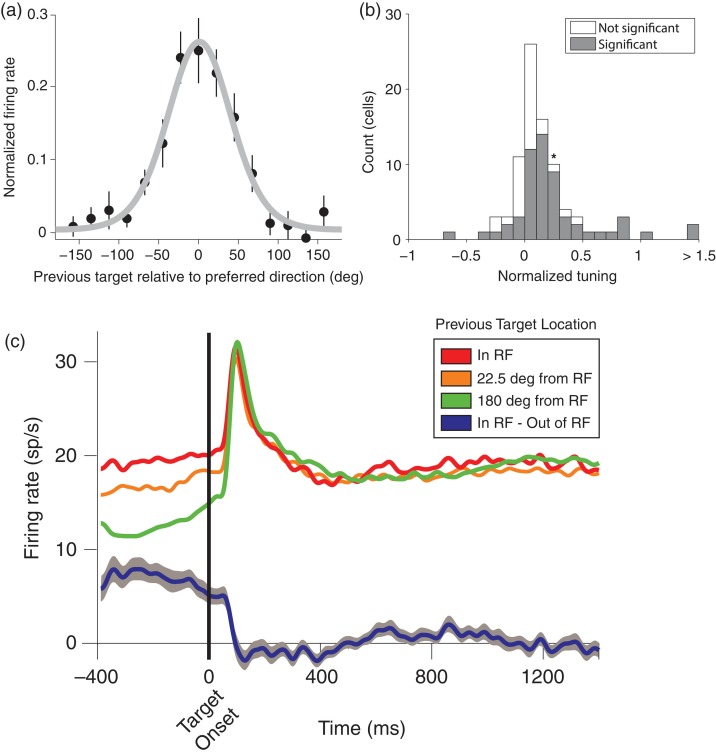
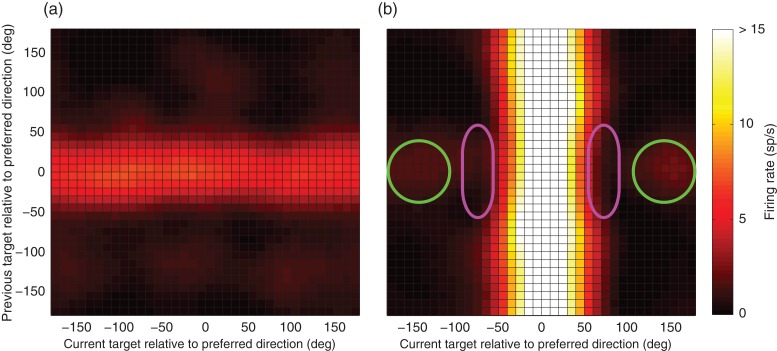
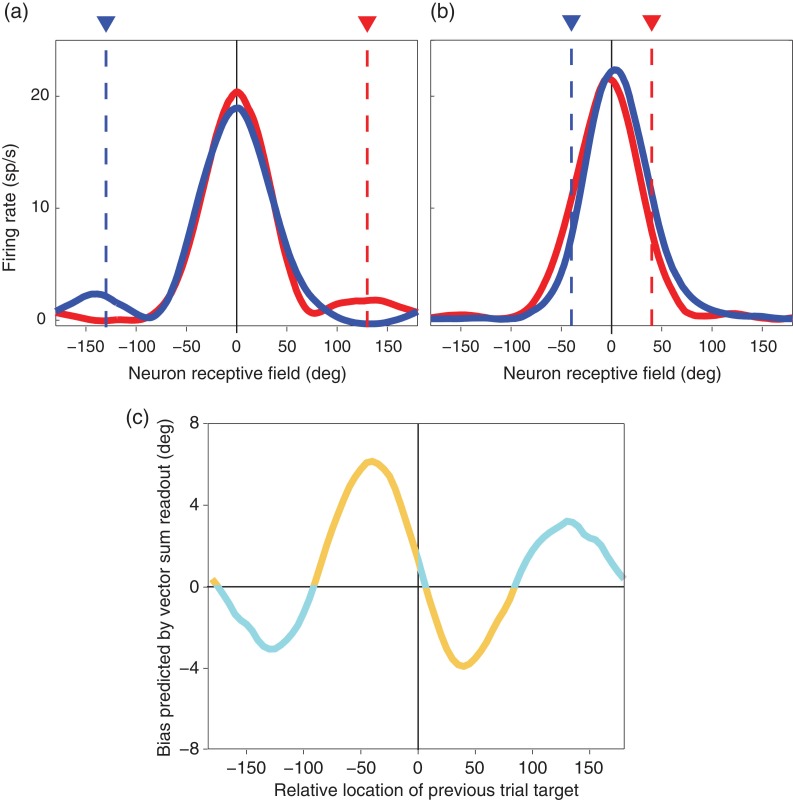
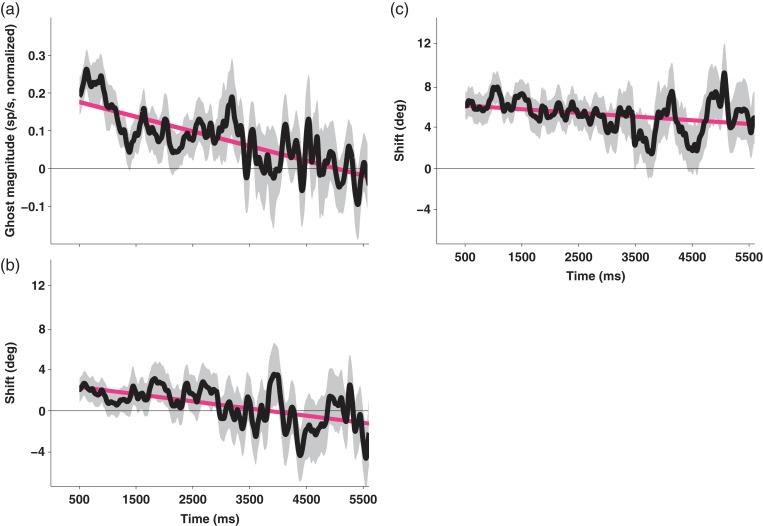
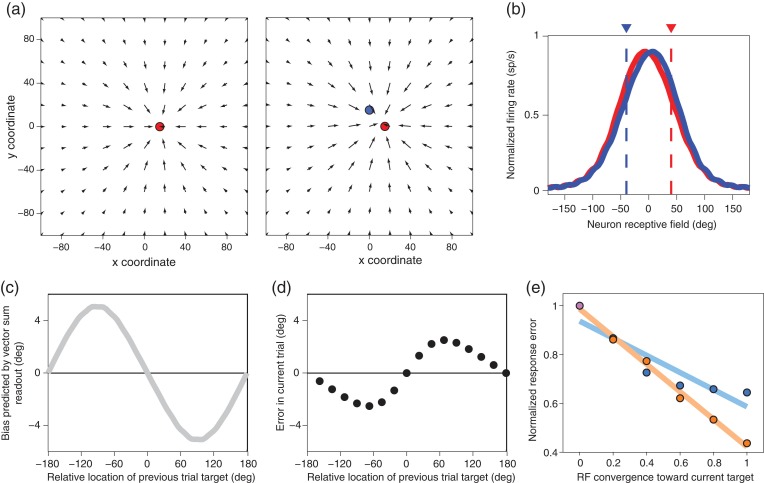
Previous memoranda interfere with working memory. For example, spatial memories are biased toward locations memorized on the previous trial. We predicted, based on attractor network models of memory, that activity in the frontal eye fields (FEFs) encoding a previous target location can persist into the subsequent trial and that this ghost will then bias the readout of the current target. Contrary to this prediction, we find that FEF memory representations appear biased away from (not toward) the previous target location. The behavioral and neural data can be reconciled by a model in which receptive fields of memory neurons converge toward remembered locations, much as receptive fields converge toward attended locations. Convergence increases the resources available to encode the relevant memoranda and decreases overall error in the network, but the residual convergence from the previous trial can give rise to an attractive behavioral bias on the next trial.

Keywords: attractor network models; frontal eye fields; proactive interference; receptive field remapping; spatial working memory.


Figures

Figure 1.
Figure 1.
Behavioral task and responses. (a) Memory-guided saccade task. Subjects fixated on a central target presented at the center of the screen. After a fixation period of 400 ms a memory target was displayed for 150 ms at one of 16 possible peripheral locations at a fixed eccentricity. Target presentation was followed by a memory period between 1.4 and 5.6s in duration during which the subject continued to fixate. After the memory period the fixation target disappeared and the subject responded by making a saccade to the remembered location. The dashed gray line indicates where targets might appear; it was not visible to the animal. (b) Saccade endpoints in a subset of representative trials. Gray squares represent target locations. Responses have been colored black or white to more easily identify the associated memory target. (c) Euclidian distance in degrees of visual angle between the mean endpoint of saccades to the target location for each of the 3 subjects (red, green, blue) and for all subjects pooled (black). Significant t-tests (P < 0.05) of the difference between delay lengths are indicated by “*” of the corresponding color. (d) Error in current trial response as a function of previous target location relative to current target location. When the previous target was clockwise from the current target (negative x-axis) the saccadic response was biased clockwise from the current target (negative y-axis) and when the previous target was counter-clockwise from the current target the saccadic response was biased counter-clockwise from the current target. The gray line is the Gabor fit to the raw data (peak-to-peak height = 1.13, fit P < 0.005).
Figure 2.
Figure 2.
Tuned and sustained memory responses in FEF neurons. (a) FEF population response when the memory location was presented at the center of cells' receptive fields (red trace), 22.5° from the receptive field centers (orange trace) or 180° away from the receptive fields (green trace). Firing rates when the target was presented in the receptive field stay high after target offset (150 ms) and for the duration of the memory period. (b) Population firing rate as a function of target location relative to the receptive field is well fit by a Von Mises function (time interval 500–1500 ms, adjusted R2 = 0.99, P < 0.005).
Figure 3.
Figure 3.
Neural activity reflects behavioral responses. (a) Population activity for trials when response error was greater than 12.5° (mean = 16.2; red trace) and less than −12.5° (mean = −16.1°; blue trace). The dotted lines show the encoded location determined with population vector decoding (red trace, 6.9°; blue trace, −15.4°). (b) Linear regression of saccade error predicted by neural activity and response error observed behaviorally for the time interval 500–0 ms prior to the go-cue. Trials are binned by observed response error (−10° to 10°, steps of 5°, bin width of 5°). We also included 2 bins with response error >12.5° (mean = 16.2) and less than −12.5° (mean = −16.1°). The data points outlined in blue and red correspond to the curves in a. The regression line (green) has a slope of 0.70 ° per deg (regression P < 0.015). The dashed line shows a slope of one. (c) Linear regression slopes for the visual period (50–300 ms after target onset; slope = 0.006 ° per deg; P = 0.97), early memory (350–750 ms after target onset; slope = 0.33 ° per deg; P < 0.02), and late memory (−500 to 0 ms prior to go-cue; slope = 0.70 ° per deg P < 0.005).
Figure 4.
Figure 4.
Residual memory tuning from the previous trial. (a) Firing rate of an example cell during fixation as a function of target location on the previous trial. Firing rate is scaled to the tuning amplitude 50–300 ms after target onset and the baseline is removed. (b) Histogram of normalized tuning to the previous target in the current trial fixation period (as in a) for the cell population. Gray bars indicate cells that show a significant difference in firing rates for previous targets in versus out of their receptive fields (P < 0.05) and white bars indicate cells that did not show a significant difference. The asterisk indicates the bin that includes the example cell in a. (c) Population firing rate when the previous target was presented at the center (red trace), 22.5° away (orange trace) or 180° away from the cells' receptive fields (green trace). The blue trace shows the difference between the red and green traces. Note that these traces are sorted by previous target position, not by current target position or by the relative current versus previous target position (compare Figs 2a and 5).
Figure 5.
Figure 5.
Two-dimensional population tuning curve of firing rate as a function of previous and current target location. In both panels, preferred direction of each unit has been rotated to 0°. (a) Neural activity as a function of previous and current target location during the fixation period −375 to −175 ms prior to target onset. Fixation period activity is elevated when the previous target was in the preferred direction (y = 0°). (b) Activity during the memory period 1000–1500 ms after target onset. Activity is high when the current target is in the receptive field (x = 0°). Smaller but clear activity elevation is evident when the previous target was in the preferred direction (y = 0°) and the current target is away from the preferred direction (x > 90°). In these figures, baseline activity of each neuron has been subtracted, but tuning amplitude has not been normalized. Amplitude normalization and baseline subtraction do not affect our results.
Figure 6.
Figure 6.
Population response curves and behavioral readout. (a) When the previous target was at 130° or −130° (red and blue triangle, respectively), the activity in neurons with a preferred direction near 130° or −130° (red and blue traces respectively) is elevated in the current trial. (b) When the previous target was at 40° or −40° (red and blue triangle, respectively), the activity in neurons with a preferred direction near 40° or −40° (red and blue traces respectively) is reduced in the current trial. In a and b baseline activity of each neuron has been subtracted, but tuning amplitude has not been normalized. Amplitude normalization and baseline subtraction do not affect our results. (c) Population vector readout of FEF activity in the interval 1000–1500 ms after target onset. When the previous and current targets are close together (e.g., b), the readout predicts a repulsive bias (orange) away from the previous target location in the behavioral response. When the previous and current targets are far apart (e.g., a), the readout predicts an attractive bias (blue) toward the previous target location.
Figure 7.
Figure 7.
Ghosts of distant targets decay, but shifts resulting from near targets persist. (a) The ghost (the residual activity encoding the previous target) is not sustained through the delay period. Ghost amplitude, measured for previous and current targets that are far from one another (>90° apart), is initially ∼20% as large as the visually evoked response, but decreases with a slope of 4% per second. It disappears entirely after 3.5 s (mean effect 3.5–5.6 s after target onset = 0.02 ± 0.05%, P = 0.736). (b) The disappearance of the ghost in a is not accompanied by a shift of the activity bump (mean shift = −0.57 ± 1.8°, P = 0.737). (c) The shift in the current target representation, measured for previous and current targets that are close together (<90° apart), is largely sustained (slope = −0.24°/s). It remains highly significant even at the end of the delay period (mean effect 3.5–5.6 s after target onset = 4.38 ± 1.26°, P < 0.002). In all panels, red lines are linear fits.
Figure 8.
Figure 8.
Convergence of receptive fields can explain both neuronal activity patterns and behavioral bias. (a) (Left) Example of receptive fields convergence toward the memory target (c = 0.6). Convergence amount is comparable to Zirnsak et al. (2014). (Right) Receptive fields converge toward the current memory target (c = 0.6) with some residual convergence toward the previous target (c = 0.2). (b) Population response curves appear to move away from the previous target location when receptive fields shift toward both the current and previous target (compare Fig. 6b). (c) The population vector sum of population response curves like those in b predict repulsive bias (compare Fig. 6c). (d) When the readout takes receptive field shifts into account (see text) the distorted distribution of receptive fields produces attractive bias (compare Fig. 1d). (e) Response error as a function of RF convergence toward current target (x-axis) in the presence (orange) or absence (blue) of convergence toward the previous target. When noise is added to cell firing rates convergence of receptive fields improves performance, even when some convergence persists into the subsequent trial. See text for additional details.

References

    1. Abbott LF. 1994. Decoding neuronal firing and modelling neural networks. Q Rev Biophys. 27:291–331. - PubMed
    1. Bruce CJ, Goldberg ME. 1985. Primate frontal eye fields. I. Single neurons discharging before saccades. J Neurophysiol. 53:603–635. - PubMed
    1. Bruce CJ, Goldberg ME, Bushnell MC, Stanton GB. 1985. Primate frontal eye fields. II. Physiological and anatomical correlates of electrically evoked eye movements. J Neurophysiol. 54:714–734. - PubMed
    1. Chafee MV, Goldman-Rakic PS. 1998. Matching patterns of activity in primate prefrontal area 8a and parietal area 7ip neurons during a spatial working memory task. J Neurophysiol. 79:2919–2940. - PubMed
    1. Connor CE, Preddie DC, Gallant JL, Van Essen DC. 1997. Spatial attention effects in macaque area V4. J Neurosci. 17:3201–3214. - PMC - PubMed

Publication types