

A pilot study showing associations between frequency of CD4(+) memory cell subsets at diagnosis and duration of partial remission in type 1 diabetes
- PMID: 27114212
- PMCID: PMC4902740
- DOI: 10.1016/j.clim.2016.04.012
A pilot study showing associations between frequency of CD4(+) memory cell subsets at diagnosis and duration of partial remission in type 1 diabetes
Abstract
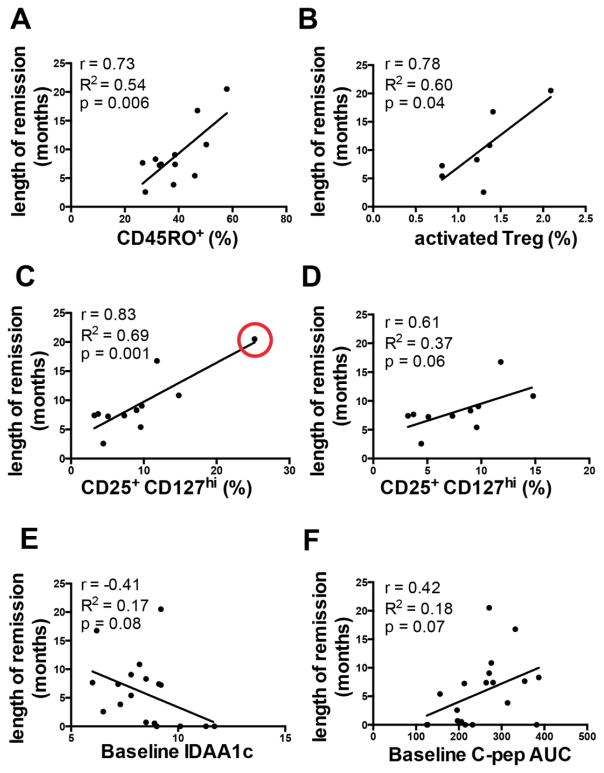
In some patients with type 1 diabetes the dose of insulin required to achieve euglycemia is substantially reduced soon after diagnosis. This partial remission is associated with β-cell function and good glucose control. The purpose of this study was to assess whether frequencies of CD4(+) T cell subsets in children newly diagnosed with type 1 diabetes are associated with length of partial remission. We found that the frequency of CD4(+) memory cells, activated Treg cells and CD25(+) cells that express a high density of the IL-7 receptor, CD127 (CD127(hi)) are strongly associated with length of partial remission. Prediction of length of remission via Cox regression is significantly enhanced when CD25(+) CD127(hi) cell frequency is combined with either Insulin Dependent Adjusted A1c (IDAA1c), or glycosylated hemoglobin (HbA1c), or C-peptide levels at diagnosis. CD25(+) CD127(hi) cells do not express Foxp3, LAG-3 and CD49b, indicating that they are neither Treg nor Tr1 cells.
Keywords: CD25(+) non-Treg; Partial remission; Regulatory cells; T cell subsets; Type 1 diabetes.
Copyright © 2016 Elsevier Inc. All rights reserved.
Conflict of interest statement
All authors declare they have no conflicts of interest.
Figures


Similar articles
-
Human CD4+ CD25+ CD127hi cells and the Th1/Th2 phenotype.Clin Immunol. 2018 Mar;188:103-112. doi: 10.1016/j.clim.2018.01.003. Epub 2018 Jan 10. Clin Immunol. 2018. PMID: 29330114 Free PMC article.
-
Systemic increase in the ratio between Foxp3+ and IL-17-producing CD4+ T cells in healthy pregnancy but not in preeclampsia.J Immunol. 2009 Dec 1;183(11):7023-30. doi: 10.4049/jimmunol.0901154. Epub 2009 Nov 13. J Immunol. 2009. PMID: 19915051
-
Regulatory T cell phenotype and function 4 years after GAD-alum treatment in children with type 1 diabetes.Clin Exp Immunol. 2013 Jun;172(3):394-402. doi: 10.1111/cei.12078. Clin Exp Immunol. 2013. PMID: 23600827 Free PMC article. Clinical Trial.
-
Partial Clinical Remission of Type 1 Diabetes: The Need for an Integrated Functional Definition Based on Insulin-Dose Adjusted A1c and Insulin Sensitivity Score.Front Endocrinol (Lausanne). 2022 May 3;13:884219. doi: 10.3389/fendo.2022.884219. eCollection 2022. Front Endocrinol (Lausanne). 2022. PMID: 35592786 Free PMC article. Review.
-
Lineage origin and transcriptional control of autoantigen-specific T-regulatory type 1 cells.Front Immunol. 2023 Sep 25;14:1267697. doi: 10.3389/fimmu.2023.1267697. eCollection 2023. Front Immunol. 2023. PMID: 37818381 Free PMC article. Review.
Cited by
-
A Phenotypically Distinct Human Th2 Cell Subpopulation Is Associated With Development of Allergic Disorders in Infancy.Allergy. 2025 Apr;80(4):949-964. doi: 10.1111/all.16489. Epub 2025 Feb 3. Allergy. 2025. PMID: 39899007
-
TGF-β-mediated crosstalk between TIGIT+ Tregs and CD226+CD8+ T cells in the progression and remission of type 1 diabetes.Nat Commun. 2024 Oct 15;15(1):8894. doi: 10.1038/s41467-024-53264-8. Nat Commun. 2024. PMID: 39406740 Free PMC article.
-
Partial Clinical Remission of Type 1 Diabetes Mellitus in Children: Clinical Applications and Challenges with its Definitions.Eur Med J Diabetes. 2019 Mar;4(1):89-98. Epub 2019 Mar 14. Eur Med J Diabetes. 2019. PMID: 31069088 Free PMC article.
-
Approaches to Measuring Beta Cell Reserve and Defining Partial Clinical Remission in Paediatric Type 1 Diabetes.Children (Basel). 2024 Feb 2;11(2):186. doi: 10.3390/children11020186. Children (Basel). 2024. PMID: 38397298 Free PMC article. Review.
-
Cancer-driven changes link T cell frequency to muscle strength in people with cancer: a pilot study.J Cachexia Sarcopenia Muscle. 2019 Aug;10(4):827-843. doi: 10.1002/jcsm.12424. Epub 2019 Apr 12. J Cachexia Sarcopenia Muscle. 2019. PMID: 30977974 Free PMC article.
References
-
- Keymeulen B, Somers G. Immunointervention in type 1 (insulin-dependent) diabetes mellitus. Acta Clin Belg. 1993;48:86–95. - PubMed
-
- Bober E, Dunbar B, Buyukgebiz A. Partial remission phase and metabolic control in type I diabetes meelitus in children and adolescents. J Pediatr Endocrinol Metab. 2001;14:435–441. - PubMed
-
- Buyukgebiz A, Cemeroglu AP, Bober E, Mohn A, Chiarelli F. Factors influencing remission phase in children with type I diabetes meelitus. J Periatr Endocrin Metab. 2001;14:1585–1596. - PubMed
-
- Lombardo F, Velenzise M, Wasniewska M, Messina MF, Ruggeri C, Arrigo T, De Luca F. Two-year prospective evaluation of the factors affecting honeymoon frequency and duration in children with insulin dependent diabetes mellitus: the key-role of age at diagnosis. Diabetes Nutr Metab. 2002;15:246–251. - PubMed
Publication types
MeSH terms
Substances
Grants and funding
- U01 DK085476/DK/NIDDK NIH HHS/United States
- U01 DK061010/DK/NIDDK NIH HHS/United States
- U01 DK085466/DK/NIDDK NIH HHS/United States
- U01 DK103153/DK/NIDDK NIH HHS/United States
- U01 DK061058/DK/NIDDK NIH HHS/United States
- U01 DK085505/DK/NIDDK NIH HHS/United States
- U01 DK085453/DK/NIDDK NIH HHS/United States
- U01 DK106984/DK/NIDDK NIH HHS/United States
- U01 DK085499/DK/NIDDK NIH HHS/United States
- U01 DK085463/DK/NIDDK NIH HHS/United States
- R01 CA185349/CA/NCI NIH HHS/United States
- U01 DK103266/DK/NIDDK NIH HHS/United States
- U01 DK107014/DK/NIDDK NIH HHS/United States
- U01 DK061042/DK/NIDDK NIH HHS/United States
- U01 DK061034/DK/NIDDK NIH HHS/United States
- U01 DK085461/DK/NIDDK NIH HHS/United States
- U01 DK085509/DK/NIDDK NIH HHS/United States
- U01 DK103180/DK/NIDDK NIH HHS/United States
- U01 DK085465/DK/NIDDK NIH HHS/United States
- U01 DK085504/DK/NIDDK NIH HHS/United States
LinkOut - more resources
Full Text Sources
Other Literature Sources
Medical
Research Materials
