. 2016 Jun 15;36(13):1820-35.
doi: 10.1128/MCB.00158-16. Print 2016 Jul 1.

Leukemia-Associated Nup214 Fusion Proteins Disturb the XPO1-Mediated Nuclear-Cytoplasmic Transport Pathway and Thereby the NF-κB Signaling Pathway

Affiliations

Leukemia-Associated Nup214 Fusion Proteins Disturb the XPO1-Mediated Nuclear-Cytoplasmic Transport Pathway and Thereby the NF-κB Signaling Pathway

Shoko Saito et al. Mol Cell Biol. .

Abstract

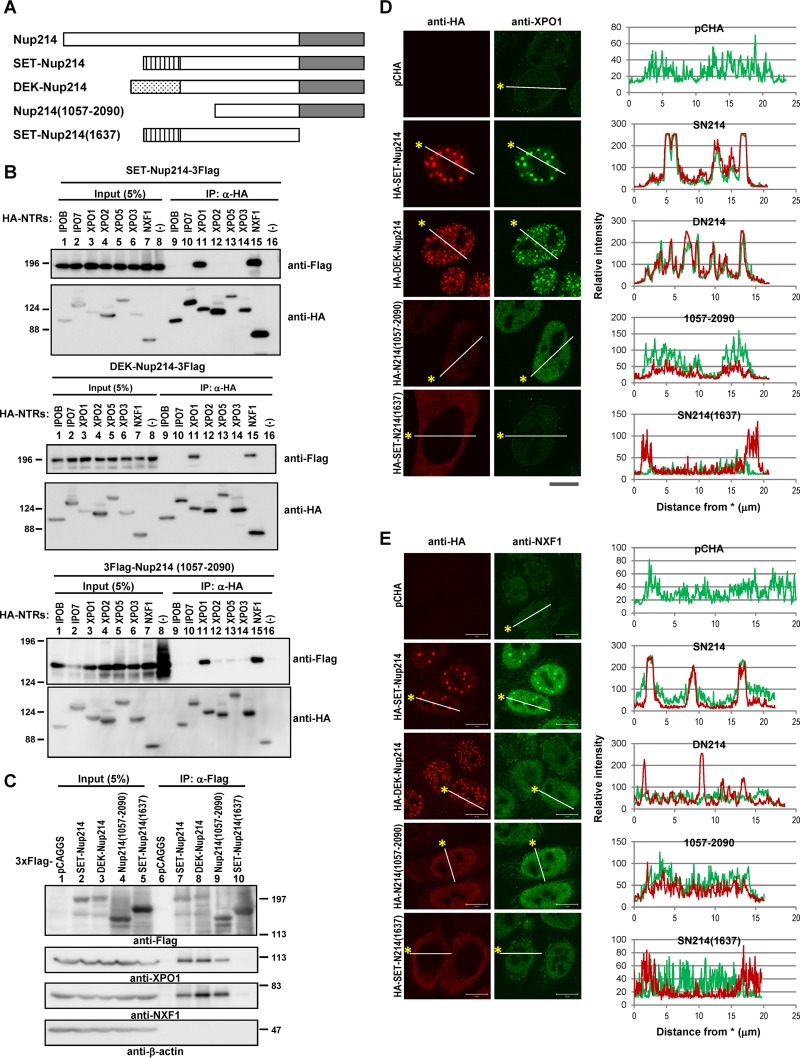
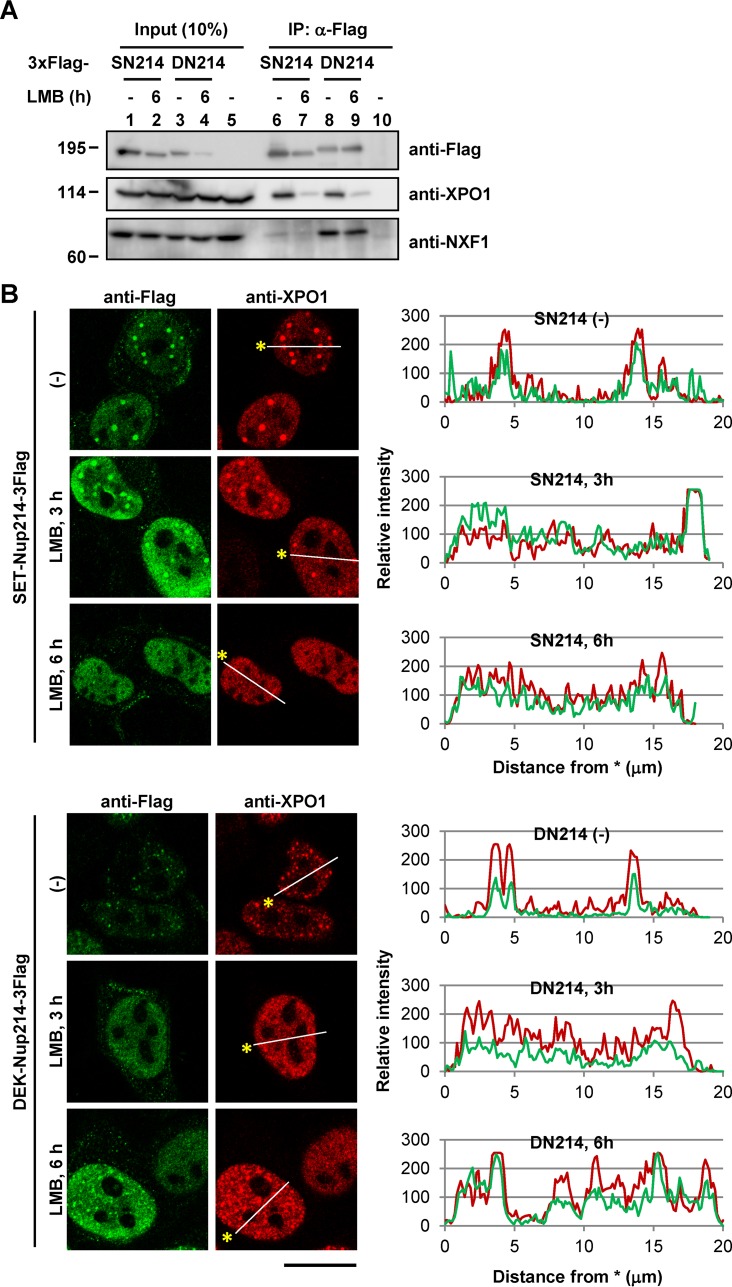
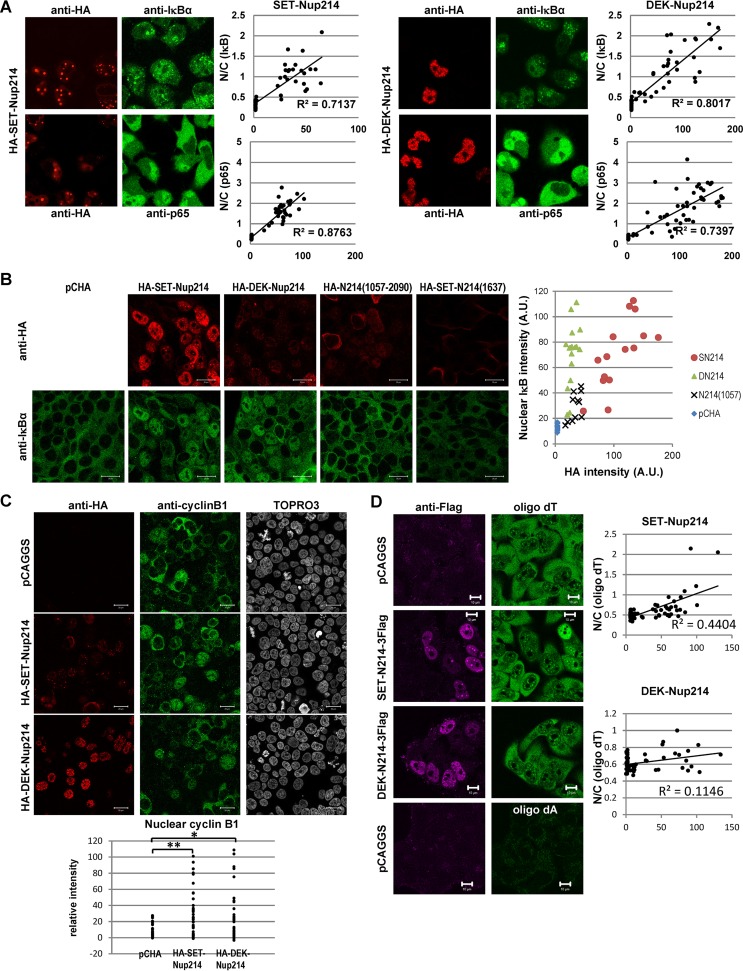
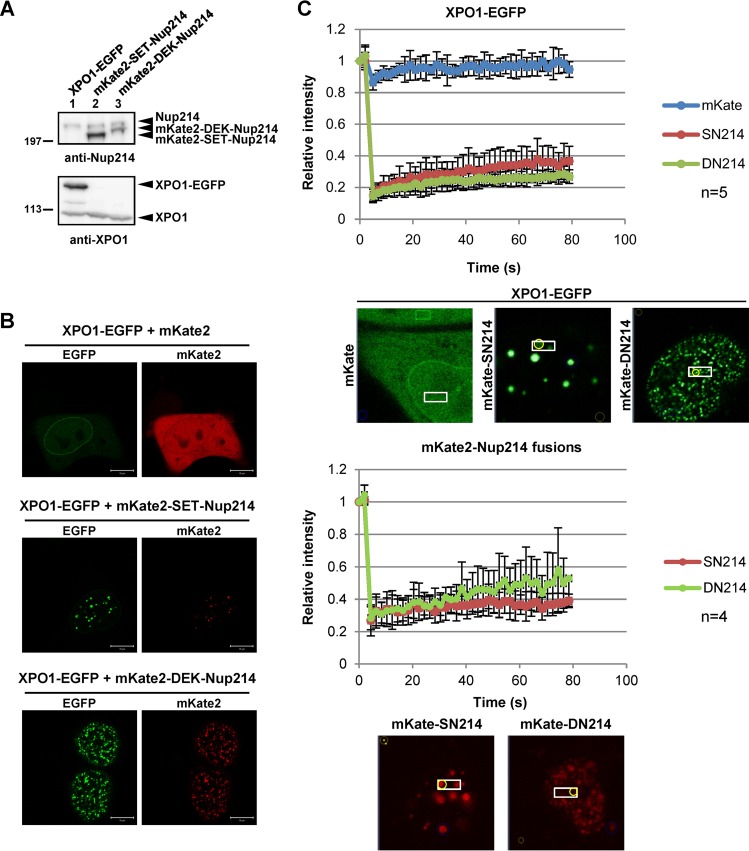
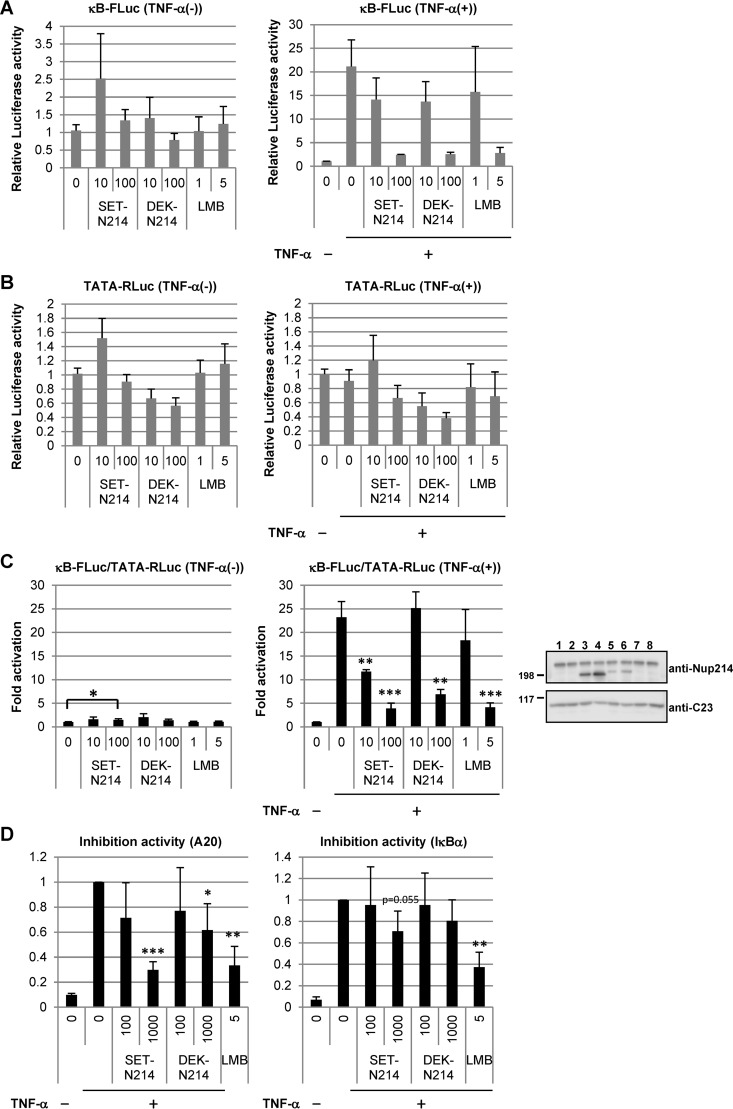
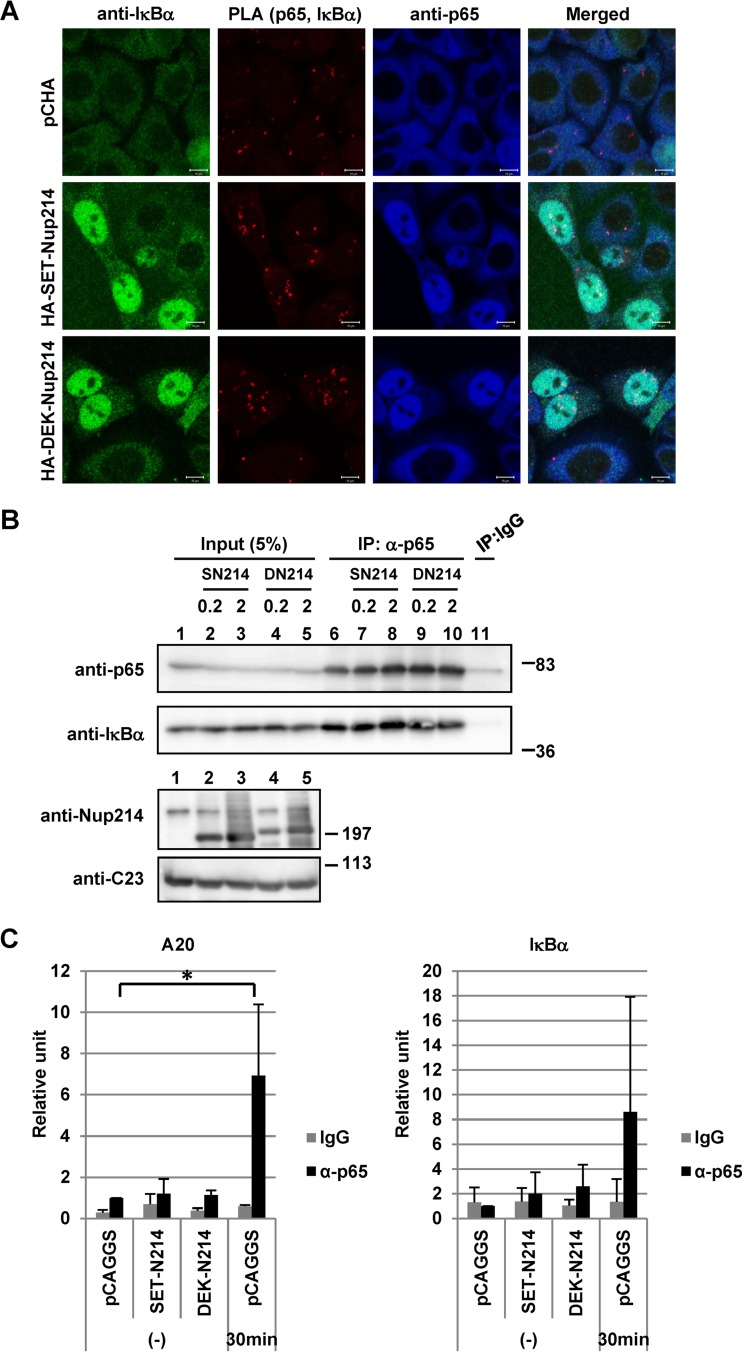
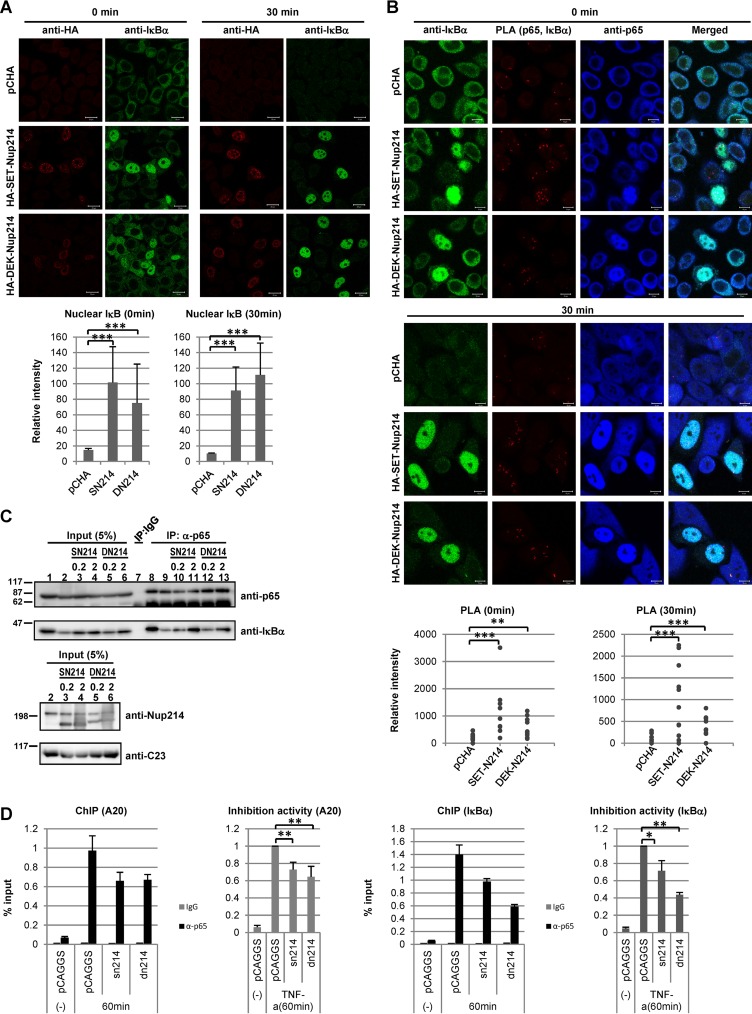
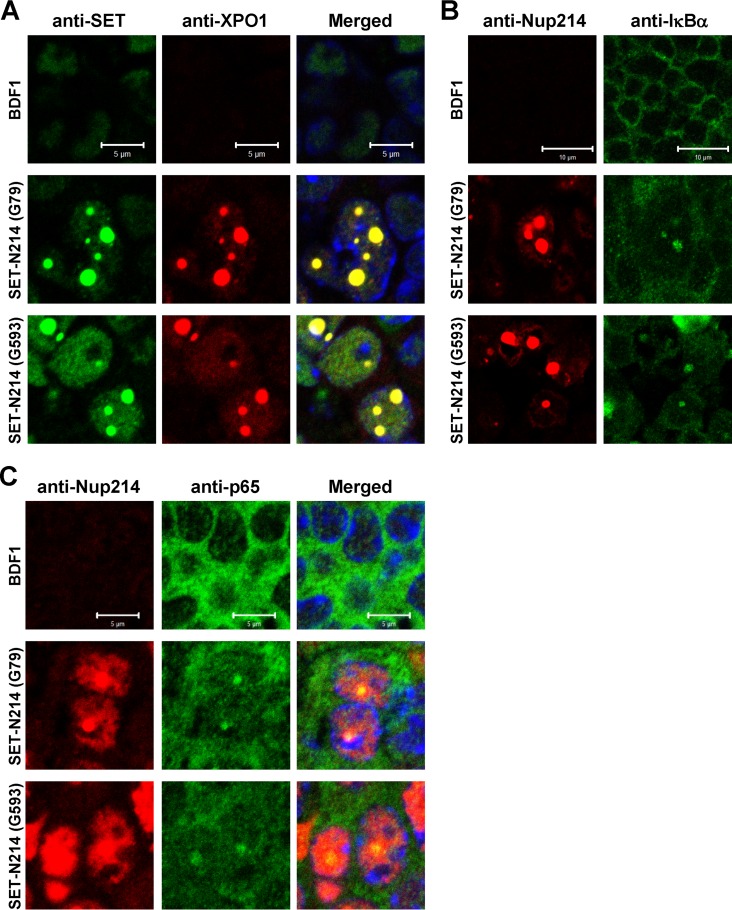
Nuclear-cytoplasmic transport through nuclear pore complexes is mediated by nuclear transport receptors. Previous reports have suggested that aberrant nuclear-cytoplasmic transport due to mutations or overexpression of nuclear pore complexes and nuclear transport receptors is closely linked to diseases. Nup214, a component of nuclear pore complexes, has been found as chimeric fusion proteins in leukemia. Among various Nup214 fusion proteins, SET-Nup214 and DEK-Nup214 have been shown to be engaged in tumorigenesis, but their oncogenic mechanisms remain unclear. In this study, we examined the functions of the Nup214 fusion proteins by focusing on their effects on nuclear-cytoplasmic transport. We found that SET-Nup214 and DEK-Nup214 interact with exportin-1 (XPO1)/CRM1 and nuclear RNA export factor 1 (NXF1)/TAP, which mediate leucine-rich nuclear export signal (NES)-dependent protein export and mRNA export, respectively. SET-Nup214 and DEK-Nup214 decreased the XPO1-mediated nuclear export of NES proteins such as cyclin B and proteins involved in the NF-κB signaling pathway by tethering XPO1 onto nuclear dots where Nup214 fusion proteins are localized. We also demonstrated that SET-Nup214 and DEK-Nup214 expression inhibited NF-κB-mediated transcription by abnormal tethering of the complex containing p65 and its inhibitor, IκB, in the nucleus. These results suggest that SET-Nup214 and DEK-Nup214 perturb the regulation of gene expression through alteration of the nuclear-cytoplasmic transport system.


Figures

FIG 1
FIG 1
Interaction between SET-Nup214 and DEK-Nup214 proteins and NTRs. (A) Schematic representation of the SET-Nup214, DEK-Nup214, Nup214(1057-2090), and SET-Nup214(1637) constructs used in our study and of full-length Nup214. Striped rectangle, SET portion; stippled rectangle, DEK portion; shaded rectangle, FG repeat region. (B) HEK293T cells cultured in 6-well plates were transfected with 1 μg of pCHA-nuclear transport receptors (NTRs) or pCAGGS and 1 μg of pCAGGS-SET-Nup214-3Flag, DEK-Nup214-3Flag, or 3Flag-Nup214(1057-2090). At 2 days after transfection, cells were collected and were subjected to IP assays with 300 ng of anti-HA high affinity antibody (clone 3F10; Roche Diagnostics GmbH), and immunocomplexes were recovered with nProtein A Sepharose Fast Flow (GE Healthcare UK Ltd.). After IP assays, proteins in input lysates and immunoprecipitated samples were separated by 6% SDS-PAGE, and Western blot analyses were performed using anti-Flag M2 (2 μg/ml; Sigma-Aldrich Co. LLC) and anti-HA (clone 3F10; dilution, 1:1,000) antibodies. Molecular weights (in thousands) of prestained markers (Nacalai Tesque, Inc., Japan) are indicated on the left. (C) HEK293T cells cultured in 10-cm dishes were transfected with 5 μg of pCAGGS, SET-Nup214-3Flag, DEK-Nup214-3Flag, 3Flag-Nup214(1057-2090), or 3Flag-SET-Nup214(1637). At 2 days after transfection, cells were collected, and cell lysates were subjected to immunoprecipitation with anti-Flag M2–agarose affinity gel (Sigma-Aldrich Co. LLC). Proteins in input lysates and immunoprecipitated samples were separated by 6.5% SDS-PAGE, and Western blot analyses were performed using anti-Flag, anti-XPO1 (H-300; dilution, 1:1,000; Santa Cruz Biotechnology, Inc.), anti-NXF1 (53H8; dilution, 1:500; Santa Cruz Biotechnology, Inc.), and anti-β-actin (AC-15; dilution, 1:5,000; Sigma-Aldrich Co. LLC) antibodies. Molecular weights (in thousands) of prestained markers are indicated on the right. (D and E) HeLa cells cultured in 35-mm dishes were transfected with pCHA, HA-SET-Nup214, HA-DEK-Nup214, HA-Nup214(1057-2090), or HA-SET-Nup214(1637). At 2 days after transfection, cells were subjected to IF assays. The primary antibodies used were anti-HA (clone 3F10; dilution, 1:100) (D), anti-XPO1 (1:20) (D), rabbit polyclonal anti-HA (1:500) (E), and anti-NXF1 (1:20) (E). Bars, 10 μm. Graphs on the right represent the relative intensities of HA-tagged protein (red) and XPO1 (D) or NXF1 (E) (green).
FIG 2
FIG 2
Dependency of NES proteins on complex and dot formation by either SET-Nup214 or DEK-Nup214 with XPO1. (A) HeLa cells cultured in 35-mm dishes were transiently transfected with 1 μg of either pCAGGS-SET-Nup214-3Flag (SN214), DEK-Nup214-3Flag (DN214), or pCAGGS. At 2 days after transfection, cells were incubated in 5 ng/ml LMB (L-6100; LC Laboratories) for 6 h. After incubation, cells were collected and were subjected to IP assays using Flag M2 beads (lanes 6 to 10). Proteins in the input lysate and immunoprecipitated samples were separated by 6.5% SDS-PAGE, and Western blot analyses were performed using anti-Flag and anti-XPO1 antibodies as primary antibodies. Molecular weights (in thousands) of prestained markers are indicated on the left. (B) The protocol was the same as that for panel A. After cells were collected, IF analyses were performed. Anti-Flag M2 (1:1,000) and anti-XPO1 were used as primary antibodies. Bar, 20 μm. Graphs on the right represent the relative intensities of Flag-tagged protein (green) and XPO1 (red).
FIG 3
FIG 3
Localization of endogenous proteins harboring the NES and mRNA. (A) (Images) HeLa cells were transiently transfected with pCHA-SET-Nup214 or HA-DEK-Nup214 and were subjected to IF assays using anti-HA (clone 3F10), anti-IκBα (C-21; dilution, 1:100; Santa Cruz Biotechnology, Inc.), or anti-p65 (PC137; dilution, 1:100; Calbiochem) antibodies. (Graphs) Fluorescence intensity was determined quantitatively using ImageJ software. Nuclear (N) and cytoplasmic (C) areas were selected manually. The mean intensity of HA-tagged protein in the nucleus minus the mean background intensity is shown along the x axis. The N/C ratio, shown along the y axis, is calculated as (mean intensity of IκBα or p65 in the nucleus − mean background intensity)/(mean intensity of IκBα or p65 in the cytoplasm − mean background intensity). (B) 293T cells were transfected with pCHA, HA-SET-Nup214, HA-DEK-Nup214, HA-Nup214(1057-2090), or HA-SET-Nup214(1637). Two days later, cells were subjected to an immunofluorescence assay using anti-HA (clone 3F10) and anti-IκBα (L35A5; dilution, 1:20; Cell Signaling Technology [CST], Inc.) antibodies. Bars, 20 μm. The fluorescence intensities of nuclear IκBα and HA-tagged protein in each sample were determined quantitatively using ImageJ software and were plotted. A.U., arbitrary units. (C) HeLa cells were transiently transfected with pCHA-SET-Nup214 or DEK-Nup214 and were subjected to IF assays using anti-HA (clone 3F10), anti-cyclin B1 (antibody 4138; dilution, 1:20; CST, Inc.), and TO-PRO-3. Bars, 20 μm. The fluorescence intensity of nuclear cyclin B1 in each cell was determined quantitatively using ImageJ software and was plotted. *, P < 0.005; **, P < 0.0005. (D) HeLa cells were transiently transfected with pCAGGS, SET-Nup214-3Flag, or DEK-Nup214-3Flag and were subjected to IF assays using anti-Flag M2 and to in situ hybridization assays with 10 ng/μl biotinylated oligo(dT)45 or oligo(dA)45 as a probe. Bars, 10 μm. The dot plots show fluorescence intensity, quantified using ImageJ software, as described for panel A.
FIG 4
FIG 4
Decreased mobility of XPO1. (A) HEK293T cells cultured in 35-mm dishes were transiently transfected with 1 μg pHCF1 (XPO1-EGFP expression vector), pmKate2C-SET-Nup214, or pmKate2C-DEK-Nup214. Samples were separated by 5% SDS-PAGE and were subjected to Western blot analyses using anti-Nup214 (dilution, 1:1,000) and anti-XPO1 antibodies. Molecular weights (in thousands) of prestained markers are indicated on the left. (B and C) HeLa cells were transfected with 1 μg pHCF1 and 1 μg either pmKate2C, pmKate2C-SET-Nup214, or pmKate2C-DEK-Nup214. (B) Typical localization patterns of XPO1-EGFP, mKate2, mKate2-SET-Nup214, and mKate2-DEK-Nup214 are shown. Bars, 10 μm. (C) Transfected cells were subjected to FRAP assays as described previously (82).
FIG 5
FIG 5
Effects of SET-Nup214 and DEK-Nup214 on NF-κB transcriptional activity. (A to C) HEK293T cells (3 × 10⁴) cultured in 24-well plates were transfected with pNF-κB40-firefly luciferase (10 ng) and either pCAGGS-SET-Nup214 (SET-N214) or DEK-Nup214 (DEK-N214) (10 or 100 ng). pTA-Renilla luciferase (100 ng) was cotransfected for the normalization of transfection efficiency. At 2 days after transfection, cells were incubated with 1 ng/ml or 5 ng/ml LMB for 30 min. Then recombinant human TNF-α (catalog no. 300-01A; PeproTech) was added at a final concentration of 20 ng/ml; the mixture was incubated for 3 to 4 h; and cell lysates were subjected to luciferase assays using the Dual-Luciferase reporter assay system (Promega) according to the manufacturer's instructions. Luminescence was measured by a Centro XS3 LB 960 luminometer (Berthold Japan K.K.). Relative firefly luciferase activity (A), relative Renilla luciferase activity (B), and normalized luciferase activity (C) were expressed as fold activation relative to the conditions in the leftmost lane (assigned a value of 1). Data are means ± standard deviations for three independent experiments. (C) The P value was calculated relative to the first (left graph) or second (right graph) lane. *, P < 0.05; **, P < 0.005; ***, P < 0.001. Western blot analyses were performed using lysates prepared for luciferase assays in the presence of TNF-α. Anti-Nup214 and anti-C23 (D6; dilution, 1:1,000; Santa Cruz Biotechnology, Inc.) antibodies were used as primary antibodies. Molecular weights (in thousands) of prestained markers are indicated on the left. (D) HEK293T cells (3 × 10⁵) cultured in 6-well plates were transfected with pCAGGS-SET-Nup214 (SET-N214) or DEK-Nup214 (DEK-N214) (100 or 1,000 ng). At 2 days after transfection, cells were incubated with or without 5 ng/ml LMB for 30 min, and TNF-α was added at a final concentration of 20 ng/ml. After TNF-α incubation for 3 to 4 h, cells were collected, and isolated RNAs were subjected to RT-qPCR in order to quantify A20 and IκBα mRNAs. These mRNA expression levels were normalized to the level of β-actin mRNA and are shown as fold inhibition relative to expression in the second lane, taken as 1. Data are means ± standard deviations for three independent experiments. The P value was calculated relative to the value in the second lane. *, P < 0.05; **, P < 0.005; ***, P < 0.001.
FIG 6
FIG 6
Interaction of p65 with IκBα or chromatin in the nucleus. (A) HeLa cells cultured in 6-cm dishes were transfected with 2 μg pCHA, HA-SET-Nup214, or HA-DEK-Nup214. At 2 days after transfection, cells were collected and were subjected to IF assays and PLAs. Anti-p65 (ab7970; dilution, 1:100; Abcam) and anti-IκBα (L35A5; dilution, 1:30; Cell Signaling Technology, Inc.) antibodies were used as primary antibodies. “Merged” panels show composite images of cells stained with Alexa Fluor 488, Detection Reagents Red (for PLA), and Alexa Fluor 633. Bars, 10 μm. (B) HEK293T cells were transfected with pCAGGS, pCAGGS-SET-Nup214 (SN214), or pCAGGS-DEK-Nup214 (DN214) (0.2 or 2 μg) and were incubated for 2 days. Cells were collected, and IP assays were conducted using anti-p65 (ab7970) and rabbit polyclonal IgG antibodies (PP64B) (Merck KGaA, Germany). Proteins in input lysates and immunoprecipitated samples were separated by 10% or 5% SDS-PAGE, and Western blot analyses were performed using anti-p65, anti-IκBα, anti-Nup214, and anti-C23 antibodies. Molecular weights (in thousands) of prestained markers are indicated on the right. (C) HEK293T cells were transfected with 5 μg pCAGGS, pCAGGS-SET-Nup214 (SET-N214), or pCAGGS-DEK-Nup214 (DEK-N214). At 2 days after transfection, cells were either left untreated (−) or treated with TNF-α (20 ng/ml) for 30 min; they were then subjected to ChIP assays using 2 μg anti-IgG or anti-p65 (ab7970) antibodies to measure the binding of p65 to A20 or IκBα promoter regions. The levels of immunoprecipitated DNA were then normalized to the input DNA level. Results are shown as fold activation relative to the level of DNA immunoprecipitated from pCAGGS-transfected lysates by the anti-p65 antibody in the absence of TNF-α. Data are means ± standard deviations for three independent experiments. *, P < 0.05.
FIG 7
FIG 7
Interaction of p65 with IκBα or chromatin in the presence of stimuli. (A) HeLa cells were transfected with 1 μg of pCHA, HA-SET-Nup214, or HA-DEK-Nup214. At 2 days after transfection, cells were treated with TNF-α (10 ng/ml) for 30 min, and IF assays were performed using rabbit polyclonal anti-HA and anti-IκBα (L35A5) antibodies. Bars, 20 μm. The fluorescence intensities of nuclear IκBα in control cells, SET-Nup214-expressing cells, and DEK-Nup214-expressing cells were determined quantitatively using ImageJ software. ***, P < 0.001. (B) The protocol was the same as for panel A. After incubation with anti-p65 (ab7970) and anti-IκBα (L35A5), PLAs were performed. “Merged” panels are composite images of cells stained with Alexa Fluor 488, Detection Reagents Red (for PLA), and Alexa Fluor 633. Bars, 10 μm. The sum of the fluorescence intensities of PLA dots in each cell was quantitated using ImageJ software. **, P < 0.005; ***, P < 0.001. (C) HEK293T cells were transfected with 1 μg pCAGGS, pCAGGS-SET-Nup214 (SN214), or pCAGGS-DEK-Nup214 (DN214) (0.2 or 2 μg). At 2 days after transfection, cells were treated with TNF-α (20 ng/ml) for 30 min and were collected, and IP assays were conducted using anti-p65 (ab7970) and rabbit polyclonal IgG antibodies. Proteins in input lysates and immunoprecipitated samples were separated by 12.5% or 5% SDS-PAGE, and Western blot analyses were performed using anti-p65, anti-IκBα, anti-Nup214, and anti-C23 antibodies. Molecular weights (in thousands) of prestained markers are indicated on the left. (D) HEK293T cells were transfected with 2 μg pCAGGS, pCAGGS-SET-Nup214, or pCAGGS-DEK-Nup214. At 2 days after transfection, cells were either left untreated or treated with TNF-α (20 ng/ml) for 60 min and were then subjected to ChIP assays as for Fig. 6C. Left graphs show representative examples of ChIP-qPCR results, and right graphs show fold inhibition relative to the level of DNA immunoprecipitated from pCAGGS-transfected lysates by the anti-p65 antibody in the presence of TNF-α. Data in graphs on the right are means ± standard deviations for three independent experiments. *, P < 0.05; **P < 0.01.
FIG 8
FIG 8
Subcellular localization of XPO1, IκBα, and p65 in the spleens of set-nup214 transgenic mice. Spleen sections of wild-type BDF1 and set-nup214 transgenic mice (lines G79 and G593) were subjected to IF assays. The primary antibodies used were anti-SET/TAF-Iβ (KM1721; dilution, 1:20) (A), anti-XPO1 (dilution, 1:100) (A), anti-Nup214 (dilution, 1:100) (B and C), anti-IκBα (L35A5; dilution, 1:20) (B), and anti-p65 (F6; dilution, 1:20) (C). “Merged” panels are composite images of cells stained with Alexa Fluor 488, Alexa Fluor 568, and TO-PRO-3. Bars, 5 μm (A and C) and 10 μm (B).

References

    1. Walde S, Kehlenbach RH. 2010. The part and the whole: functions of nucleoporins in nucleocytoplasmic transport. Trends Cell Biol 20:461–469. doi:10.1016/j.tcb.2010.05.001. - DOI - PubMed
    1. Strambio-De-Castillia C, Niepel M, Rout MP. 2010. The nuclear pore complex: bridging nuclear transport and gene regulation. Nat Rev Mol Cell Biol 11:490–501. doi:10.1038/nrm29281. - DOI - PubMed
    1. Wente SR, Rout MP. 2010. The nuclear pore complex and nuclear transport. Cold Spring Harb Perspect Biol 2:a000562. doi:10.1101/cshperspect.a000562. - DOI - PMC - PubMed
    1. Kau TR, Way JC, Silver PA. 2004. Nuclear transport and cancer: from mechanism to intervention. Nat Rev Cancer 4:106–117. doi:10.1038/nrc1274. - DOI - PubMed
    1. O'Brate A, Giannakakou P. 2003. The importance of p53 location: nuclear or cytoplasmic zip code? Drug Resist Updat 6:313–322. doi:10.1016/j.drup.2003.10.004. - DOI - PubMed

Publication types

LinkOut - more resources