

Wide Variability in the Time Required for Immunotoxins to Kill B Lineage Acute Lymphoblastic Leukemia Cells: Implications for Trial Design
- PMID: 27114443
- PMCID: PMC5050065
- DOI: 10.1158/1078-0432.CCR-15-2500
Wide Variability in the Time Required for Immunotoxins to Kill B Lineage Acute Lymphoblastic Leukemia Cells: Implications for Trial Design
Abstract
Purpose: Recombinant immunotoxins (rITs) targeting CD22 are highly active in hairy cell leukemia, but less so in acute lymphoblastic leukemia (ALL). This study aims to understand the variable activity of an rIT against ALL toward improving responses in clinical application.
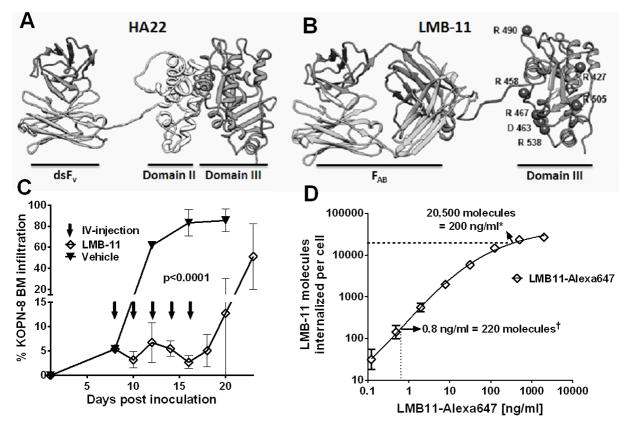
Experimental design: We determined in vitro activity of rITs by WST-8 assays and the time needed to kill ALL cell lines and patient-derived ALL blasts by flow cytometry. The findings were translated into two systemic ALL xenograft models. Differences in time needed to kill KOPN-8 cells for distinct rITs were addressed biochemically.
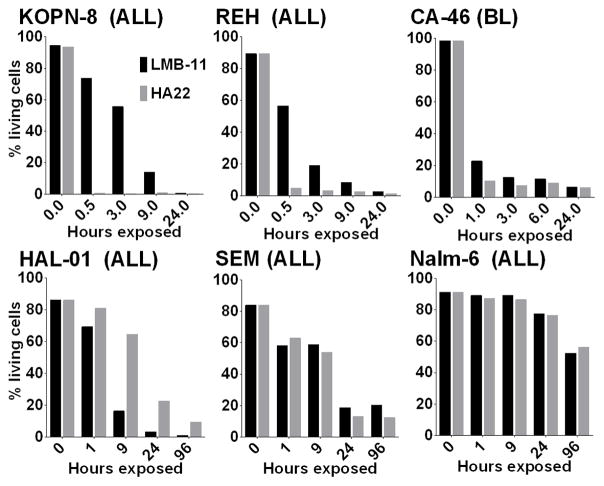
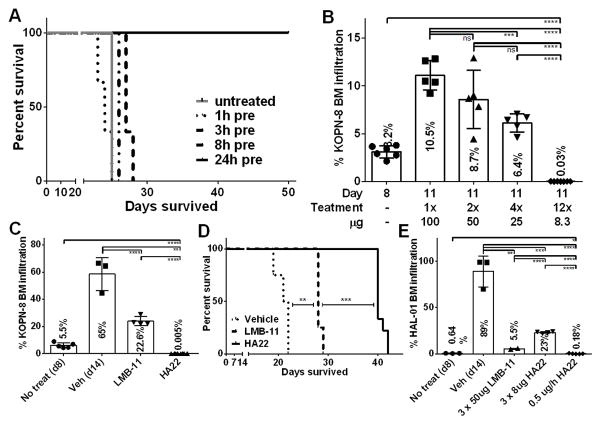
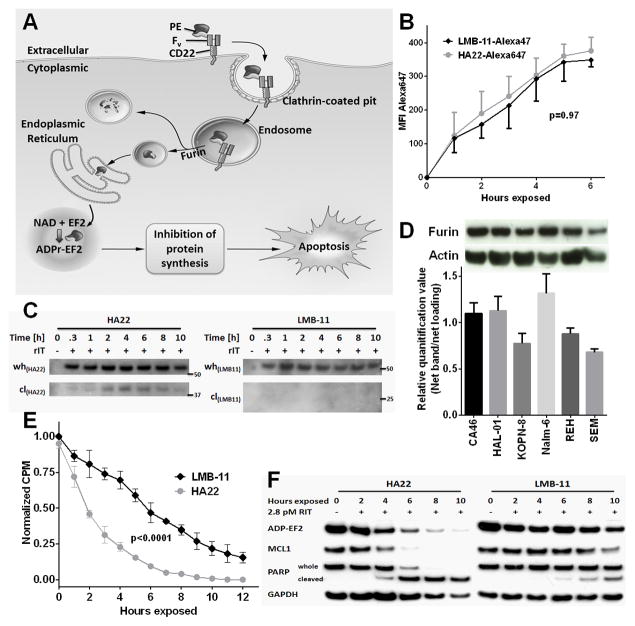
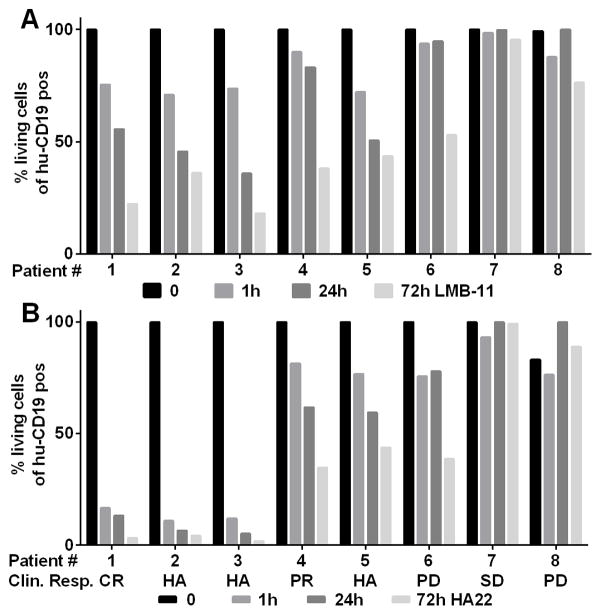
Results: In vitro activity (IC50) of anti-CD22 rIT varied 210-fold from 0.02 to 4.6 ng/mL. Activity also varied greatly depending on the time ALL cells were exposed to immunotoxin from < 30 minutes to > 4 days. For KOPN-8, the difference in exposure time was related to intracellular rIT processing. We showed in newly developed ALL xenograft models, where immunotoxins have a short half-life, that the needed exposure time in vitro predicted the responses in vivo By replacing bolus dose with small doses at frequent intervals or with continuous infusion, responses were substantially improved. We confirmed exposure time variability on patient-derived ALL samples and showed a correlation between exposure time needed to reach maximal cytotoxicity in vitro and their clinical response.
Conclusions: The exposure time needed for rITs targeting CD22 to kill ALL cells varies widely. Our results suggest that ALL patients would have a better response rate to anti-CD22 immunotoxins if treated by continuous infusion rather than by bolus injections. Clin Cancer Res; 22(19); 4913-22. ©2016 AACR.
©2016 American Association for Cancer Research.
Conflict of interest statement
Conflict-of-Interest A.S.W. and I.P. are co-inventors on patents assigned to the NIH for the investigational products. A.S.W. has received from Medimmune: research support, honorarium, travel support; Pfizer, Kite Pharma, and Spectrum Pharmaceuticals: honorarium and travel support. F.M., T.C., X.F.L. and I.P. declare no financial interests.
Figures
Similar articles
-
Paclitaxel synergizes with exposure time adjusted CD22-targeting immunotoxins against B-cell malignancies.Oncotarget. 2017 May 9;8(19):30644-30655. doi: 10.18632/oncotarget.16141. Oncotarget. 2017. PMID: 28423727 Free PMC article.
-
Protein Kinase Inhibitor H89 Enhances the Activity of Pseudomonas Exotoxin A-Based Immunotoxins.Mol Cancer Ther. 2016 May;15(5):1053-62. doi: 10.1158/1535-7163.MCT-15-0828. Epub 2016 Mar 3. Mol Cancer Ther. 2016. PMID: 26939705 Free PMC article.
-
Domain II of Pseudomonas Exotoxin Is Critical for Efficacy of Bolus Doses in a Xenograft Model of Acute Lymphoblastic Leukemia.Toxins (Basel). 2018 May 21;10(5):210. doi: 10.3390/toxins10050210. Toxins (Basel). 2018. PMID: 29883379 Free PMC article.
-
Targeting CD22 in B-cell malignancies: current status and clinical outlook.BioDrugs. 2013 Aug;27(4):293-304. doi: 10.1007/s40259-013-0016-7. BioDrugs. 2013. PMID: 23696252 Review.
-
Immunotoxins for leukemia.Blood. 2014 Apr 17;123(16):2470-7. doi: 10.1182/blood-2014-01-492256. Epub 2014 Feb 27. Blood. 2014. PMID: 24578503 Free PMC article. Review.
Cited by
-
Synergistic immunotoxin-paclitaxel combination against lymphoma.Aging (Albany NY). 2017 Jun 13;9(6):1471-1472. doi: 10.18632/aging.101251. Aging (Albany NY). 2017. PMID: 28637932 Free PMC article. No abstract available.
-
Human CD22-Transgenic, Primary Murine Lymphoma Challenges Immunotherapies in Organ-Specific Tumor Microenvironments.Int J Mol Sci. 2021 Sep 28;22(19):10433. doi: 10.3390/ijms221910433. Int J Mol Sci. 2021. PMID: 34638774 Free PMC article.
-
Phase 1 study of the anti-CD22 immunotoxin moxetumomab pasudotox for childhood acute lymphoblastic leukemia.Blood. 2017 Oct 5;130(14):1620-1627. doi: 10.1182/blood-2017-02-749101. Epub 2017 Aug 9. Blood. 2017. PMID: 28983018 Free PMC article. Clinical Trial.
-
Paclitaxel synergizes with exposure time adjusted CD22-targeting immunotoxins against B-cell malignancies.Oncotarget. 2017 May 9;8(19):30644-30655. doi: 10.18632/oncotarget.16141. Oncotarget. 2017. PMID: 28423727 Free PMC article.
-
Targeted inhibition of protein synthesis renders cancer cells vulnerable to apoptosis by unfolded protein response.Cell Death Dis. 2023 Aug 26;14(8):561. doi: 10.1038/s41419-023-06055-w. Cell Death Dis. 2023. PMID: 37626037 Free PMC article.
References
-
- Oliansky DM, Camitta B, Gaynon P, Nieder ML, Parsons SK, Pulsipher MA, et al. The role of cytotoxic therapy with hematopoietic stem cell transplantation in the treatment of pediatric acute lymphoblastic leukemia: update of the 2005 evidence-based review. ASBMT Position Statement. Biol Blood Marrow Transplant. 2012;18:979–81. - PubMed
-
- Kroger N. Approaches to relapse after allogeneic stem cell transplantation. Curr Opin Oncol. 2011;23:203–8. - PubMed
-
- Holleman A, Cheok MH, den Boer ML, Yang W, Veerman AJ, Kazemier KM, et al. Gene-expression patterns in drug-resistant acute lymphoblastic leukemia cells and response to treatment. N Engl J Med. 2004;351:533–42. - PubMed
MeSH terms
Substances
Grants and funding
LinkOut - more resources
Full Text Sources
Other Literature Sources
