Comparative Study
. 2016 May 10;113(19):E2636-45.
doi: 10.1073/pnas.1525510113. Epub 2016 Apr 25.

Large-scale sequence and structural comparisons of human naive and antigen-experienced antibody repertoires

Affiliations
Comparative Study

Large-scale sequence and structural comparisons of human naive and antigen-experienced antibody repertoires

Brandon J DeKosky et al. Proc Natl Acad Sci U S A. .

Abstract

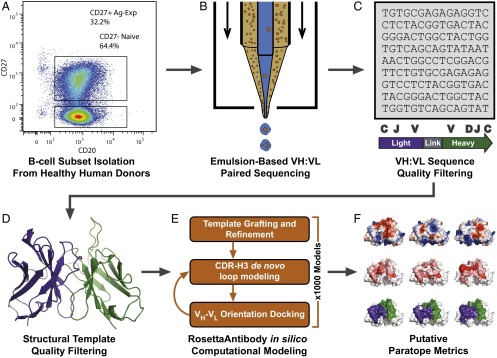
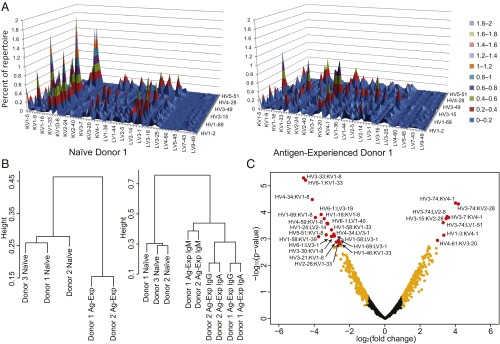
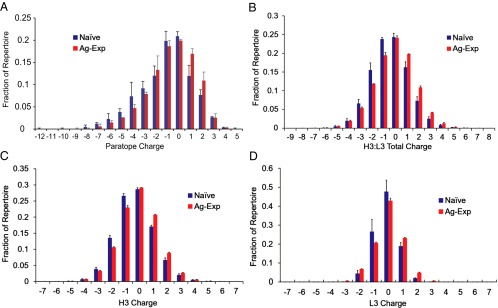
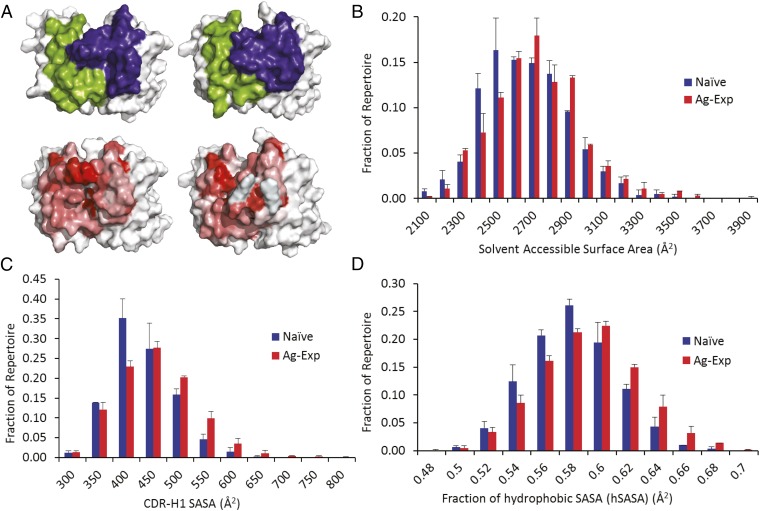
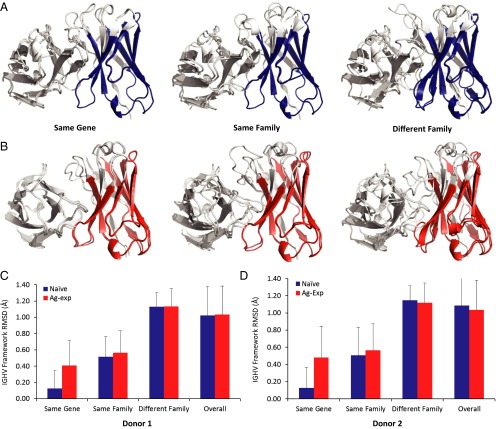
Elucidating how antigen exposure and selection shape the human antibody repertoire is fundamental to our understanding of B-cell immunity. We sequenced the paired heavy- and light-chain variable regions (VH and VL, respectively) from large populations of single B cells combined with computational modeling of antibody structures to evaluate sequence and structural features of human antibody repertoires at unprecedented depth. Analysis of a dataset comprising 55,000 antibody clusters from CD19(+)CD20(+)CD27(-) IgM-naive B cells, >120,000 antibody clusters from CD19(+)CD20(+)CD27(+) antigen-experienced B cells, and >2,000 RosettaAntibody-predicted structural models across three healthy donors led to a number of key findings: (i) VH and VL gene sequences pair in a combinatorial fashion without detectable pairing restrictions at the population level; (ii) certain VH:VL gene pairs were significantly enriched or depleted in the antigen-experienced repertoire relative to the naive repertoire; (iii) antigen selection increased antibody paratope net charge and solvent-accessible surface area; and (iv) public heavy-chain third complementarity-determining region (CDR-H3) antibodies in the antigen-experienced repertoire showed signs of convergent paired light-chain genetic signatures, including shared light-chain third complementarity-determining region (CDR-L3) amino acid sequences and/or Vκ,λ-Jκ,λ genes. The data reported here address several longstanding questions regarding antibody repertoire selection and development and provide a benchmark for future repertoire-scale analyses of antibody responses to vaccination and disease.

Keywords: B cell; antibody; computational modeling; high-throughput sequencing; immunology.


Conflict of interest statement

Conflict of interest statement: G.G., B.J.D., and A.D.E. declare competing financial interests in the form of a patent filed by the University of Texas at Austin.

Figures

Fig. 1.
Fig. 1.
High-throughput pipeline for antibody repertoire sequencing, modeling, and analysis. (A) Peripheral B-cell repertoires from healthy human donors were fractionated into naive (CD3CD19+CD20+CD27) and antigen-experienced (CD3CD19+CD20+CD27+) samples via FACS. (B) B cells were isolated as single cells in emulsion droplets for single-cell mRNA capture, overlap extension linkage RT-PCR, and high-throughput sequencing as previously reported (29, 30). (C) VH:VL sequences were quality filtered for read quality, two or more reads, and 96% CDR-H3 identity clustering to remove sequence errors. Additional quality controls for the naive antibody dataset included filtering for IgM expression and SHM load to enhance data purity beyond the limitations of FACS. (D) Antibodies were selected for modeling from among sequences with the highest read counts and were filtered for CDR-H3 length and the availability of high-quality, high-sequence-similarity structural templates in the PDB. (E) Antibody repertoires were modeled using RosettaAntibody 3.0. (F) CR-paratopes were identified from antibody models and analyzed for charge (Upper), hydrophobicity (Middle), and SASA (Lower). Sequence and structural metrics were analyzed using a variety of statistical approaches to gain new biological understanding from high-throughput antibody repertoire data.
Fig. 2.
Fig. 2.
Paired V-gene use in naive and antigen-experienced B-cell repertoires. (A) Paired heavy:light V-gene use surface maps of antibody sequence repertoires from naive (CD3CD19+CD20+CD27 IgM) (Left) and antigen-experienced (CD3CD19+CD20+CD27+ IgG/IgA/IgM) (Right) repertoires of donor 1 (n = 13,780 and 34,692, respectively). Donor-matched NBCs and AEBCs were isolated from the same time point and blood draw. V-genes are plotted in alphanumeric order, with heights indicating percentage representation among VH:VL clusters. (B) Clustergrams resulting from Pearson hierarchical cluster analysis of paired heavy:light V-gene use across donors; relative distance is indicated by line heights connecting different groups. (Left) Clustering of donor and B-cell subset repertoires. (Right) Clustering of heavy-chain isotype repertoires (naive and antigen-experienced IgM, IgA, and IgG). (C) Volcano plot representation of differences in VH:VL gene use in the NBC and AEBC repertoires. Positive fold-change values denote VH:VL gene pairs that were more frequent in antigen-experienced datasets. Gene pairs with adjusted P values below 0.05 are displayed in red and are listed in SI Appendix, Table S2. Gene pairs with a log2 (fold-change) absolute value of 1 or more and with an adjusted P value greater than 0.05 are displayed in orange. Other gene pairs are displayed in black. A total of 872 VH:VL gene pair combinations was present in all donors and are included in this analysis.
Fig. 3.
Fig. 3.
Charge distributions in naive and antigen-experienced repertoires. (A) CR-paratope charge. (B) Total CDR-H3 and CDR-L3 charge. (C) CDR-H3 charge. (D) CDR-L3 charge for naive and antigen-experienced BCR repertoires. In all panels, differences in charge distribution between naive and antigen-experienced repertoires were statistically significant by the K–S test (P = 3.5 × 10⁻³ for A; P < 10−15 for BD). The number in each group is provided in SI Appendix, Table S1; error bars represent SD.
Fig. 4.
Fig. 4.
Distribution of SASA in naive and antigen-experienced repertoires. (A) CR-paratope SASA (Upper) and hSASA (Lower) of a naive antibody (Left) and antigen-experienced antibody (Right) with SASA or hSASA at the median of the respective distributions. (Upper) VH CR-paratope SASA is shown in blue; VL CR-paratope SASA is shown in green. (Lower) hSASA of the CR-paratope is rendered with each residue colored according to the Eisenberg hydrophobicity scale, from most hydrophobic (red) to least (white). (BD) Total CR-paratope SASA (B), CDR-H1 SASA (C), and fraction of hSASA (D) for naive (blue) and antigen-experienced (red) BCR repertoires. In BD differences between naive and antigen-experienced repertoires were statistically significant by the K–S test (P = 6.5 × 10⁻⁵ for B; P = 2.5 × 10⁻¹² for C; and P = 5.4 × 10⁻¹⁰ for D). The number for each group is provided in SI Appendix, Table S1; error bars represent SD.
Fig. 5.
Fig. 5.
Average rmsd of VH FR1–3 backbone atoms. (A) Superimposed models of two naive antibodies sharing the same IGHV gene segment (Left) or the same IGHV gene family (Center) or from two different IGHV gene families (Right). FR1–3 residues used to calculate pairwise rmsd values are highlighted in blue. (B) Superimposed models of two antigen-experienced antibodies sharing the same IGHV gene segment (Left) or the same IGHV gene family (Center) or from two different IGHV gene families (Right). FR1–3 residues used to calculate pairwise rmsd values are highlighted in red. (C and D) FR average pairwise rmsd for donor 1 (C) and donor 2 (D). Average pairwise rmsds are plotted for antibodies using the same V-gene segment, using the same V-gene family, and using two different V-gene families; naive repertoires are shown in blue, and antigen-experienced repertoires are shown in red; error bars indicate SD. Distribution differences between naive and antigen-experienced repertoires were statistically significant for all comparisons by the K–S test (P < 10−15 in C and D). The number for each group is given in SI Appendix, Table S1; error bars represent SD.

Similar articles

Cited by

References

    1. Murphy K, Travers P, Walport M, Janeway C. Janeway’s Immunobiology. 8th Ed Garland Science; New York: 2012.
    1. Kirkham PM, Schroeder HW., Jr Antibody structure and the evolution of immunoglobulin V gene segments. Semin Immunol. 1994;6(6):347–360. - PubMed
    1. Manser T. Evolution of antibody structure during the immune response. The differentiative potential of a single B lymphocyte. J Exp Med. 1989;170(4):1211–1230. - PMC - PubMed
    1. Schmidt AG, et al. Preconfiguration of the antigen-binding site during affinity maturation of a broadly neutralizing influenza virus antibody. Proc Natl Acad Sci USA. 2013;110(1):264–269. - PMC - PubMed
    1. Li T, et al. Redistribution of flexibility in stabilizing antibody fragment mutants follows Le Châtelier’s principle. PLoS One. 2014;9(3):e92870. - PMC - PubMed

Publication types