. 2016 May 10;113(19):5287-92.
doi: 10.1073/pnas.1519048113. Epub 2016 Apr 25.

Paired octamer rings of retinoschisin suggest a junctional model for cell-cell adhesion in the retina

Affiliations

Paired octamer rings of retinoschisin suggest a junctional model for cell-cell adhesion in the retina

Gökhan Tolun et al. Proc Natl Acad Sci U S A. .

Abstract

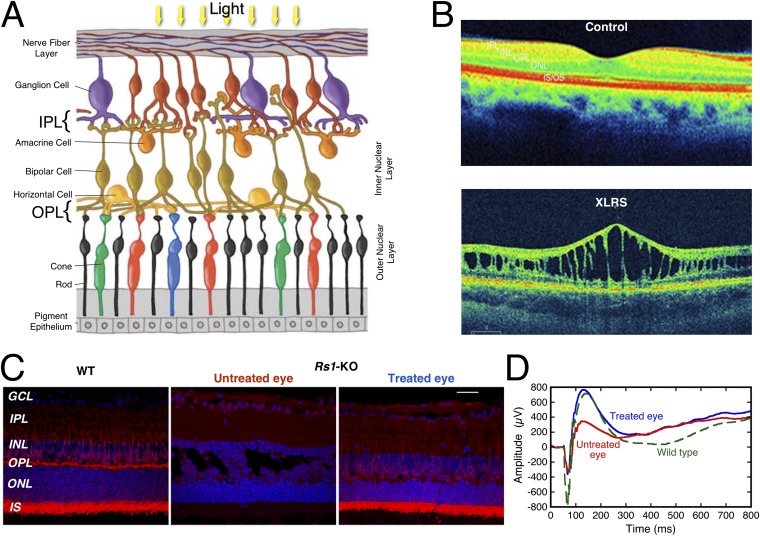
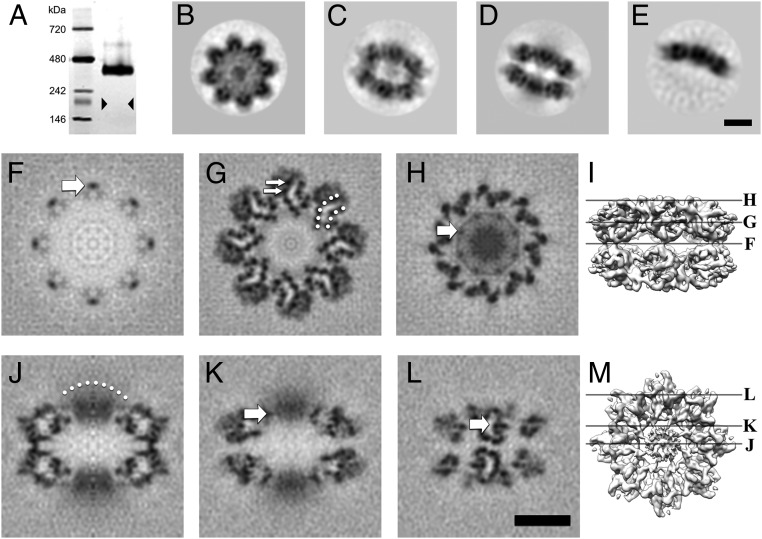
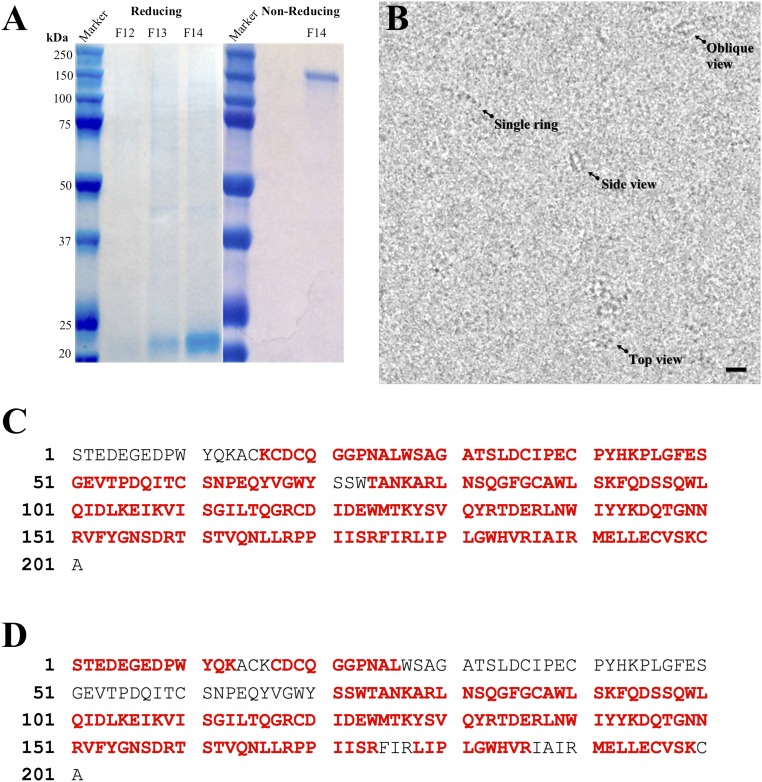
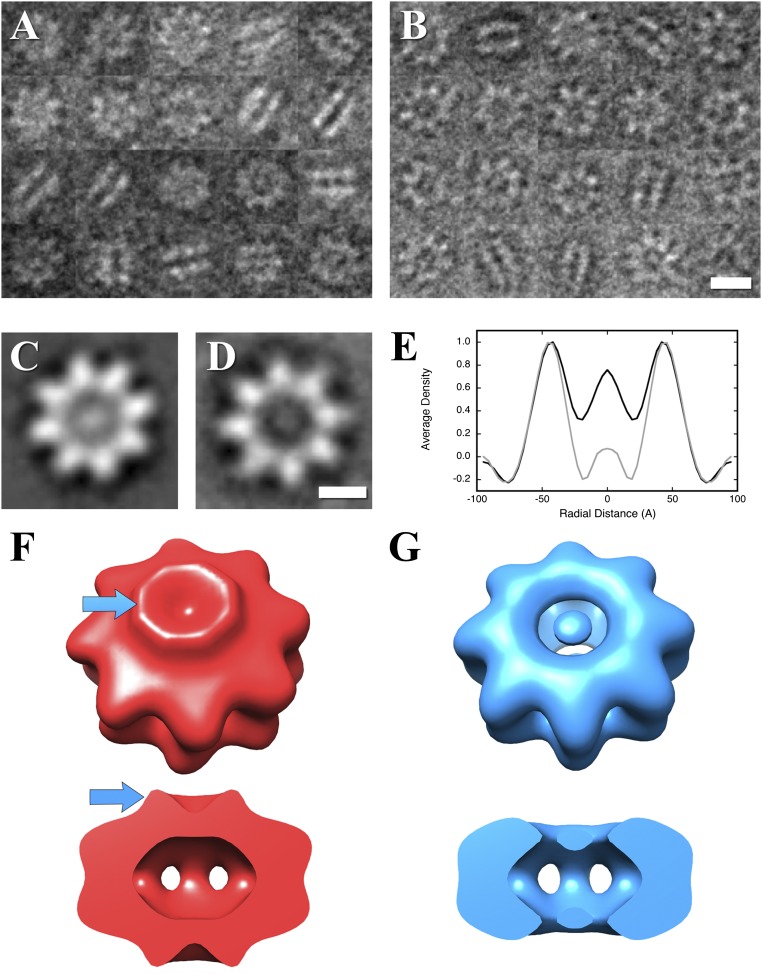
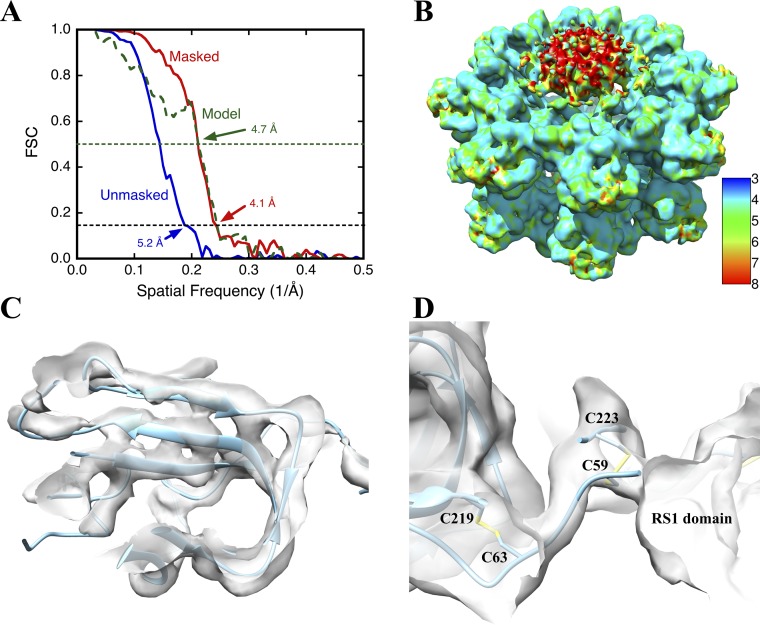
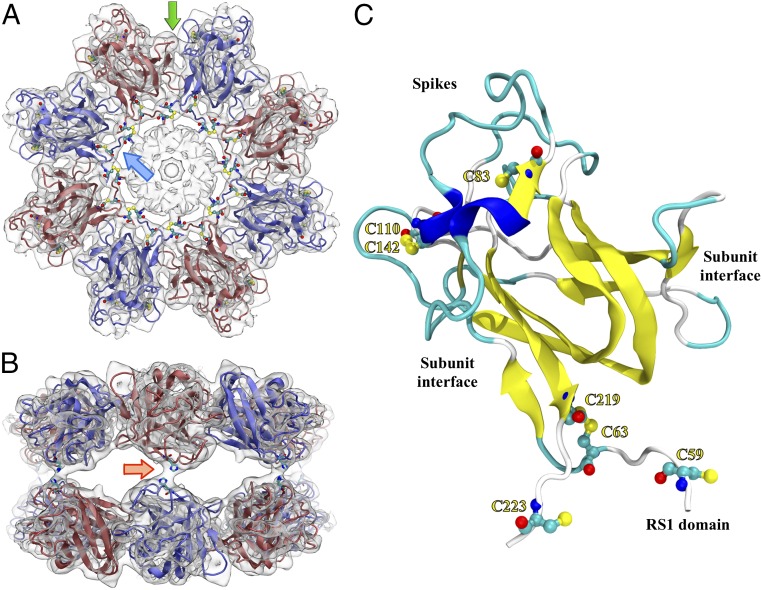
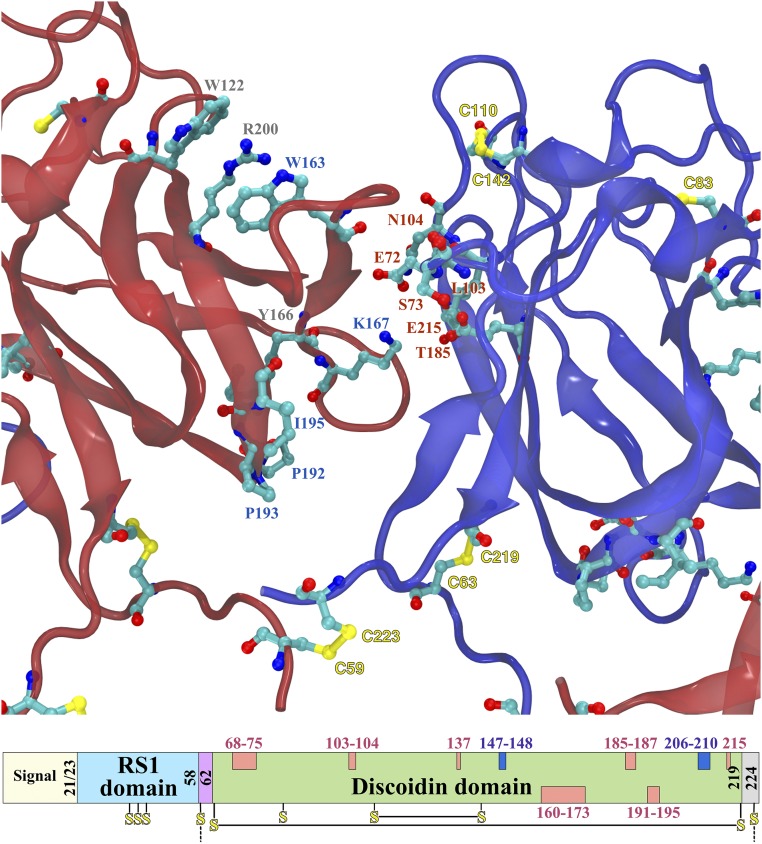
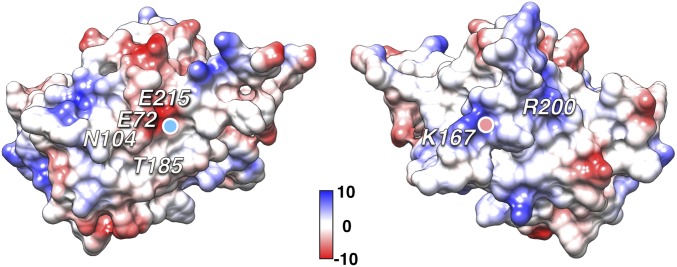
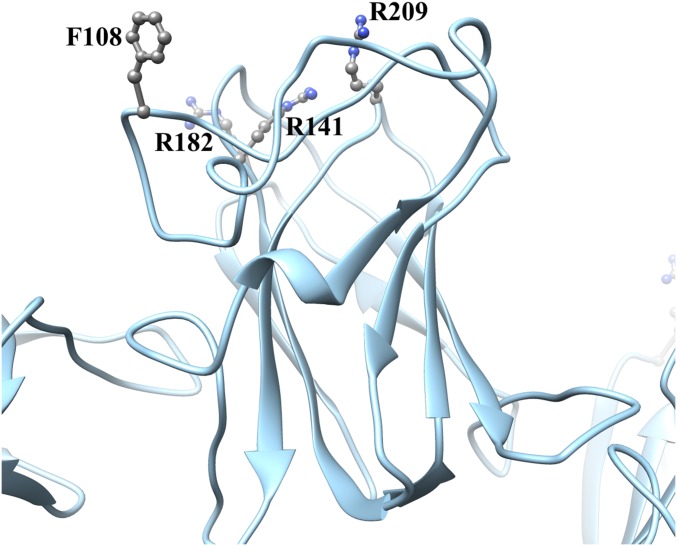
Retinoschisin (RS1) is involved in cell-cell junctions in the retina, but is unique among known cell-adhesion proteins in that it is a soluble secreted protein. Loss-of-function mutations in RS1 lead to early vision impairment in young males, called X-linked retinoschisis. The disease is characterized by separation of inner retinal layers and disruption of synaptic signaling. Using cryo-electron microscopy, we report the structure at 4.1 Å, revealing double octamer rings not observed before. Each subunit is composed of a discoidin domain and a small N-terminal (RS1) domain. The RS1 domains occupy the centers of the rings, but are not required for ring formation and are less clearly defined, suggesting mobility. We determined the structure of the discoidin rings, consistent with known intramolecular and intermolecular disulfides. The interfaces internal to and between rings feature residues implicated in X-linked retinoschisis, indicating the importance of correct assembly. Based on this structure, we propose that RS1 couples neighboring membranes together through octamer-octamer contacts, perhaps modulated by interactions with other membrane components.

Keywords: X-linked retinoschisis; cryo-electron microscopy; discoidin domain; retinoschisin; single particle analysis.


Conflict of interest statement

The authors declare no conflict of interest.

Figures

Fig. S1.
Fig. S1.
Disruption of the retina in XLRS and rescue by recombinant RS1. (A) The layered structure of the retina (adapted from ref. with permission from the Scientific Research Society). (B) Spectral domain-optical coherence tomography (SD-OCT) images of the macular region of the retina from a normal control individual and from a patient with XLRS. (C) Expression of RS1 (red) in retinal sections for a wild-type mouse (Left), an untreated eye of a RS1 knockout mouse (Center), and the other eye treated with a viral vector coding for RS1-FLAG (Right). Blue indicates DAPI nuclear staining. (D) The electroretinograms (ERGs) for the treated (blue) and untreated (red) eyes of a knockout mouse show complete rescue by the recombinant RS1 compared with a wild-type eye (green). Visual perception begins when light reaching the retina activates the rhodopsin in rod and cone photoreceptors cells. The photoreceptors transduce the light energy into electrical impulses that travel to the brain via the optic nerve through the bipolar and ganglion cells. Rods function in dim light, whereas cones respond to bright light. Retinal interneurons, bipolar, horizontal, and amacrines integrate visual information for brightness, color contrast, and motion before transmittal to the ganglion cells. The outer plexiform layer (OPL) is a dense network of synapses where neural connections are established between axon terminals of rods/cones and dendrites of bipolar and horizontal cells. The inner plexiform layer (IPL) is where bipolar, amacrine, and ganglion cells interact and form synapses and the axons of ganglion cells converge to form the optic nerve. Integrity of retinal cell function and their organization are critical for visual function. XLRS, an early form of visual impairment in young males is caused by mutations in the X-linked RS1 gene. XLRS pathology is characterized by splitting of inner retinal layers and is mainly seen at the OPL and in the bipolar cell layer (inner nuclear layer). SD-OCT is a noninvasive diagnostic technique that uses light waves to take cross-section pictures of the retina at ∼20,000–40,000 scans per second and 3-μm resolution. With OCT, each of the retina’s distinctive layers can be seen allowing mapping and measuring their thickness. In contrast to the normal eye, an XLRS-affected eye shows prominent splitting of the inner nuclear layer (INL) and abnormally thin outer nuclear layer (ONL). [We thank C. A. Cukras (National Eye Institute, Bethesda, MD) for providing retina images]. The construct used in this paper is tagged at the C terminus with six histidines to aid in purification. This is expected to be active in vivo based on a related gene-therapy experiment done with a C-terminal FLAG tag. An AAV8 vector that contained the human RS1 cDNA with a FLAG tag (sequence: DYKDDDDK) at the C terminus driven by a CMV promoter was administered into the left eye of an Rs1-null mouse (Rs1-KO) by intravitreal injection at 40 d of age (P40). The contralateral right eye was injected with PBS. Retinal morphology and functions were analyzed 60 d postinjection (P100). Retinal sections were examined for RS1-FLAG expression by fluorescent microscopy, with expression most intense in the photoreceptor layer and in bipolar cells. The ERG of the PBS-injected control eye (red curve) shows a suppressed b-wave amplitude typical for Rs1-KO mice (∼672 µV), whereas the AAV-CMV-RS1-FLAG injected eye (blue curve) reverted to a normal b-wave amplitude similar to the wild type (green curve) (∼1120 µV). Therefore, the tagged RS1 protein augmented signaling across the rod-to-bipolar cell synapses that lie within the OPL. These results demonstrate: (i) that the injection of an adeno-associated virus (AAV)-based RS1-FLAG vector is able to transduce the retina and rescue the XLRS disease phenotype, and (ii) the FLAG tag does not influence the in vivo function of RS1 protein. GCL, ganglion cell layer; INL, inner nuclear layer; IPL, inner plexiform layer; IS, inner segments; ONL, outer nuclear layer; OPL, outer plexiform layer.
Fig. 1.
Fig. 1.
RS1 is predominantly a 16-mer arranged as back-to-back octamer rings. (A) A silver-stained blue native gel showing an oligomer of ∼400 kDa, much larger than an octamer (triangles indicate the expected band position). (B–E) Selected 2D class averages derived from micrographs of frozen-hydrated RS1 particles: (B) top view average; (C) oblique view average of double octamer rings; (D) side view average of double octamer rings; (E) side view average of single octamer rings. (F–M) Selected slices through the 3D reconstruction. (F) Central slice at the interface between the two octamer rings, the arrow indicating one of the narrow connections between the rings. (G) Slice 16.5 Å from the center, with the two β-sheets indicated by dotted arcs and two β-strands indicated by arrows. (H) Slice 33 Å from the center, the arrow indicates a node in the ring (the site of an intermolecular disulfide bond) around the diffuse density in the middle (8 RS1 domains). (I) Guide to the slice levels in F–H. (J) Central slice on a twofold axis, the dotted arc indicating a diffuse density composed of eight N-terminal RS1 domains. (K) Slice 10 Å from the center showing the node (arrow) corresponding to that in H. (L) Slice 48 Å from the center, showing the two curved β-sheets with low density in between (arrow). The latter is occupied by bulky side chains in the core of the domain not resolved in this map. (M) Guide to the slice levels in J–L. (Scale bars, 50 Å.)
Fig. S2.
Fig. S2.
Identification of purified RS1-6His. (A) SDS/PAGE of purified RS1-6His in fractions eluted from the Mono Q column (F12–F14), showing the ∼23-kDa monomer in the reduced gel and the ∼180-kDa octamer in the nonreduced gel. (B) Field of RS1 particles embedded in vitrous ice, showing top, oblique, and side views of the double rings and few single rings. (moderately low-pass–filtered to improve visualization). (Scale bar, 100 Å.) (C) Coverage of the sequence (red: 90%) analyzed by LC-MS/MS of a chymotrypsin digest. (D) Coverage of the sequence (red: 72%) analyzed by LC-MS/MS of a trypsin digest. RS1-6His was expressed in baculovirus-infected Sf9 insect cells, and the protein secreted into the culture medium was purified on His Pur Cobalt resin followed by anion-exchange chromatography on a Mono Q column, as described in Methods. RS1-6His was eluted with a salt (NaCl) gradient in 20 mM Tris⋅HCl (pH 8.0) buffer and fractions run with β-mercaptoethanol (reducing) or without (nonreducing), stained with Coomassie blue. In the reducing gel, the major band at ∼23 kDa is the RS1 monomer, with minor bands corresponding to oligomers. Molecular weight markers are shown on the left side in each panel. The RS1-6His band was excised from a gel, reduced with DTT and alkylated with iodoacetamide. Half of the sample was digested in the gel with trypsin, and the other half with chymotrypsin. The digests were desalted using a Waters HLB µElution plate. The LC-MS/MS experiment was performed on an Orbitrap Elite Mass Spectrometer (Thermo Scientific) coupled to an Ultimate 3000 HPLC (Thermo-Dionex). Peptides were separated on an ES800 Easy-Spray column (75 μm × 15 cm, 3 μm C18 beads). The mobile phases were composed of 0.1% formic acid in 2% (vol/vol) acetonitrile (MPA) and 0.1% formic acid in 98% acetonitrile (MPB). The gradient began at 2% MPB rising to 27% MPB in 25 min at a flow rate of 300 nL/min. MS scans were acquired using an m/z range of 300–2,000, 60k resolution at m/z 400. MS/MS scans were acquired on the top five most abundant precursor ions using an isolation window of 1.9, CID fragmentation with decision tree method activated, an intensity threshold of 50,000 counts, and a dynamic exclusion of 9 sec Xcalibur RAW files were converted to peak list files in mgf format using Mascot Distiller (v2.5.1.0). The database search was performed using Mascot Daemon (2.4.0) against an in-house database, which contains the mature RS1 (Retinoschisin) protein sequence and the NCBI human database. The false discovery rate was less than 1%.
Fig. S3.
Fig. S3.
The RS1 domain does not affect oligomerization. (A) Negative-stain electron micrograph images of RS1 wild-type. (B) Negative-stain electron micrograph images of an N-terminal deletion mutant, RS1-∆N. (Scale bar, 100 Å.) (C) Two-dimensional class average of wild-type top views, showing a central density. (D) Two-dimensional class average of mutant top views without a central density. (Scale bar, 50 Å.) (E) Radial average profiles of the wild-type and mutant top views show that the density in the center of the mutant protein (radius 0–20 Å) is similar to the background (radius 70–95 Å). Side views in A and B show both wild-type and mutant to be double-ring structures for the great majority of the particles. (F) Reconstruction of the wild-type particle showing the RS1 domains as a ridge (blue arrows). (G) Reconstruction of the N-terminal deletion mutant, RS1-∆N, showing the absence of the RS1 domains.
Fig. S4.
Fig. S4.
Quality of the RS1 map. (A) The resolution of the RS1 reconstruction was estimated by Fourier shell correlation (FSC) between two half-maps unmasked (blue) and masked (red), using the 0.143 cut-off (black dashed line). Also shown is the FSC curve (green) between the full map (masked) and density generated from the fitted model, using a cut-off of 0.5 (green dashed line) to estimate the agreement. The mask was generated with a soft edge and covered only the DS domains. (B) Local resolution analysis of the RS1 map. The scale indicates the color-mapping of resolution values of 3 Å to 8 Å. The N-terminal RS1 domain in the center of the ring shows lower resolution (∼9 Å, red parts), consistent with a partially ordered structure. The rest of the structure is around 4 Å, sufficient to resolve β-strands. (C) Illustration of map detail. The three strands of one β-sheet are clearly resolved (separation distance of 4.7 Å; isosurface at 3.5σ). (D) The intrasubunit disulfide bond (C63–C219) is readily formed within the DS domain fold. The intersubunit disulfide bond (C59–C223) fits into a density node between subunits.
Fig. 2.
Fig. 2.
Top (A) and side (B) views of the RS1 double octamer with one subunit model highlighted (C). (A) The blue arrow points to a rod-like density connecting neighboring subunits between the DS and RS1 domains. All cysteine residues are indicated, including the intramolecular disulfides, C63–C219 and C110–C142. C59 and C223 form disulfide bonds with neighboring subunits. The green arrow points to a subunit-subunit interface further detailed in Fig. 3. (B) The RS1 side view shows the connections between the octameric rings (one indicated by the red arrow). H207 is located in this contact site and is potentially involved in the interaction. (C) The monomer ribbon is colored to indicate β-strands (yellow), helices (blue), and coil (cyan) secondary structure.
Fig. 3.
Fig. 3.
XLRS-related mutations in the subunit interface and the corresponding positions in the sequence. The interface between adjacent subunits within an octameric ring (as seen from center) is composed of a long loop on the left subunit (red) and mainly the β-sheet face on the right subunit (blue) composed of residues 137, 139, 183–187, and 215. The interface loop (160–173) on the left are likely stabilized by the “sandwich” W122-R200-W163, and the interaction of Y166 with the 192–195 loop. A potential salt bridge can be formed between K167 and either E72 or E215. In the domain scheme at the bottom, the sequence locations of the subunit interfaces in the DS domain are shown in pink (those at the top are for the right side and those at the bottom for the left side). Residues potentially involved in the octamer ring connections are shown in dark blue.
Fig. 4.
Fig. 4.
Charge complementarity of the two interacting RS1 subunit surfaces. The Coulombic surfaces of two subunits are shown with their N and C termini facing each other. Charge-altering disease-linked mutants in the interface residues include E72K, N104K, T185K, E215K (Left) and K167E (Right). The lysine 167 fits into the negatively charged pocket formed by the glutamates 72 and 215 (the light blue dot on the left surface indicates where K167 fits, and the pink dot on the right surface indicates where E72 fits). Arginine 200 (Right surface) does not interact with a neighboring subunit, but rather stabilizes interface residues on the ridge to the left of it. Scale in kcal/mol.e. [Calculated in UCSF Chimera with default settings for Coulombic surfaces (48).]
Fig. S5.
Fig. S5.
Four XLRS-linked mutants located in the RS1 spikes. Mutants in these residues are in general secreted, with the exception of R141C/V/Q/E/K (26).

Similar articles

Cited by

References

    1. Al-Amoudi A, et al. The three-dimensional molecular structure of the desmosomal plaque. Proc Natl Acad Sci USA. 2011;108(16):6480–6485. - PMC - PubMed
    1. Furuse M. Molecular basis of the core structure of tight junctions. Cold Spring Harb Perspect Biol. 2010;2(1):a002907. - PMC - PubMed
    1. Haseloff RF, Dithmer S, Winkler L, Wolburg H, Blasig IE. Transmembrane proteins of the tight junctions at the blood-brain barrier: Structural and functional aspects. Semin Cell Dev Biol. 2015;38:16–25. - PubMed
    1. Sosinsky GE, Nicholson BJ. Structural organization of gap junction channels. Biochim Biophys Acta. 2005;1711(2):99–125. - PubMed
    1. Molday RS. Focus on molecules: Retinoschisin (RS1) Exp Eye Res. 2007;84(2):227–228. - PubMed

Publication types

MeSH terms

Associated data