. 2016 May 10;113(19):5382-7.
doi: 10.1073/pnas.1604905113. Epub 2016 Apr 25.

Relationships among CFTR expression, HCO3- secretion, and host defense may inform gene- and cell-based cystic fibrosis therapies

Affiliations

Relationships among CFTR expression, HCO3- secretion, and host defense may inform gene- and cell-based cystic fibrosis therapies

Viral S Shah et al. Proc Natl Acad Sci U S A. .

Abstract

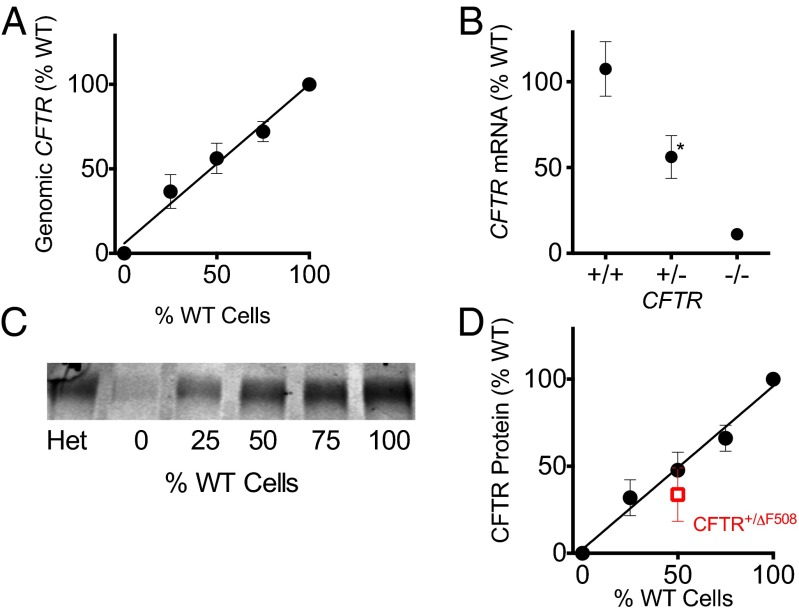
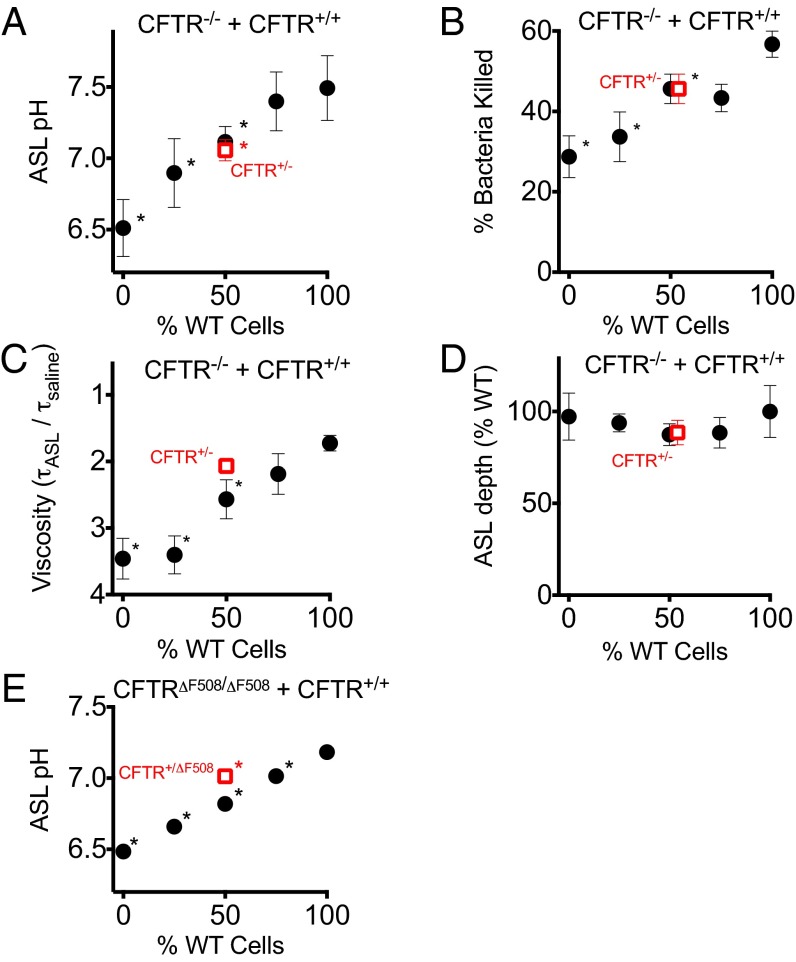
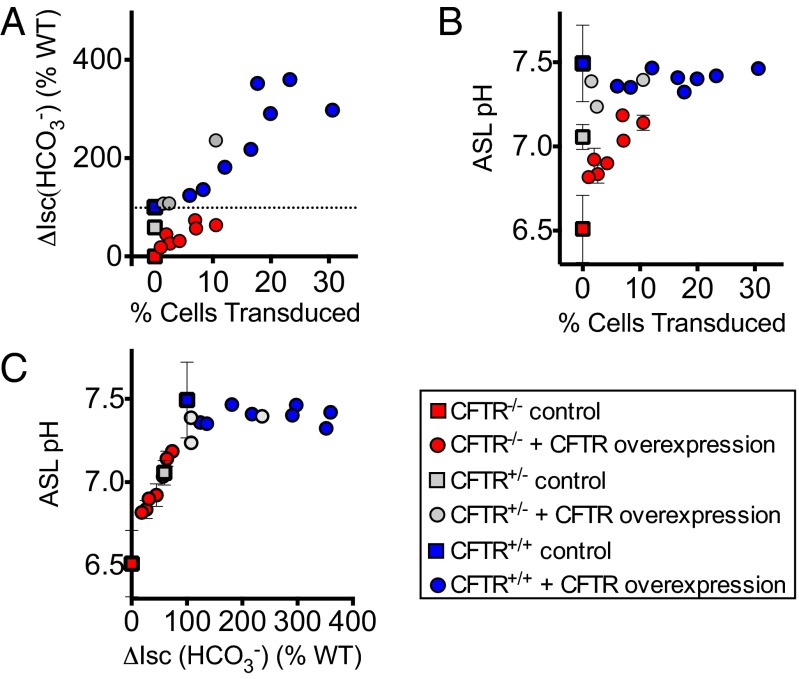
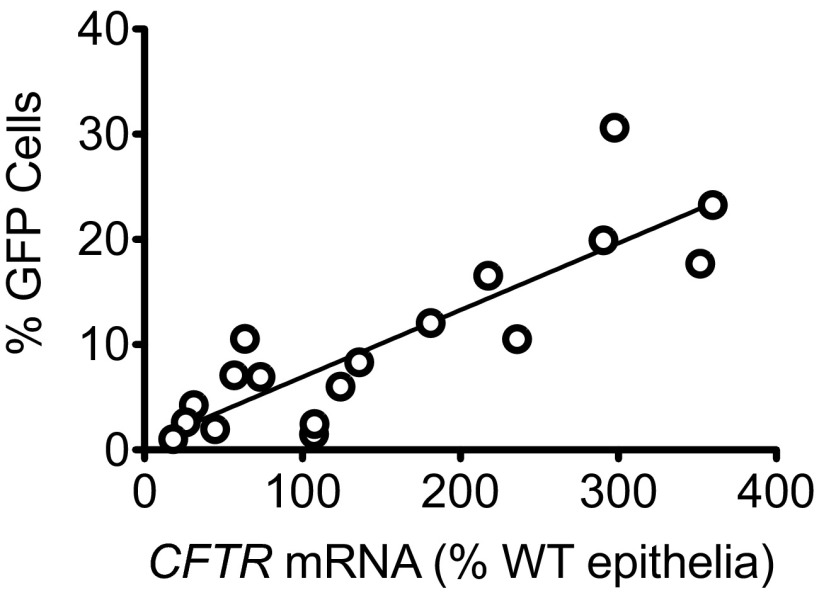
Cystic fibrosis (CF) is caused by mutations in the gene encoding the cystic fibrosis transmembrane conductance regulator (CFTR) anion channel. Airway disease is the major source of morbidity and mortality. Successful implementation of gene- and cell-based therapies for CF airway disease requires knowledge of relationships among percentages of targeted cells, levels of CFTR expression, correction of electrolyte transport, and rescue of host defense defects. Previous studies suggested that, when ∼10-50% of airway epithelial cells expressed CFTR, they generated nearly wild-type levels of Cl(-) secretion; overexpressing CFTR offered no advantage compared with endogenous expression levels. However, recent discoveries focused attention on CFTR-mediated HCO3 (-) secretion and airway surface liquid (ASL) pH as critical for host defense and CF pathogenesis. Therefore, we generated porcine airway epithelia with varying ratios of CF and wild-type cells. Epithelia with a 50:50 mix secreted HCO3 (-) at half the rate of wild-type epithelia. Likewise, heterozygous epithelia (CFTR(+/-) or CFTR(+/∆F508)) expressed CFTR and secreted HCO3 (-) at ∼50% of wild-type values. ASL pH, antimicrobial activity, and viscosity showed similar relationships to the amount of CFTR. Overexpressing CFTR increased HCO3 (-) secretion to rates greater than wild type, but ASL pH did not exceed wild-type values. Thus, in contrast to Cl(-) secretion, the amount of CFTR is rate-limiting for HCO3 (-) secretion and for correcting host defense abnormalities. In addition, overexpressing CFTR might produce a greater benefit than expressing CFTR at wild-type levels when targeting small fractions of cells. These findings may also explain the risk of airway disease in CF carriers.

Keywords: cystic fibrosis; epithelia; gene therapy; host defense; pig.


Conflict of interest statement

Conflict of interest statement: M.J.W. holds equity in Exemplar Genetics, which has licensed CF pigs from the University of Iowa.

Figures

Fig. 1.
Fig. 1.
The amount of CFTR varies with the percentage of WT cells and with the heterozygous state. (A) Airway epithelia were generated with varying ratios of CFTRF508/∆F508 and CFTR+/+ cells. Quantitative polymerase chain reaction (qPCR) of genomic DNA was used to determine the fraction of WT CFTR DNA. Data are normalized to 0% for CFTRF508/∆F508 epithelia and 100% for WT epithelia. Data are mean ± SEM; n = 4. Line is linear regression, R2 = 0.88, P < 0.0001. (B) Quantitative reverse transcription polymerase chain reaction was used to assay CFTR mRNA in CFTR+/+, CFTR+/−, and CFTR−/− airway epithelia. Data are mean ± SEM normalized to CFTR mRNA in CFTR+/+ epithelia; n = 4. The * indicates P < 0.05 relative to CFTR+/+ by unpaired Student's t test. (C) Example of Western blot of CFTR in airway epithelia generated with varying ratios of CFTRF508/∆F508 and CFTR+/+ cells and in CFTR+/∆F508 epithelia. (D) Quantification of Western blots of CFTR. CFTR+/∆F508 is the red square. Data are mean ± SEM normalized to 0% for CFTRF508/∆F508 and to 100% for CFTR+/+ epithelia; n = 5. The line is linear regression, R2 = 0.82, P < 0.0001. The amount of CFTR in CFTR+/∆F508 epithelia and epithelia composed of a 50:50 mix of CFTRF508/∆F508 and CFTR+/+ cells did not differ by unpaired Student's t test.
Fig. 2.
Fig. 2.
HCO3 secretion varies proportionally with the percentage of WT epithelial cells. Epithelia were composed of mixtures of CFTR−/− and CFTR+/+ cells (A and C) or mixtures of CFTRF508/∆F508 and CFTR+/+ cells (B and D) in varying proportions. Red squares indicate epithelia composed entirely of heterozygous epithelia (CFTR+/− or CFTR+/∆F508). (A and B) Solutions contained 130 mM Cl and were HCO3/CO2-free. (C and D) Solutions contained 25 mM HCO3/5% CO2 and were Cl-free. Data are mean ± SEM of changes in short-circuit current (∆Isc) induced by adding 10 μM forskolin and 100 μM IBMX apically to increase intracellular levels of cAMP. To allow comparison between multiple groups of mixed epithelia, data were normalized for each group of epithelia so that ∆Isc for CF (CFTR−/− and CFTRF508/∆F508) epithelia was set at 0% and ∆Isc for epithelia composed entirely of WT cells was set at 100%. For epithelia containing 100% CF cells and 100% WT cells, respectively, the mean ± SEM ∆Isc were as follows: (A) 0.7 ± 0.1 μA⋅cm−2 and 14.2 ± 1.0 μA⋅cm−2; (B) −0.5 ± 0.2 μA⋅cm−2 and 4.0 ± 0.2 μA⋅cm−2; (C) 0.3 ± 0.1 μA⋅cm−2 and 2.3 ± 0.2 μA⋅cm−2; (D) −0.2 ± 0.2 μA⋅cm−2 and 2.0 ± 0.2 μA⋅cm−2. In A and C, n = 13 for CFTR−/−, n = 13 for CFTR+/+, n = 6–9 for mixtures of CFTR−/− and CFTR+/+, and n = 8–9 for CFTR+/−. In B and D, n = 6 for CFTRF508/∆F508, n = 6 for CFTR+/+, n = 6 for mixtures of CFTRF508/∆F508 and CFTR+/+, and n = 1–4 for CFTR+/∆F508. (E and F) The amiloride-induced change in Isc (∆Isc(amiloride)) and Gt (∆Gt(amiloride)) in a Cl (HCO3-free) solution or an HCO3 (Cl-free) solution. Heterozygote epithelia are identified in red. n = 7–19. In Cl containing solution, ∆Isc(amiloride) increased as the percentage of WT epithelia increased (P < 0.02 by linear regression). Other data in E and F showed no relationship to the percentage of WT cells. The * indicates the difference from value for epithelia composed of 100% WT cells; P < 0.05 by ANOVA. The # indicates that the value for ∆Isc(HCO3) differed from the corresponding value for ∆Isc(Cl) by unpaired Student’s t test, P < 0.05.
Fig. 3.
Fig. 3.
Increasing the percentage of non-CF cells in CF epithelia increases ASL pH, enhances antimicrobial activity, and reduces ASL viscosity. Airway epithelia were composed of varying ratios of CFTR−/− and CFTR+/+ cells (AD) or CFTRF508/∆F508 and CFTR+/+ cells (E). Epithelia composed entirely of heterozygous cells (CFTR+/− or CFTR+/∆F508) are indicated by red squares. Measurements were made 2 h after basolateral addition of 10 μM forskolin and 100 μM IBMX. Data are mean ± SEM; in some cases, error bars are hidden by symbols. (A) ASL pH was measured using a ratiometric pH indicator, SNARF-conjugated dextran distributed in the ASL. n = 5–6. (B) ASL antimicrobial activity was assayed by touching bacteria-coated grids to the ASL for 1 min and then determining the percentage of bacteria killed. n = 4–6. (C) ASL viscosity (τASLsaline) was assessed by fluorescence recovery after photobleaching (FRAP). n = 4. (D) ASL depth was measured using confocal microscopy to detect a fluorescent tracer in ASL. n = 4. (E) ASL pH was measured as in A, but with mixtures of CFTRF508/∆F508 and CFTR+/+ cells. n = 7–8. The * indicates the difference from epithelia with 100% WT cells by repeated measures ANOVA, P < 0.05.
Fig. 4.
Fig. 4.
Overexpressing CFTR increases HCO3 secretion, but ASL pH does not exceed WT values. CFTR−/− (red), CFTR+/− (gray), and CFTR+/+ (blue) epithelia were treated with adenovirus encoding CFTR-GFP and studied 3 d later. GFP fluorescence and DAPI fluorescence (nuclear stain) were assayed to determine the percentage of epithelial cells that were transduced (circles). Mean ± SEM of control epithelia not treated with adenovirus are shown as squares. (A) HCO3 secretion induced by adding forskolin (10 μM) and IBMX (100 μM) basolaterally. Data are the change in Isc in Cl-free, HCO3/CO2-containing solutions [∆Isc(HCO3)]. Data are normalized to ∆Isc(HCO3) in nontransduced CFTR+/+ epithelia as 100% (dotted line, from Fig. 2) and in nontransduced CFTR−/− epithelia as 0%. ∆Isc(HCO3) in transduced CFTR−/− epithelia and in transduced CFTR+/+ epithelia was greater than in control, nontransduced CFTR−/− and CFTR+/+ epithelia, respectively, by unpaired Student's t test, P < 0.001. (B) ASL pH was measured 2 h after basolateral addition of 10 μM forskolin and 100 μM IBMX. ASL pH of transduced CFTR−/− epithelia was greater than that of control, nontransduced CFTR−/− epithelia (from Fig. 3) by unpaired Student's t test, P < 0.001. (C) Relationship between cAMP-stimulated HCO3 secretion and ASL pH. Data are from A and B.
Fig. S1.
Fig. S1.
The relationship between CFTR mRNA expression and the percentage of GFP-positive cells. CFTR−/−, CFTR+/−, and CFTR+/+ epithelia were treated with adenovirus encoding CFTR-GFP and studied 3 d later. CFTR mRNA was measured by qPCR and normalized to WT epithelia as 100%. GFP fluorescence and DAPI fluorescence (nuclear stain) were assayed to determine the percentage of GFP-positive epithelial cells. The line is linear regression, R2 = 0.75, and P < 0.0001.

Similar articles

Cited by

References

    1. Quinton PM. Physiological basis of cystic fibrosis: A historical perspective. Physiol Rev. 1999;79(1) Suppl:S3–S22. - PubMed
    1. Stoltz DA, Meyerholz DK, Welsh MJ. Origins of cystic fibrosis lung disease. N Engl J Med. 2015;372(4):351–362. - PMC - PubMed
    1. Cutting GR. Cystic fibrosis genetics: From molecular understanding to clinical application. Nat Rev Genet. 2015;16(1):45–56. - PMC - PubMed
    1. Yan Z, et al. Ferret and pig models of cystic fibrosis: Prospects and promise for gene therapy. Hum Gene Ther Clin Dev. 2015;26(1):38–49. - PMC - PubMed
    1. Griesenbach U, Alton EW. Moving forward: Cystic fibrosis gene therapy. Hum Mol Genet. 2013;22(R1):R52–R58. - PubMed

Publication types

Substances