. 2016 May 10;113(19):5370-5.
doi: 10.1073/pnas.1521491113. Epub 2016 Apr 25.

Transcription factor KLF2 regulates homeostatic NK cell proliferation and survival

Affiliations

Transcription factor KLF2 regulates homeostatic NK cell proliferation and survival

Whitney Rabacal et al. Proc Natl Acad Sci U S A. .

Abstract

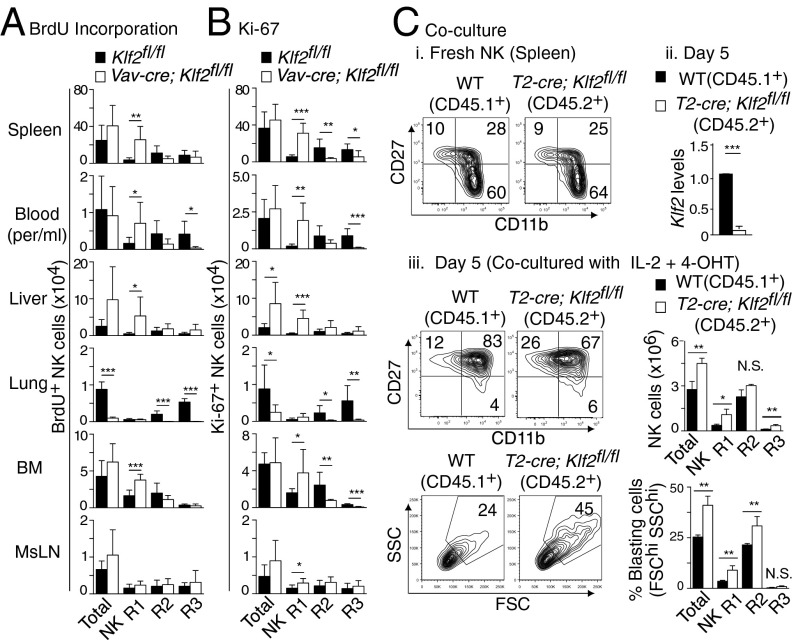
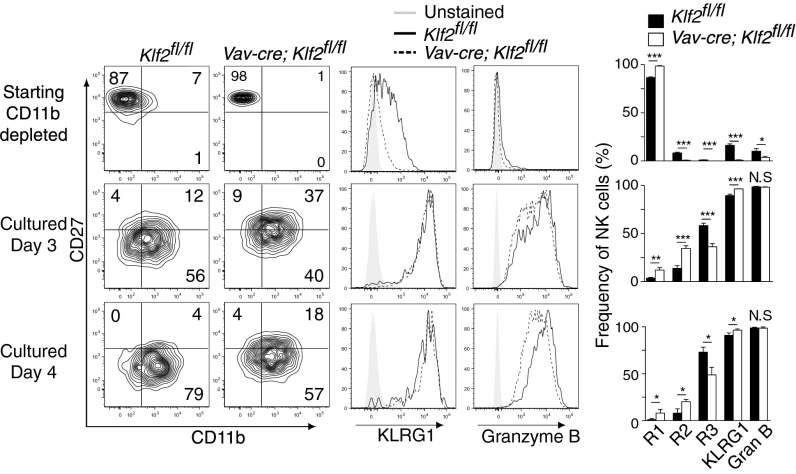
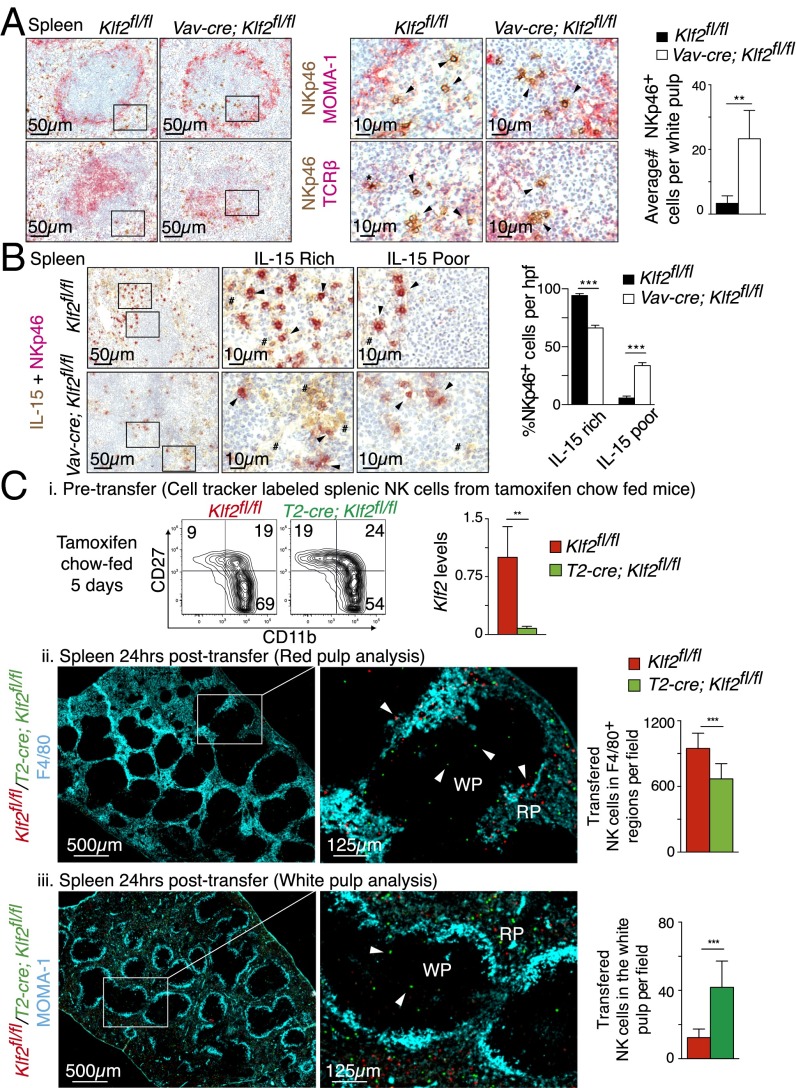
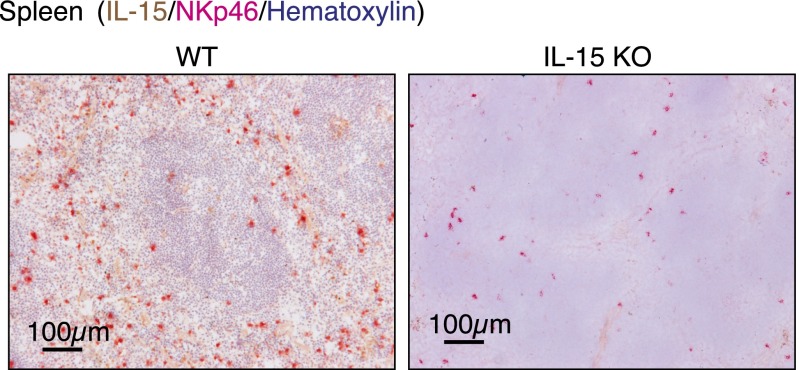
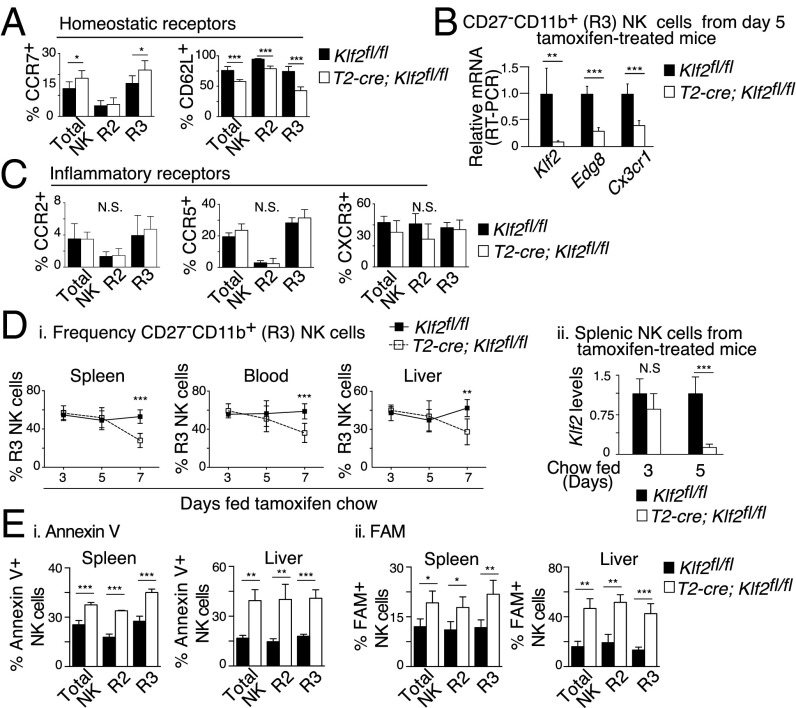
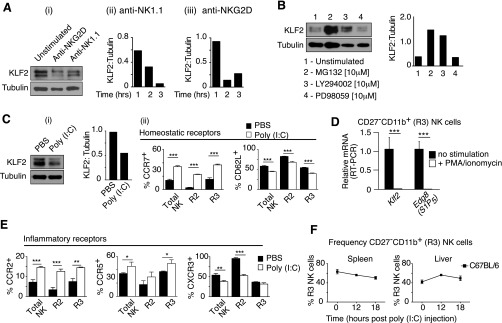
Natural killer (NK) cells are innate lymphocytes that recognize and lyse virally infected or transformed cells. This latter property is being pursued in clinics to treat leukemia with the hope that further breakthroughs in NK cell biology can extend treatments to other cancers. At issue is the ability to expand transferred NK cells and prolong their functionality within the context of a tumor. In terms of NK cell expansion and survival, we now report that Kruppel-like factor 2 (KLF2) is a key transcription factor that underpins both of these events. Excision of Klf2 using gene-targeted mouse models promotes spontaneous proliferation of immature NK cells in peripheral tissues, a phenotype that is replicated under ex vivo conditions. Moreover, KLF2 imprints a homeostatic migration pattern on mature NK cells that allows these cells to access IL-15-rich microenvironments. KLF2 accomplishes this feat within the mature NK cell lineage via regulation of a subset of homing receptors that respond to homeostatic ligands while leaving constitutively expressed receptors that recognize inflammatory cytokines unperturbed. Under steady-state conditions, KLF2-deficient NK cells alter their expression of homeostatic homing receptors and subsequently undergo apoptosis due to IL-15 starvation. This novel mechanism has implications regarding NK cell contraction following the termination of immune responses including the possibility that retention of an IL-15 transpresenting support system is key to extending NK cell activity in a tumor environment.

Keywords: IL-15; KLF2; NK cell; NK cell homeostasis; NK cell proliferation.


Conflict of interest statement

The authors declare no conflict of interest.

Figures

Fig. 1.
Fig. 1.
KLF2 is necessary for NK cell homeostasis. (A) Klf2 mRNA and KLF2 protein levels in NK cell subsets. Splenic CD122+Lin (CD3, CD8, CD19, Gr-1, TCRβ) NK cells were FACS sorted into maturing NK cell subsets (R1, CD27+CD11b; R2, CD27+CD11b+; R3, CD27CD11b+) from C57BL/6 mice. Klf2 mRNA and KLF2 protein levels were normalized to gapdh and tubulin, respectively. This experiment was repeated twice. (B) Klf2 mRNA levels expressed in MACS-sorted NK cells harvested from Klf2fl/fl versus Vav-cre; Klf2fl/fl mice (normalized to gapdh). (C) Contour plots of CD122+Lin NK cell populations harvested from Klf2fl/fl (black) versus Vav-cre; Klf2fl/fl (white) littermates. Frequencies and absolute cell numbers are graphed. BM, bone marrow; MsLN, mesenteric lymph nodes. Data are pooled from three independent experiments (n = 10 mice per group). (D) Alternate analysis of CD122+Lin NK cell populations, using CD43 and CD11b as maturity markers. n = 10 mice per cohort. (E) IL-15R surface expression on splenic NK cells harvested from Klf2fl/fl versus Vav-cre; Klf2fl/fl mice. n = 3 experiments. (F) IL-15R signaling capacity of control (Top) versus KLF2-deficient NK cell populations (Lower). NK cells were cultured ± IL-15 (1 h) before intracellular staining for phosphorylated S6, a downstream target of mTOR activity. This experiment was repeated three times. *P < 0.05; **P < 0.01; ***P < 0.001.
Fig. S1.
Fig. S1.
NK cell MHC licensing, ILC1 homeostasis, and liver-resident NK cell homeostasis is intact in Vav-cre; Klf2fl/fl mice. (A) Histogram overlays of activating and inhibitory receptors expressed on the surface of NK cells (CD122+ Lin NK1.1+) isolated from the bone marrow of Klf2fl/fl versus Vav-cre; Klf2fl/fl animals. This experiment was repeated twice. (B) Conventional lineage markers were used to identify ILC1 cells in the spleen (CD27+ CD127+) and liver (CD49b TRAIL+) of Klf2fl/fl and Vav-cre; Klf2fl/fl mice after gating on CD122+ Lin NK1.1+ cells. Consistent with the literature (24), EOMES+ ILC1 cells are confined to the spleen. (C) Liver-resident NK cells, which are distinct from conventional NK cells (25) were found at normal numbers in Vav-cre; Klf2fl/fl mice. CD49a+ CD49b NK cells (gated on CD122+ Lin NK1.1+ cells) were primarily confined to the liver in both sets of animals. Increased CD49a CD49b+ NK cells found in the liver of Vav-cre; Klf2fl/fl mice were CD27+CD11b (R1). This experiment was repeated twice by using three mice per cohort. *P < 0.05; **P < 0.01; ***P < 0.001.
Fig. 2.
Fig. 2.
Mature cytolytic NK cells are absent in Vav-cre; Klf2fl/fl mice. (A) Histogram overlays (Left) and quantification (Right) of granzyme B expression following (PMA + ionomycin)-simulation of splenic NK cells harvested from Klf2fl/fl versus Vav-cre; Klf2fl/fl mice. Histograms display individual subsets, whereas columns are total NK cells. n = 9–11 mice per cohort, pooled from three independent experiments. (B) Ex vivo cytolytic activity of IL-2–primed splenocytes cultured with Yac-1 target cells for 4 h in an LDH release assay. This experiment was performed once in quadruplicate. (C) CD107a surface expression on NK cells cultured for 6 h ± plate-bound NK1.1 antibody. n = 6 mice per cohort, pooled from two independent experiments. (D) RMA control and RMA-S target cells were coinjected at a 1:1.5 ratio into Klf2fl/fl versus Vav-cre; Klf2fl/fl mice and RMA/RMA-S survival was assessed 48 h later. This experiment was repeated twice by using three mice per group. *P < 0.05; **P < 0.01; ***P < 0.001.
Fig. 3.
Fig. 3.
KLF2-mediated NK cell homeostasis is cell intrinsic. Analysis of mixed bone marrow chimeras that were generated by reconstituting lethally irradiated Klf2fl/fl (CD45.2+) mice with wild-type (CD45.1+) and Vav-cre; Klf2fl/fl (CD45.2+) bone marrow. Flow cytometric analysis was performed 8 wk after transfer. Representative contour plots, frequencies, and cell numbers of gated (CD122+Lin) KLF2-sufficient (black) and KLF2-deficient (white) populations are shown. This experiment was performed once by using five recipient animals. *P < 0.05; **P < 0.01; ***P < 0.001.
Fig. S2.
Fig. S2.
Defective NK cell homeostasis is consistent with a cell-intrinsic mechanism. (A) Flow cytometric analysis of CD122+ Lin NK cells harvested from the spleens of 8-wk-old Klf2fl/fl versus LysM-cre; Klf2fl/fl littermates. n = 7 mice per cohort. (B) CFSE-labeled CD19-depleted Vav-cre; Klf2fl/fl splenocytes (2.5 × 10⁷) were adoptively transferred into Klf2fl/fl or Vav-cre; Klf2fl/fl recipients. CFSE+ CD122+ Lin NK cells were analyzed 48 h after transfer to determine whether neighboring cells could rescue KLF2-deficient NK cell differentiation. This experiment was repeated twice. *P < 0.05; **P < 0.01.
Fig. 4.
Fig. 4.
KLF2 suppresses proliferation in immature NK cells. (A) BrdU incorporation over 5 d was used to assess NK cell (CD122+Lin) proliferation in various tissues harvested from Klf2fl/fl versus Vav-cre; Klf2fl/fl littermates. n = 6 mice per cohort, pooled from two independent experiments. (B) The percentage of CD122+Lin NK cells actively proliferating was quantified by Ki-67 expression. n = 7 mice per group (two pooled experiments). (C) Equal numbers of MACS-sorted NK cells from wild type (CD45.1+) versus T2-cre; Klf2fl/fl (CD45.2+) mice were cocultured in 4-OHT and IL-2 to induce Klf2 excision and support proliferation, respectively. NK cells were analyzed by flow cytometry before (i) and after (iii) excision and Klf2 expression was assessed by RT-PCR at day 5 (ii). This experiment was repeated twice by using three biological replicates per group. *P < 0.05; **P < 0.01; ***P < 0.001; N.S., not significant.
Fig. 5.
Fig. 5.
KLF2-deficient NK cell differentiation is reestablished in culture. CD11b-depleted bone marrow from Klf2fl/fl and Vav-cre; Klf2fl/fl mice was plated on wild-type bone marrow (CD45.1+) supplemented with IL-15, IL-12, and IL-18. Starting material and cells cultured for 3–4 d were initially gated (CD45.2+CD122+Lin) then analyzed for NK cell differentiation (CD27, CD11b contour plots) and maturity markers (KLRG1, granzyme B) by flow cytometry. Differentiation experiments were performed twice in triplicate, generating similar results. *P < 0.05; **P < 0.01; ***P < 0.001; N.S., not significant.
Fig. 6.
Fig. 6.
KLF2 promotes NK cell migration toward IL-15–rich niches. (A) Immunohistochemistry of Klf2fl/fl and Vav-cre; Klf2fl/fl splenic serial sections costained for NKp46/MOMA-1 (Top) and NKp46/TCRβ (Bottom). Enlarged images that identify NK cells (arrows) and NKT cells (*) are shown at Right. Associated bar graph shows the average number of NKp46+ NK cells within 10 similarly sized MOMA-1–encased sections per mouse. n = 4 mice per cohort. (B) Klf2fl/fl (Top) and Vav-Cre; Klf2fl/fl (Bottom) splenic sections costained for NKp46 and IL-15. Middle and Right show enlarged areas of IL-15–rich and IL-15–poor splenic sections, respectively. NKp46+ cells (arrow) and IL-15+ tissue (#) are identified. Associated bar graph shows the average frequency of NK cells (five high-powered fields per mouse) identified in IL-15–rich and –poor niches. n = 3–4 mice per cohort. (C) Dynamic migration of mature NK cell populations within the spleen. Splenic NK cells were isolated (MACS-sorted) from tamoxifen-treated (5 d) Klf2fl/fl versus T2-cre; Klf2fl/fl mice then labeled with red or green cell tracker dyes, respectively. These cells were subsequently cotransferred into a wild-type recipient and splenic localization was assessed 24 h later. This experiment was repeated three times. (i) NK cell subset frequencies (contour plots) and degree of Klf2 excision (RT-PCR) within isolated NK cell populations before transfer. (ii) Immunohistochemistry of KLF2-sufficient (red) versus KLF2-deficient (green) NK cells in relation to F4/80+ myeloid cells. Transferred NK cell numbers were quantified from 10 individual low-power field images. (iii) Immunohistochemistry of cotransferred NK cell populations in relation to the white pulp, as outlined with MOMA-1 antibody. Average number of transferred cells per field was calculated from 25 individual images. **P < 0.01; ***P < 0.001.
Fig. S3.
Fig. S3.
Spleens harvested from wild-type (WT) and IL-15–deficient (IL-15 KO) mice were costained for NKp46 (pink), hematoxylin (purple), and IL-15 (brown) to verify IL-15 antibody specificity.
Fig. 7.
Fig. 7.
KLF2 supports mature NK cell survival by regulating expression of homeostatic homing receptors. (AC) Klf2fl/fl and T2-cre; Klf2fl/fl mice were placed on tamoxifen-infused chow for 5 d, then analyzed for expression of homing receptors that respond to constitutively expressed ligands (A and B) or inflammatory chemokines (C). (A) Surface expression of CCR7 and CD62L on CD122+Lin NK cells (R2 = CD27+CD11b+, R3 = CD27CD11b+), as determined by flow cytometry. This experiment was repeated three times with three mice per cohort. (B) Relative mRNA expression of Klf2, Edg8 (S1P5), and Cx3cr1 in FACS-sorted CD27CD11b+ NK cells. This experiment was repeated twice. (C) Surface expression of CCR2, CCR5, and CXCR3 on CD122+Lin NK cells. This experiment was repeated two to three times by using a minimum of three mice per group. (D, i) Frequency of mature (CD122+LinCD27CD11b+) NK cells in the spleen, blood, and liver of Klf2fl/fl versus T2-cre; Klf2fl/fl mice placed on tamoxifen-infused chow for the indicated time points, as determined by flow cytometry. n = 3–11 mice per time point. (ii) Klf2 excision within MACS-sorted splenic NK cells was assessed at days 3 and 5 by RT-PCR. (E) KLF2 is necessary for mature NK cell survival under noninflammatory conditions. Frequency of Annexin V+ (i) and FAM+ (caspase active) (ii) NK cells isolated from Klf2fl/fl versus T2-cre; Klf2fl/fl mice placed on tamoxifen chow (d9). Mature NK cells (CD49b+Lin) were defined as CD27+CD11b+ (R2) or CD27CD11b+ (R3). This experiment was repeated three times by using three mice per cohort. *P < 0.05; **P < 0.01; ***P < 0.001; N.S., not significant.
Fig. S4.
Fig. S4.
Activated NK cells degrade KLF2 and alter homeostatic and inflammatory homing receptors. (A) Engagement of activation receptors promotes KLF2 degradation. Representative KLF2 immunoblot at 3 h (i) and densitometry plots of KLF2 relative to tubulin following stimulation of MACS-sorted NK cells with NK1.1 (i) or NKG2D (iii) antibody. This experiment was repeated twice. (B) KLF2 immunoblot of MACS-sorted NK cells cultured for 4 h ± MG132 (proteasome inhibitor), LY294002 (PI3K inhibitor), or PD98059 (MEK1 inhibitor). This experiment was repeated twice. (C) In vivo activation of NK cells promotes KLF2 degradation and altered expression of homeostatic homing receptors. (i) KLF2 immunoblot and densitometry of splenic NK cells harvested from control (PBS) versus poly(I:C)-treated mice 16 h after injection. This experiment was repeated twice. (ii) Flow cytometric analysis of splenocytes harvested from wild-type mice treated with PBS (black) versus poly(I:C) (white). Sixteen hours after injection, CD49b+Lin NK cell subsets (R2, CD27+CD11b+; R3, CD27CD11b+) were examined for surface expression of homing receptors that recognize constitutively expressed ligands. n = 3 mice per group, repeated twice. (D) Relative mRNA expression of Klf2 and Edg8 (S1P5) following (PMA + ionomycin) stimulation of FACS-sorted CD27CD11b+ NK cells (4 h) harvested from wild-type mice. This experiment was performed once in triplicate. (E) Same as C(ii), except cytometric analysis focused on homing receptors that recognize chemokines associated with inflammation. (F) Frequency of mature (CD27CD11b+) NK cells in the spleen and liver of wild-type mice over time following poly(I:C)-treatment. n = 3 mice per time point. *P < 0.05; **P < 0.01; ***P < 0.001.

Similar articles

Cited by

References

    1. Bachanova V, Miller JS. NK cells in therapy of cancer. Crit Rev Oncog. 2014;19(1-2):133–141. - PMC - PubMed
    1. Orange JS. Natural killer cell deficiency. J Allergy Clin Immunol. 2013;132(3):515–525, quiz 526. - PMC - PubMed
    1. Knorr DA, Bachanova V, Verneris MR, Miller JS. Clinical utility of natural killer cells in cancer therapy and transplantation. Semin Immunol. 2014;26(2):161–172. - PMC - PubMed
    1. Miller JS, et al. Successful adoptive transfer and in vivo expansion of human haploidentical NK cells in patients with cancer. Blood. 2005;105(8):3051–3057. - PubMed
    1. Walzer T, Vivier E. G-protein-coupled receptors in control of natural killer cell migration. Trends Immunol. 2011;32(10):486–492. - PubMed

Publication types

MeSH terms