. 2016 May 10;113(19):E2655-64.
doi: 10.1073/pnas.1522014113. Epub 2016 Apr 25.

Retinal neurodegeneration may precede microvascular changes characteristic of diabetic retinopathy in diabetes mellitus

Affiliations

Retinal neurodegeneration may precede microvascular changes characteristic of diabetic retinopathy in diabetes mellitus

Elliott H Sohn et al. Proc Natl Acad Sci U S A. .

Abstract

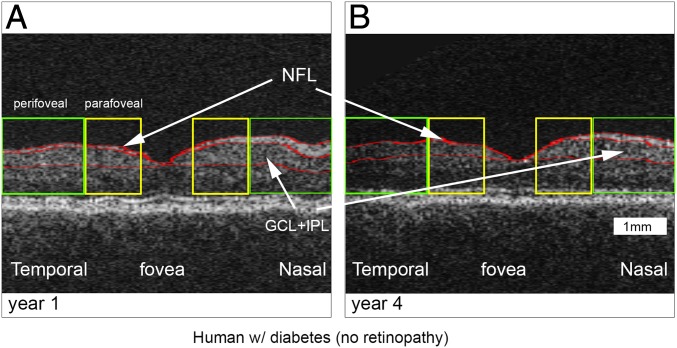
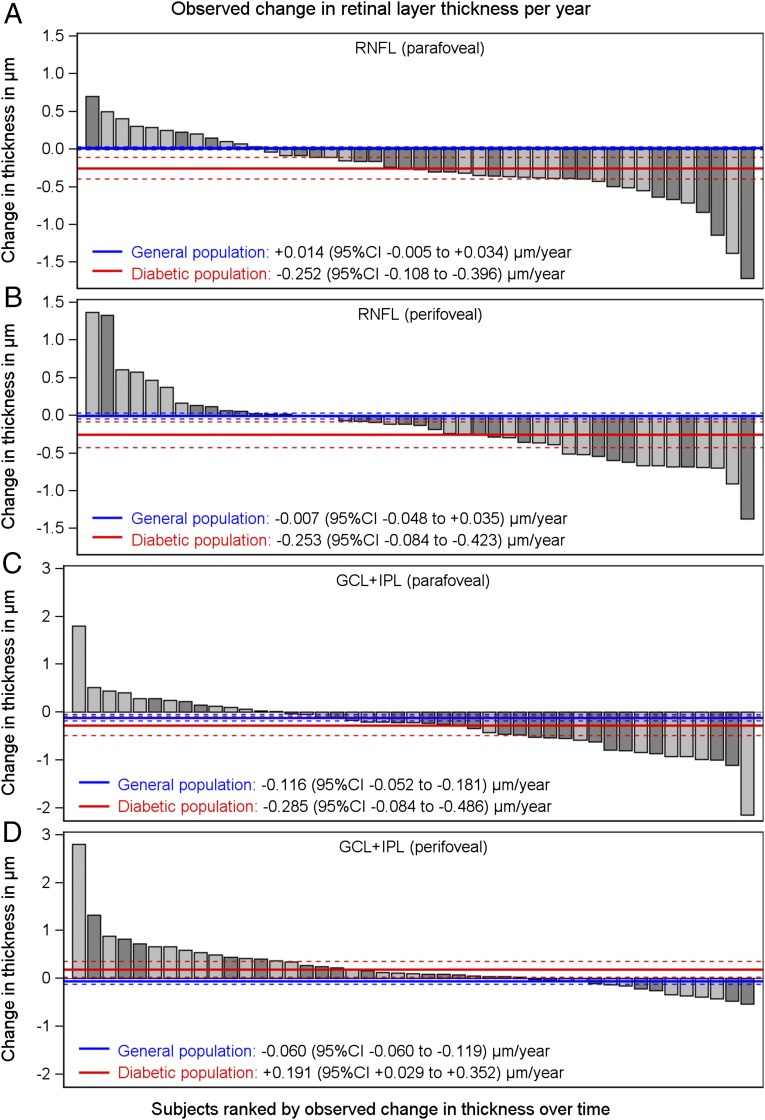
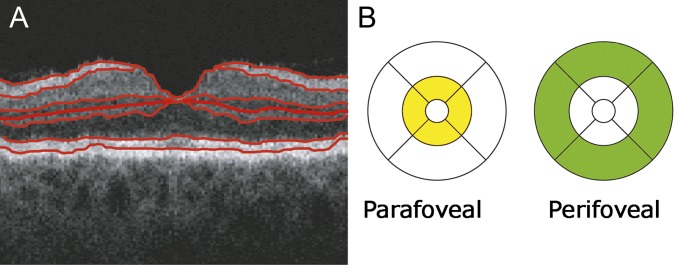
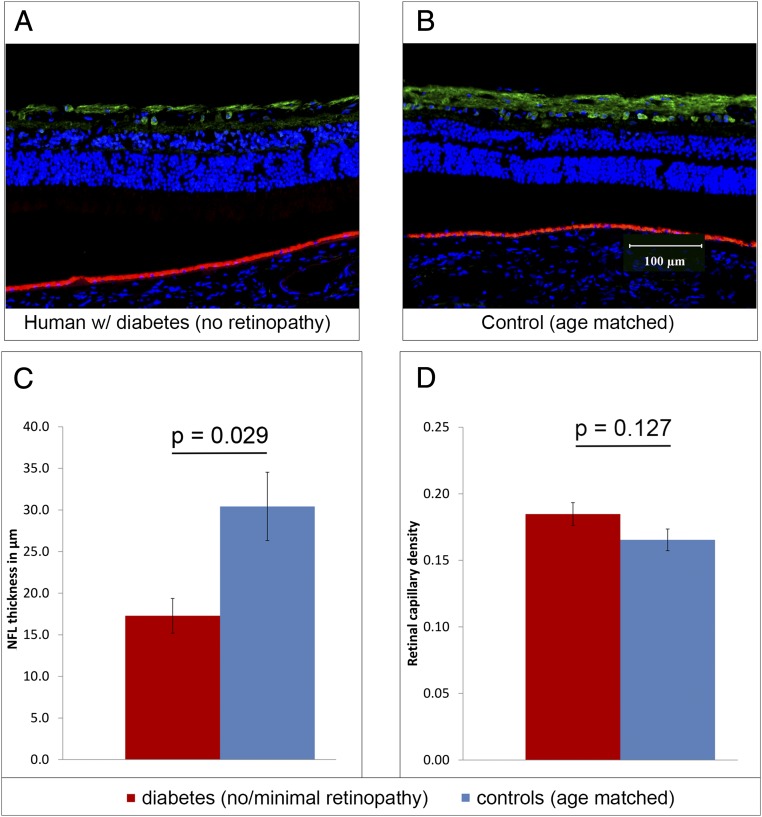
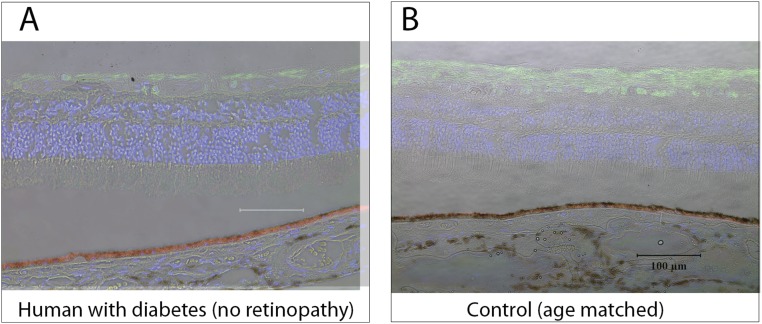
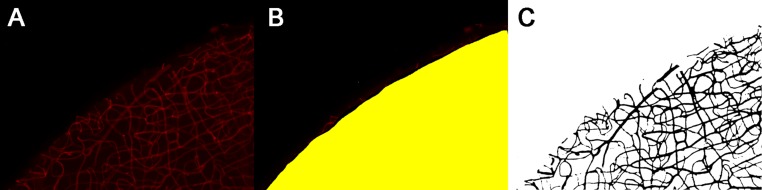
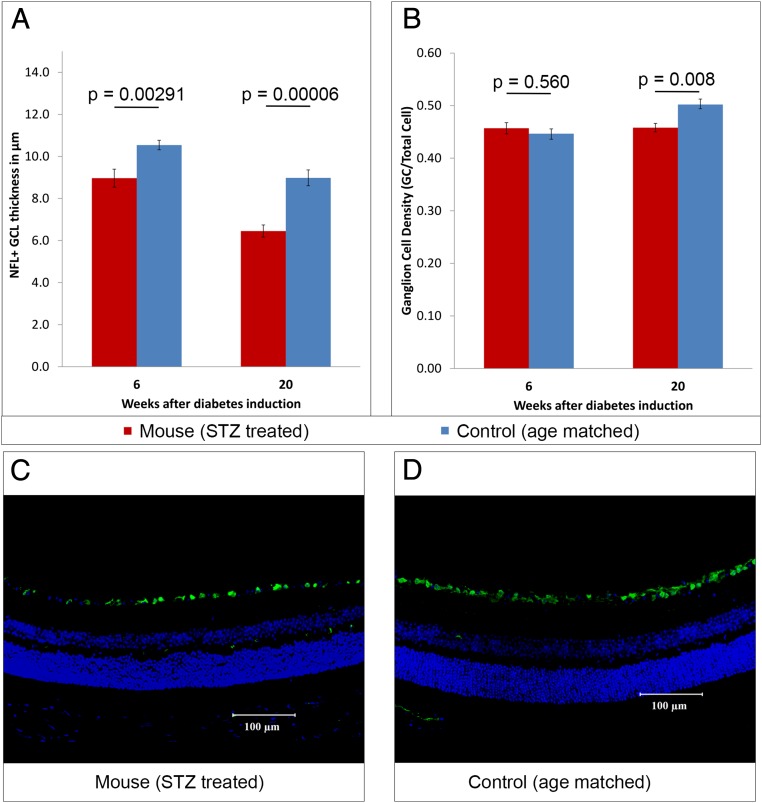
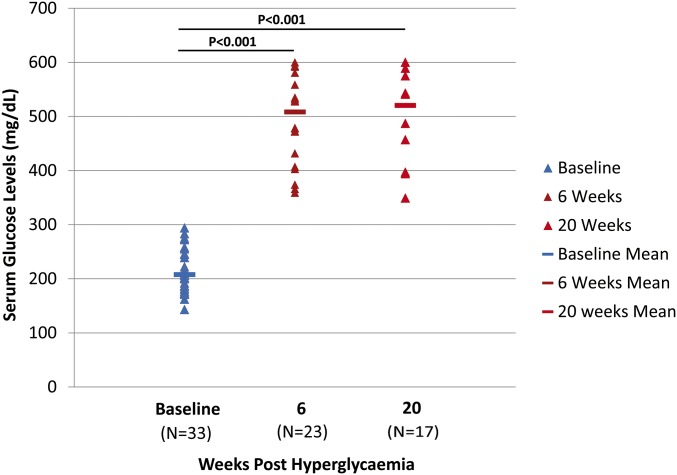
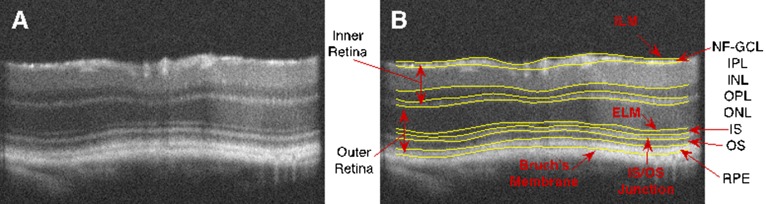
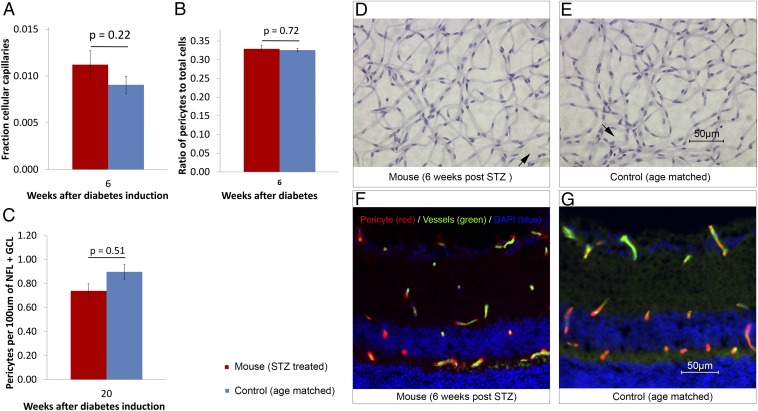
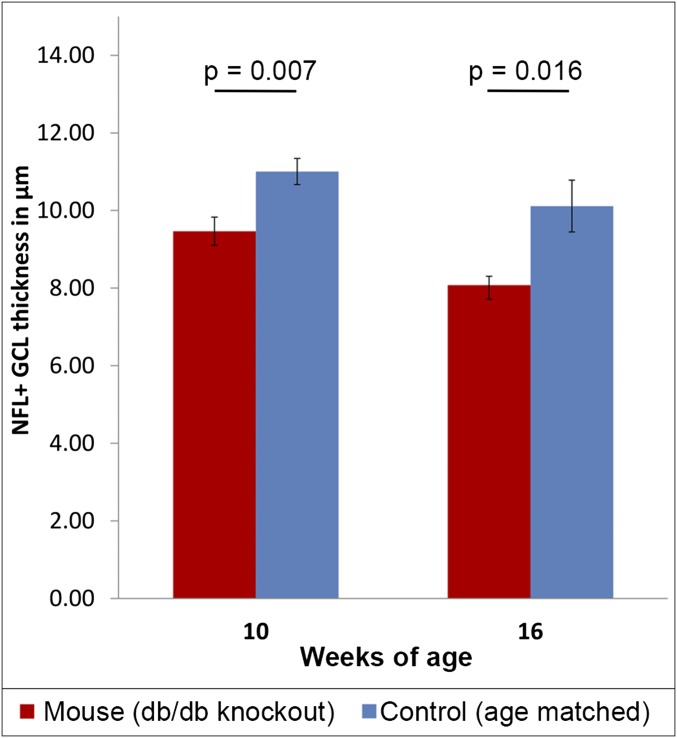
Diabetic retinopathy (DR) has long been recognized as a microvasculopathy, but retinal diabetic neuropathy (RDN), characterized by inner retinal neurodegeneration, also occurs in people with diabetes mellitus (DM). We report that in 45 people with DM and no to minimal DR there was significant, progressive loss of the nerve fiber layer (NFL) (0.25 μm/y) and the ganglion cell (GC)/inner plexiform layer (0.29 μm/y) on optical coherence tomography analysis (OCT) over a 4-y period, independent of glycated hemoglobin, age, and sex. The NFL was significantly thinner (17.3 μm) in the eyes of six donors with DM than in the eyes of six similarly aged control donors (30.4 μm), although retinal capillary density did not differ in the two groups. We confirmed significant, progressive inner retinal thinning in streptozotocin-induced "type 1" and B6.BKS(D)-Lepr(db)/J "type 2" diabetic mouse models on OCT; immunohistochemistry in type 1 mice showed GC loss but no difference in pericyte density or acellular capillaries. The results suggest that RDN may precede the established clinical and morphometric vascular changes caused by DM and represent a paradigm shift in our understanding of ocular diabetic complications.

Keywords: diabetes; diabetic retinopathy; neurodegeneration; optical coherence tomography; retina.


Conflict of interest statement

Conflict of interest statement: M.D.A. has direct equity ownership of and receives income from IDx LLC, a company that has licensed inventions from the University of Iowa, on which the Iowa Reference Algorithms used in this study are based. M.D.A. and M.S. are inventors on patents assigned to the University of Iowa and licensed by IDx LLC.

Figures

Fig. 1.
Fig. 1.
Stratus OCT (horizontal B-scans through the fovea) automated analysis of the right eye of one of the subjects, a 42-y-old female without DR, at the baseline visit (A) and at the fourth-year visit (B) showing generalized loss of the NFL and GCL+IPL over this time period in the parafoveal (yellow outline) and perifoveal (green outline) regions (see Fig. S1B). The top red line is the ILM that represents the inner boundary of the retina separating the vitreous cavity and the NFL. The middle red line is the boundary between the NFL and the GCL. The bottom red line is the boundary between the IPL and INL. At year 4 (B), the loss of the NFL is so profound in this subject that it is hard to differentiate the top and middle red lines on the temporal (left) side of the fovea. (Scale bar, 1 mm; the width of the scan is 6 mm.)
Fig. 2.
Fig. 2.
Subjects with DM and no or minimal DR (n = 45) show significant neuroretinal thinning over time. (AC) Observed changes in retinal layer thickness per year, with subjects ranked (from left to right) by observed change in layer thickness over time, showing significant thinning of the parafoveal NFL (A), perifoveal NFL (B), and perifoveal GCL+IPL (C). (D) Nonsignificant changes in parafoveal GCL+IPL. All layer thicknesses were measured by Stratus OCT imaging analysis over a 4-y study period and are demonstrated by the linear mixed regression models shown in Table 1. Each vertical bar represents the change in thickness per year in the parafoveal and perifoveal NFL and GCL+IPL regions for each subject. Dark-gray bars represent subjects without DR progression; light-gray bars represent subjects with DR progression. The solid and dotted red lines show the mean and 95% CI change in subjects in this study, respectively (model derived as in Table 1). Solid and dotted blue lines show the previously published mean and 95% CI loss, respectively, in normal control subjects (14).
Fig. S1.
Fig. S1.
(A) An example of seven-surface, six-layer segmentation. (B) Diagrams showing the parafoveal (yellow) and perifoveal (green) regions.
Fig. 3.
Fig. 3.
(A and B) Sections of eyes from human donors with DM and no retinopathy (A) and from age-matched controls (B) stained with γ-synuclein antibody to immunolabel GCs and the NFL (green); DAPI nuclear counterstaining is blue; the red-orange signal at the level of the RPE is caused by autofluorescence. (C) The NFL was significantly thinner in the diabetic eyes (n = 6) than in controls (n = 5). (D) Retinal capillary density was measured from whole-mount sections; vessels were immunolabeled with biotinylated UEA-I followed by avidin conjugated to Texas Red (Fig. S4). No significant difference in retinal capillary density was found in eyes from diabetic donors (n = 6) and from controls (n = 5).
Fig. S2.
Fig. S2.
The tissue sections shown in Fig. 3 with a coregistered overlay of the corresponding brightfield image indicating how nonstained tissue relates to the immunolabeling image. Because coregistration is not perfect, some partial overlap is visible. (A) Tissue from a diabetic human donor. (B) Tissue from an age-matched control donor.
Fig. S3.
Fig. S3.
Semiautomated quantification of capillary density in a flat-mount retina from a human donor using ImageJ. (A) A biotinylated UEA-1–stained image of retinal capillaries. (B) An automatically thresholded region of interest in which capillary density is quantified (yellow). (C) The intensity of each pixel within the region in B represents the likelihood of its being part of a capillary after local threshold optimization and morphology operation.
Fig. 4.
Fig. 4.
(A) SD-OCT analysis (Fig. S5) showed significant NFL+GCL thinning in the mice with STZ-induced DM as compared with age-matched controls at both 6 wk (n = 21 diabetic mice, 15 controls) and 20 wk (n = 11 diabetic mice, 10 controls) of DM duration. (B) GC density is not significantly different in DM and control mice at 6 wk but is significantly lower in diabetic mice than in controls at 20 wk (n = 10 diabetic mice, 10 controls). (C and D) Representative sections of the inner retina of mice with STZ-induced DM at 20 wk (C) and age-matched controls (D). Anti–γ-synuclein antibody was used to immunolabel GCs (green); DAPI nuclear counterstaining is shown in blue.
Fig. S4.
Fig. S4.
Serum glucose levels of C57BL/6J mice used in this study. Hyperglycemia was induced by i.p. administration of STZ, and only mice with serum glucose >350 mg/dL were considered diabetic. The results were evaluated using one-way ANOVA followed by Bonferroni post hoc analysis. P < 0.001 denotes statistical differences between the STZ-treated and wild-type control groups. Studies were performed on mice at 6 wk and 20 wk of sustained hyperglycemia and were compared with results in age-matched control mice.
Fig. S5.
Fig. S5.
Mouse SD-OCT imaging and analysis. (A) A raw central slice, one of 400 slices acquired with the Bioptigen SD-OCT. (B) The same slice showing 10 intraretinal surfaces segmented with the Iowa Reference Algorithms. Although only a single slice is shown, the analysis is performed completely in 3D. Because of the axial resolution of these scans (1.53 μm), the junction between the inner and outer segments appears as a layer in these images.
Fig. 5.
Fig. 5.
(A and B) STZ-induced DM in a mouse model does not significantly affect acellular capillaries (n = 6 diabetic mice, 6 controls) (A) or pericyte density (n = 6 diabetic mice, 6 controls) (B) at 6-wk DM duration. (C) There was a trend favoring pericyte dropout in mice at 20 wk of DM duration, but this trend was not significant (n = 8 diabetic mice, 8 controls). (D and E) Images of trypsin-digested whole-mount retina show similar numbers of acellular capillaries (black arrows) in diabetic (D) and control (E) mice. (F and G) Histologic sections of retinas from diabetic (F) and control (G) mice dual-immunolabeled with NG-2 (red) and IB4 (green) show similar numbers of pericytes and vessels. DAPI nuclear counterstaining is shown in blue.
Fig. 6.
Fig. 6.
Progressive thinning of the NFL/GCL layer also is seen on OCT imaging analysis in 10-wk-old (n = 18 diabetic mice, 14 controls) and 16-wk-old (n = 18 diabetic mice, 9 controls) db/db mice, which have a spontaneous young-onset form of DM.

Similar articles

Cited by

References

    1. Antonetti DA, Klein R, Gardner TW. Diabetic retinopathy. N Engl J Med. 2012;366(13):1227–1239. - PubMed
    1. Antonetti DA, et al. JDRF Diabetic Retinopathy Center Group Diabetic retinopathy: Seeing beyond glucose-induced microvascular disease. Diabetes. 2006;55(9):2401–2411. - PubMed
    1. Stem MS, Gardner TW. Neurodegeneration in the pathogenesis of diabetic retinopathy: Molecular mechanisms and therapeutic implications. Curr Med Chem. 2013;20(26):3241–3250. - PMC - PubMed
    1. van Dijk HW, et al. Association of visual function and ganglion cell layer thickness in patients with diabetes mellitus type 1 and no or minimal diabetic retinopathy. Vision Res. 2011;51(2):224–228. - PMC - PubMed
    1. Realini T, Lai MQ, Barber L. Impact of diabetes on glaucoma screening using frequency-doubling perimetry. Ophthalmology. 2004;111(11):2133–2136. - PubMed

Publication types

MeSH terms