

GDF-15 enhances intracellular Ca2+ by increasing Cav1.3 expression in rat cerebellar granule neurons
- PMID: 27114559
- PMCID: PMC4925162
- DOI: 10.1042/BCJ20160362
GDF-15 enhances intracellular Ca2+ by increasing Cav1.3 expression in rat cerebellar granule neurons
Abstract
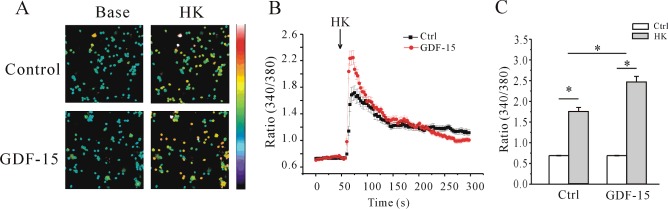
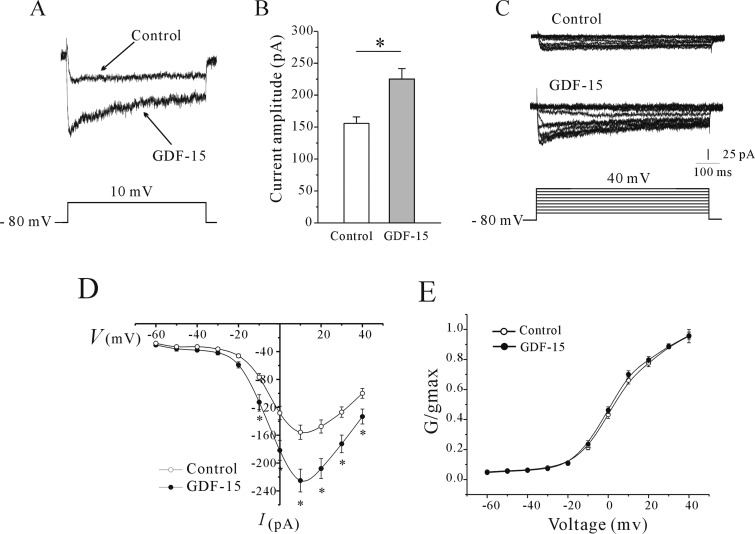
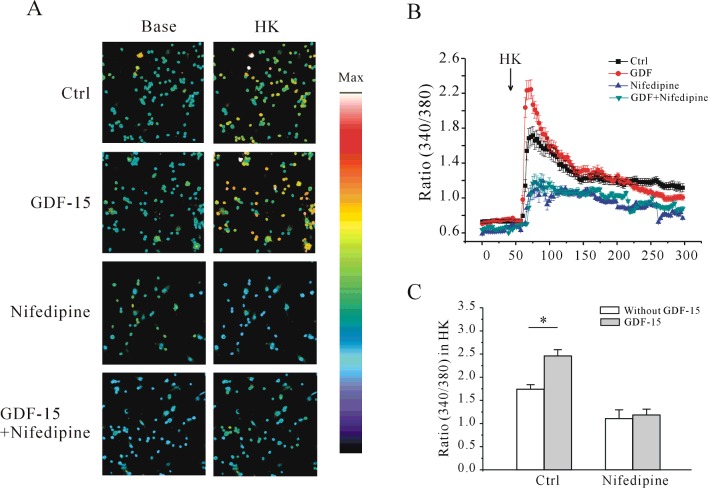
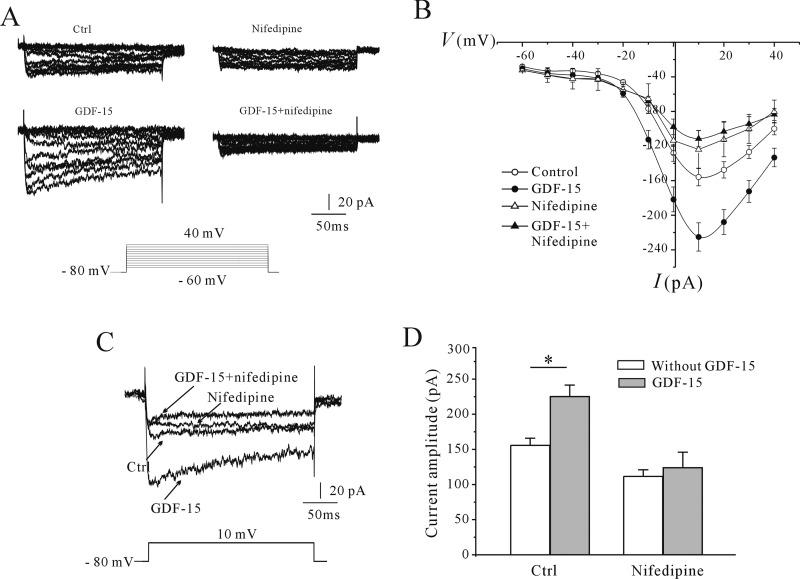
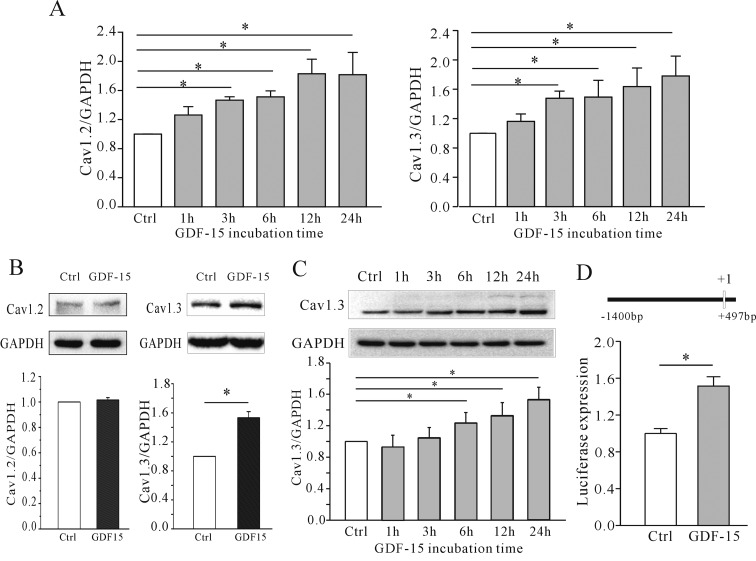
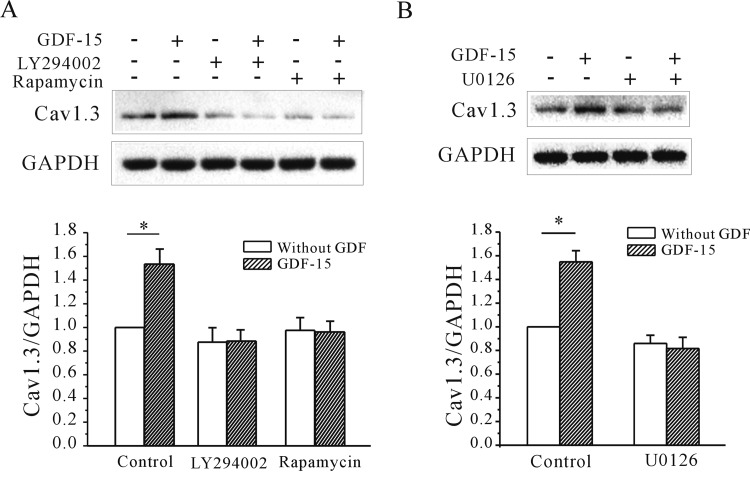
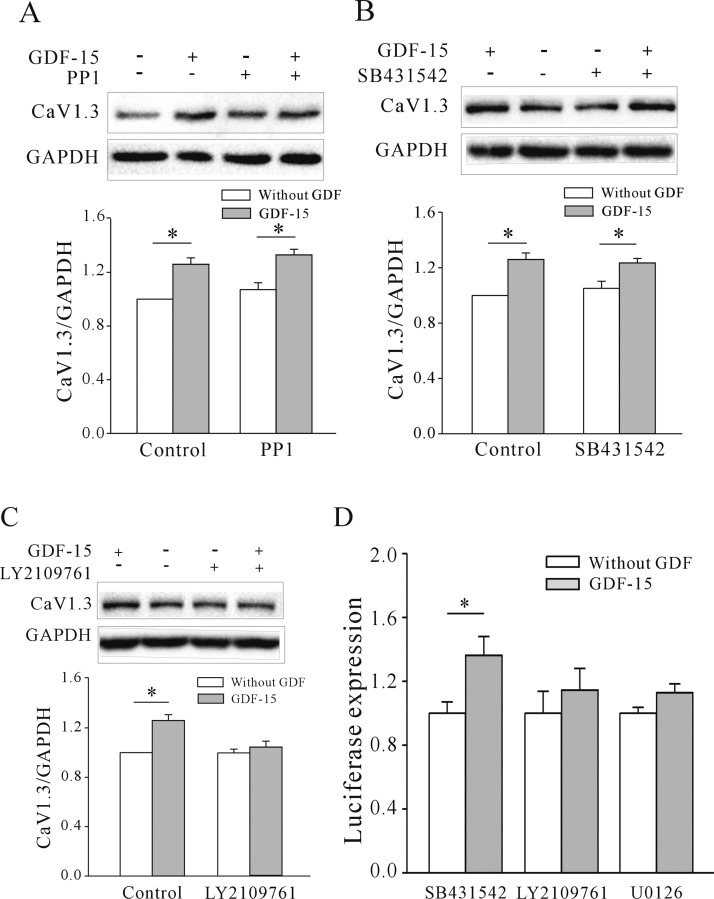
GDF-15 (growth/differentiation factor 15) is a novel member of the TGF (transforming growth factor)-β superfamily that has critical roles in the central and peripheral nervous systems. We reported previously that GDF-15 increased delayed rectifier outward K(+) currents and Kv2.1 α subunit expression through TβRII (TGF-β receptor II) to activate Src kinase and Akt/mTOR (mammalian target of rapamycin) signalling in rat CGNs (cerebellar granule neurons). In the present study, we found that treatment of CGNs with GDF-15 for 24 h increased the intracellular Ca(2+) concentration ([Ca(2+)]i) in response to membrane depolarization, as determined by Ca(2+) imaging. Whole-cell current recordings indicated that GDF-15 increased the inward Ca(2+) current (ICa) without altering steady-state activation of Ca(2+) channels. Treatment with nifedipine, an inhibitor of L-type Ca(2+) channels, abrogated GDF-15-induced increases in [Ca(2+)]i and ICa The GDF-15-induced increase in ICa was mediated via up-regulation of the Cav1.3 α subunit, which was attenuated by inhibiting Akt/mTOR and ERK (extracellular-signal-regulated kinase) pathways and by pharmacological inhibition of Src-mediated TβRII phosphorylation. Given that Cav1.3 is not only a channel for Ca(2+) influx, but also a transcriptional regulator, our data confirm that GDF-15 induces protein expression via TβRII and activation of a non-Smad pathway, and provide novel insight into the mechanism of GDF-15 function in neurons.
Keywords: Akt/mTOR; Cav1.3; ERK; GDF-15; TβRII; [Ca2+]i.
© 2016 The Author(s).
Figures
Similar articles
-
GDF15 regulates Kv2.1-mediated outward K+ current through the Akt/mTOR signalling pathway in rat cerebellar granule cells.Biochem J. 2014 May 15;460(1):35-47. doi: 10.1042/BJ20140155. Biochem J. 2014. PMID: 24597762 Free PMC article.
-
Aβ40 modulates GABA(A) receptor α6 subunit expression and rat cerebellar granule neuron maturation through the ERK/mTOR pathway.J Neurochem. 2014 Feb;128(3):350-62. doi: 10.1111/jnc.12471. Epub 2013 Oct 24. J Neurochem. 2014. PMID: 24118019
-
Growth differentiation factor-15 promotes glutamate release in medial prefrontal cortex of mice through upregulation of T-type calcium channels.Sci Rep. 2016 Jun 29;6:28653. doi: 10.1038/srep28653. Sci Rep. 2016. PMID: 27353765 Free PMC article.
-
Exploring the dominant role of Cav1 channels in signalling to the nucleus.Biosci Rep. 2012 Dec 20;33(1):97-101. doi: 10.1042/BSR20120099. Biosci Rep. 2012. PMID: 23088728 Free PMC article. Review.
-
[Effects of growth differentiation factor-15 (GDF-15) on neurological systems, cardiovascular diseases, and cancer progression].Sheng Li Xue Bao. 2017 Feb 25;69(1):109-121. Sheng Li Xue Bao. 2017. PMID: 28217814 Review. Chinese.
Cited by
-
Neuritin promotes neurite and spine growth in rat cerebellar granule cells via L-type calcium channel-mediated calcium influx.J Neurochem. 2018 Oct;147(1):40-57. doi: 10.1111/jnc.14535. Epub 2018 Aug 16. J Neurochem. 2018. PMID: 29920676 Free PMC article.
-
Electrical Conduction System Remodeling in Streptozotocin-Induced Diabetes Mellitus Rat Heart.Front Physiol. 2019 Jul 8;10:826. doi: 10.3389/fphys.2019.00826. eCollection 2019. Front Physiol. 2019. PMID: 31338036 Free PMC article.
-
Mitochondrial Glutamine Metabolism Drives Epileptogenesis in Primary Hippocampal Neurons.J Neurosci. 2025 May 21;45(21):e0110252025. doi: 10.1523/JNEUROSCI.0110-25.2025. J Neurosci. 2025. PMID: 40228896
-
GDF15 Mediates the Effect of Skeletal Muscle Contraction on Glucose-Stimulated Insulin Secretion.Diabetes. 2023 Aug 1;72(8):1070-1082. doi: 10.2337/db22-0019. Diabetes. 2023. PMID: 37224335 Free PMC article.
-
GDF11 Modulates Ca2+-Dependent Smad2/3 Signaling to Prevent Cardiomyocyte Hypertrophy.Int J Mol Sci. 2018 May 18;19(5):1508. doi: 10.3390/ijms19051508. Int J Mol Sci. 2018. PMID: 29783655 Free PMC article.
References
-
- Xu X.-y., Nie Y., Wang F.-f., Bai Y., Lv Z.-z., Zhang Y.-y., Li Z.-j., Gao W. Growth differentiation factor (GDF)-15 blocks norepinephrineinduced myocardial hypertrophy via a novel pathway involving inhibition of epidermal growth factor receptor transactivation. J. Biol. Chem. 2014;289:10084–10094. doi: 10.1074/jbc.M113.516278. - DOI - PMC - PubMed
MeSH terms
Substances
LinkOut - more resources
Full Text Sources
Other Literature Sources
Miscellaneous