

The effects of climatic fluctuations and extreme events on running water ecosystems
- PMID: 27114576
- PMCID: PMC4843695
- DOI: 10.1098/rstb.2015.0274
The effects of climatic fluctuations and extreme events on running water ecosystems
Abstract
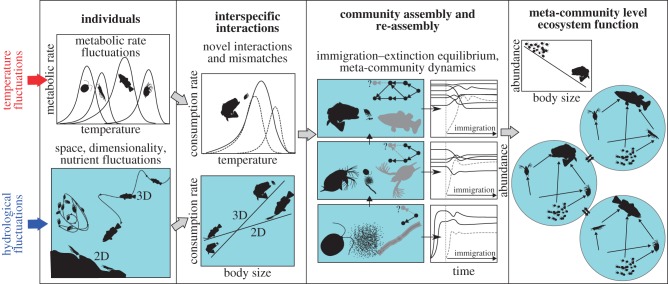
Most research on the effects of environmental change in freshwaters has focused on incremental changes in average conditions, rather than fluctuations or extreme events such as heatwaves, cold snaps, droughts, floods or wildfires, which may have even more profound consequences. Such events are commonly predicted to increase in frequency, intensity and duration with global climate change, with many systems being exposed to conditions with no recent historical precedent. We propose a mechanistic framework for predicting potential impacts of environmental fluctuations on running-water ecosystems by scaling up effects of fluctuations from individuals to entire ecosystems. This framework requires integration of four key components: effects of the environment on individual metabolism, metabolic and biomechanical constraints on fluctuating species interactions, assembly dynamics of local food webs, and mapping the dynamics of the meta-community onto ecosystem function. We illustrate the framework by developing a mathematical model of environmental fluctuations on dynamically assembling food webs. We highlight (currently limited) empirical evidence for emerging insights and theoretical predictions. For example, widely supported predictions about the effects of environmental fluctuations are: high vulnerability of species with high per capita metabolic demands such as large-bodied ones at the top of food webs; simplification of food web network structure and impaired energetic transfer efficiency; and reduced resilience and top-down relative to bottom-up regulation of food web and ecosystem processes. We conclude by identifying key questions and challenges that need to be addressed to develop more accurate and predictive bio-assessments of the effects of fluctuations, and implications of fluctuations for management practices in an increasingly uncertain world.
Keywords: biodiversity; community assembly; ecosystem functioning; food webs; metabolism; resilience.
© 2016 The Authors.
Figures
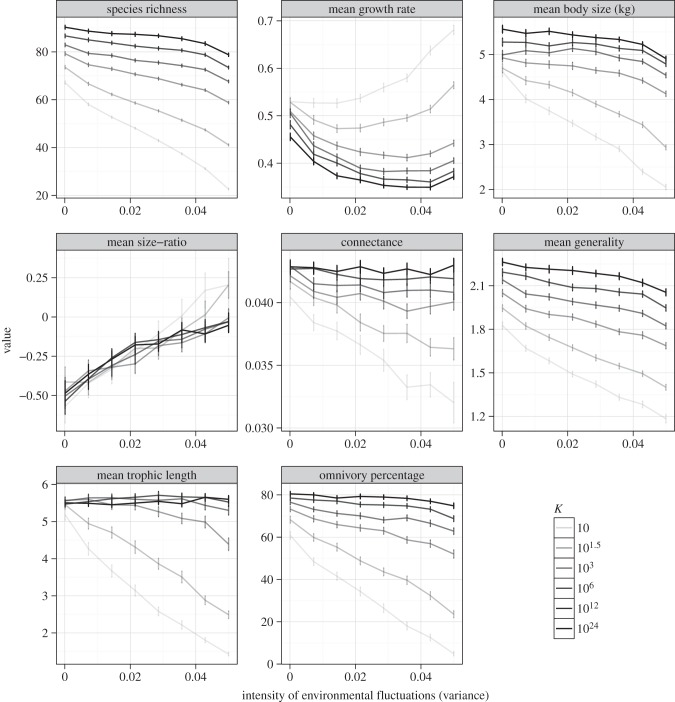
 ; equation S3) are shown at different carrying capacities (K). Size-based properties—mean size and consumer–resource size ration—are on log10 scale. The bars represent 95% confidence intervals around the mean of 200 community assembly simulations. Each model community at the end of a simulation is at immigration–extinction equilibrium. Model structure and parametrizations are detailed in the electronic supplementary material, appendix S1.
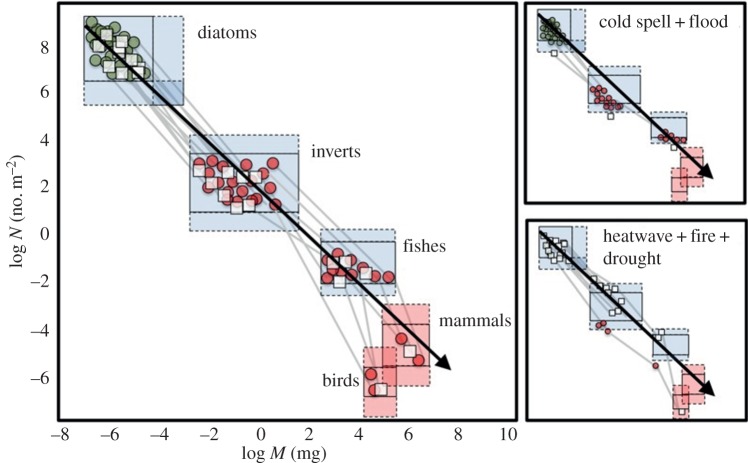
References
-
- IPCC. 2012. Managing the risks of extreme events and disasters to advance climate change adaptation. Cambridge, UK: Cambridge University Press.
-
- Burkett VR, Suarez AG, Bindi M, Conde C, Mukerji R, Prather MJ, St Clair AL, Yohe GW. 2014. Global and Sectoral Aspects. Contribution of Working Group II to the Fifth Assessment Report of the Intergovernmental Panel on Climate Change. In Climate Change 2014 Impacts, Adaptation Vulnerability (eds CB Field et al.), pp. 1132. Cambridge, UK and New York, NY, USA: Cambridge University Press.
-
- Reid MA, Ogden RW. 2006. Trend, variability or extreme event? The importance of long-term perspectives in river ecology. River Res. Appl. 22, 167–177. ( 10.1002/rra.903) - DOI
-
- Kunkel KE, et al. 2013. Monitoring and understanding trends in extreme storms: State of knowledge. Bull. Am. Meteorol. Soc. 94, 499–514. ( 10.1175/BAMS-D-11-00262.1) - DOI
Publication types
MeSH terms
LinkOut - more resources
Full Text Sources
Other Literature Sources
Medical