. 2016 May;147(5):375-94.
doi: 10.1085/jgp.201511499.

Structure-function relationships of peptides forming the calcin family of ryanodine receptor ligands

Affiliations

Structure-function relationships of peptides forming the calcin family of ryanodine receptor ligands

Liang Xiao et al. J Gen Physiol. 2016 May.

Abstract

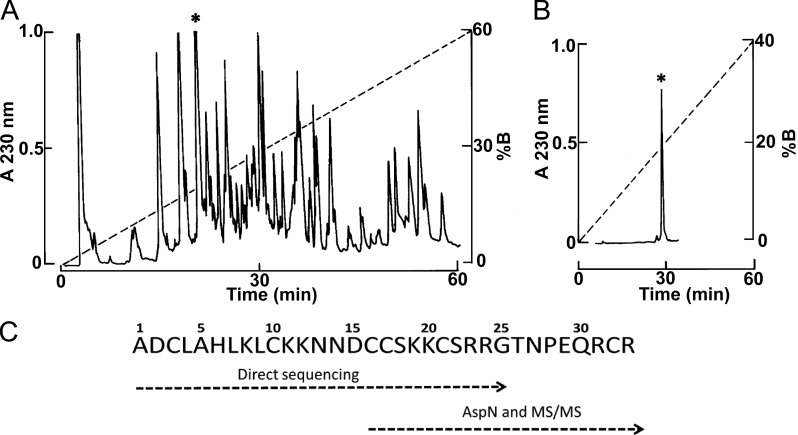
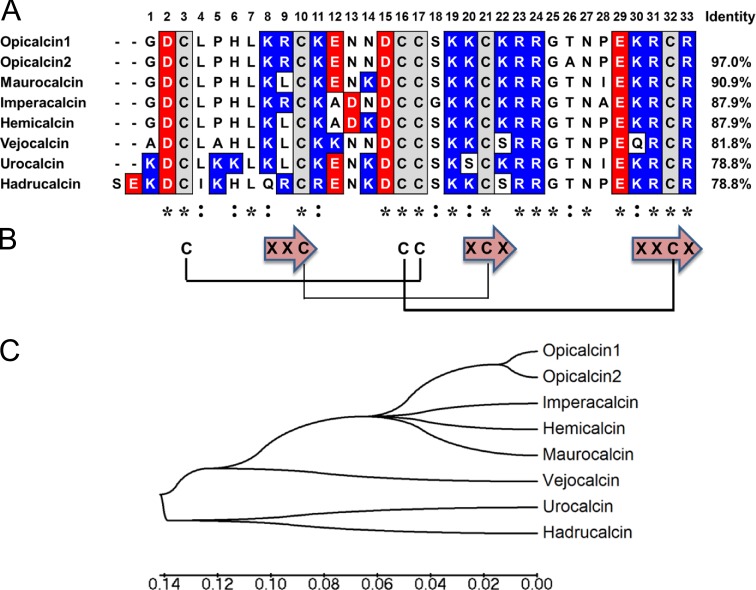
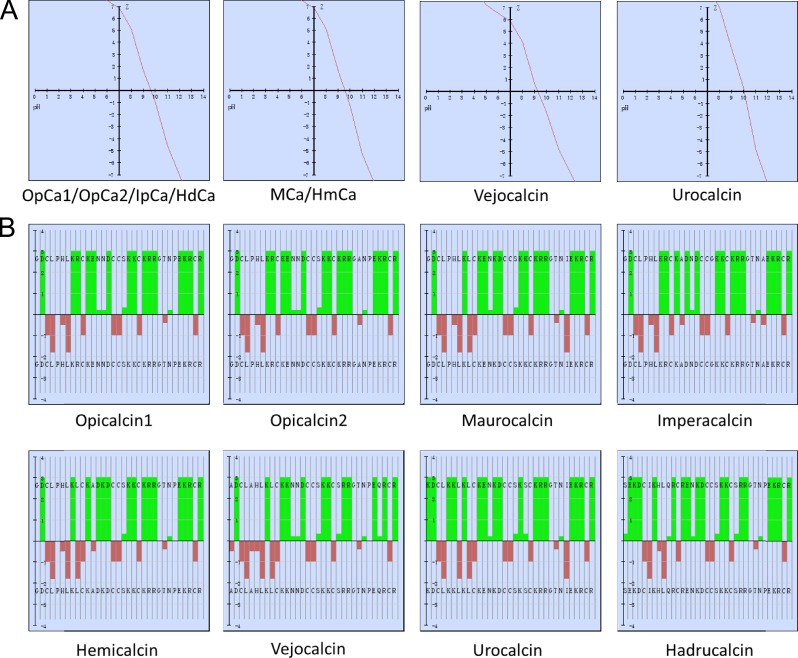
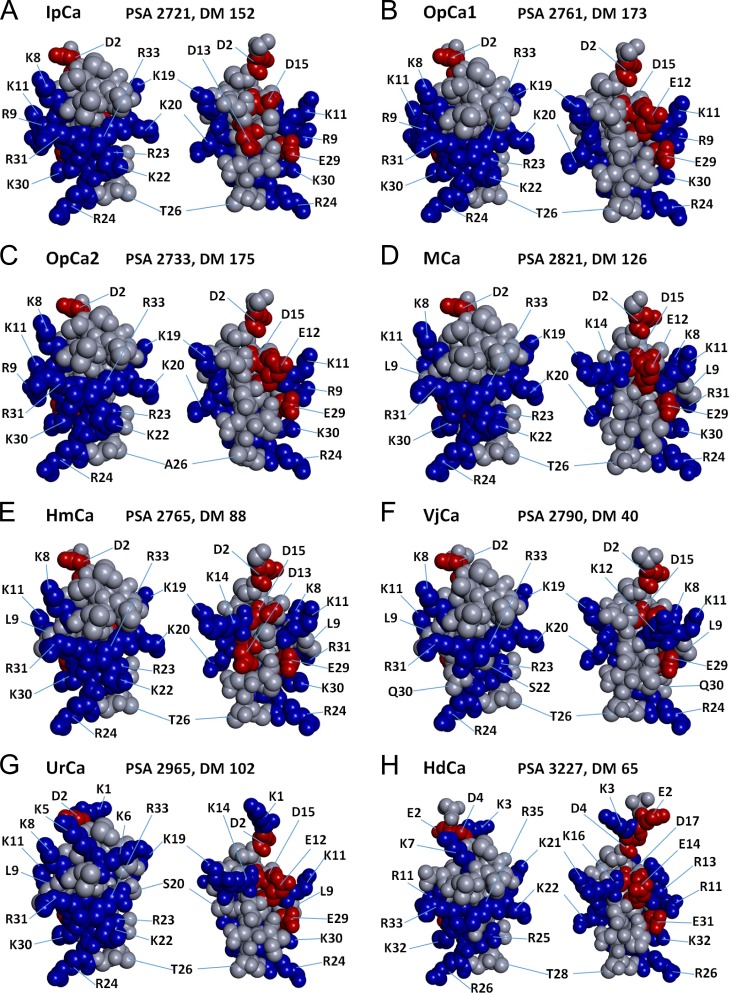
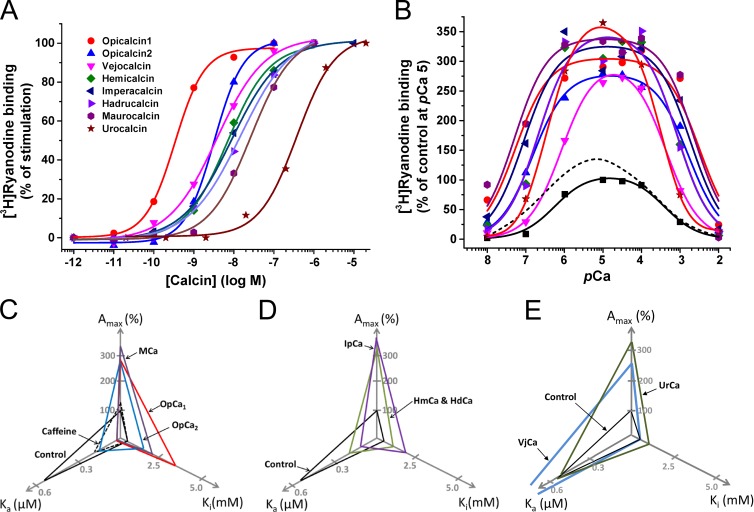
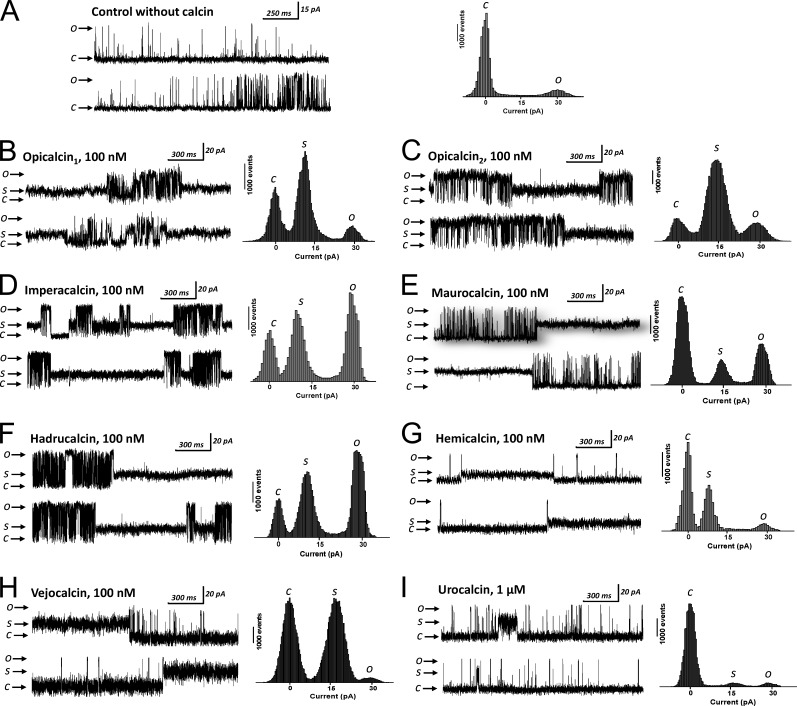
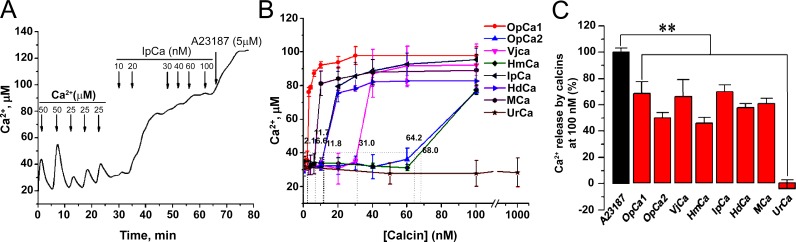
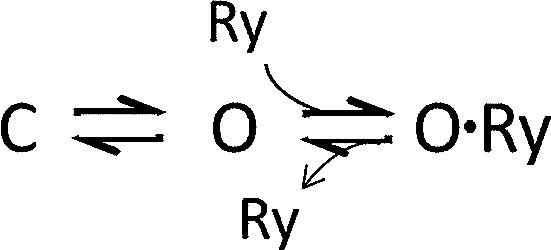
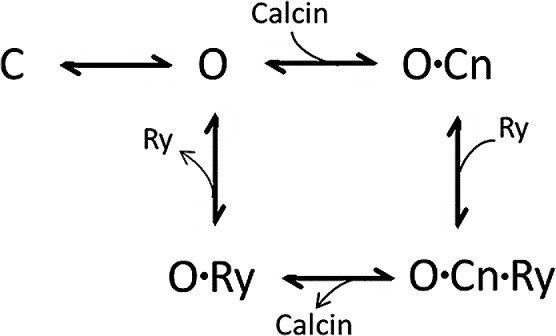
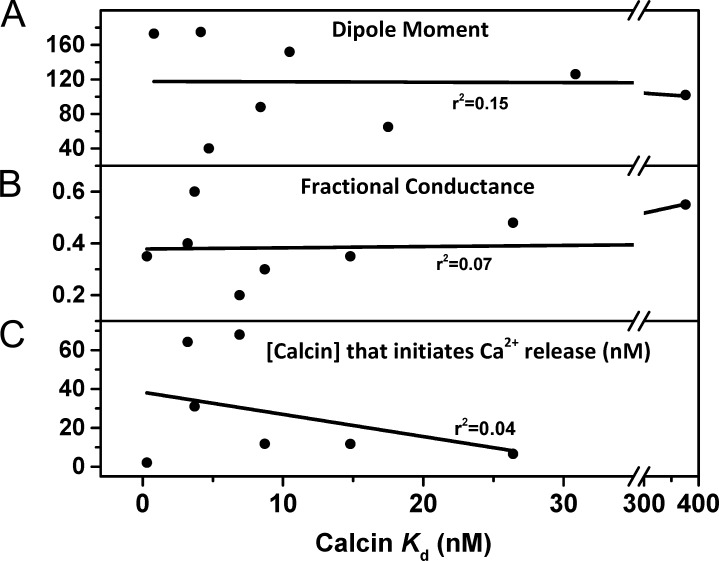
Calcins are a novel family of scorpion peptides that bind with high affinity to ryanodine receptors (RyRs) and increase their activity by inducing subconductance states. Here, we provide a comprehensive analysis of the structure-function relationships of the eight calcins known to date, based on their primary sequence, three-dimensional modeling, and functional effects on skeletal RyRs (RyR1). Primary sequence alignment and evolutionary analysis show high similarity among all calcins (≥78.8% identity). Other common characteristics include an inhibitor cysteine knot (ICK) motif stabilized by three pairs of disulfide bridges and a dipole moment (DM) formed by positively charged residues clustering on one side of the molecule and neutral and negatively charged residues segregating on the opposite side. [(3)H]Ryanodine binding assays, used as an index of the open probability of RyRs, reveal that all eight calcins activate RyR1 dose-dependently with Kd values spanning approximately three orders of magnitude and in the following rank order: opicalcin1 > opicalcin2 > vejocalcin > hemicalcin > imperacalcin > hadrucalcin > maurocalcin >> urocalcin. All calcins significantly augment the bell-shaped [Ca(2+)]-[(3)H]ryanodine binding curve with variable effects on the affinity constants for Ca(2+) activation and inactivation. In single channel recordings, calcins induce the appearance of a subconductance state in RyR1 that has a unique fractional value (∼20% to ∼60% of the full conductance state) but bears no relationship to binding affinity, DM, or capacity to stimulate Ca(2+) release. Except for urocalcin, all calcins at 100 nM concentration stimulate Ca(2+) release and deplete Ca(2+) load from skeletal sarcoplasmic reticulum. The natural variation within the calcin family of peptides offers a diversified set of high-affinity ligands with the capacity to modulate RyRs with high dynamic range and potency.


Figures

Figure 1.
Figure 1.
Purification and characterization of vejocalcin. (A) 1.5 mg of soluble venom from V. mexicanus was separated by HPLC using a semi-preparative C18 reverse-phase column, eluted with a linear gradient from solution A to 60% solution B, run for 60 min. The fraction labeled with the asterisk was rechromatographed in an analytical C18 reverse-phase column and run from solution A to 40% solution B in 60 min. (B) The component with retention time of 28.09 min (marked with an asterisk) is vejocalcin. (C) The complete amino acid sequence of vejocalcin was obtained by a combination of direct Edman degradation and mass spectrometry, as described in Materials and methods.
Figure 2.
Figure 2.
Calcin sequence alignment and evolutionary analysis. (A) The eight calcins known to date are aligned with opicalcin1 as reference by Clustal Omega. The identity values to opicalcin1 are shown on the right side. Positively charged residues lysine (K) and arginine (R), negatively charged residues aspartic acid (D) and glutamic acid (E), and the disulfide bond-forming cysteine (C) are highlighted by the colors blue, red, and gray, respectively. Columns with identical residue are marked by asterisks, whereas columns with only one difference are marked by colons on the bottom. (B) Three pairs of highly conserved disulfide bonds (Cys3-Cys17, Cys10-Cys21, and Cys16-Cys32) and the residues forming part of β strands appear connected to form an ICK motif. (C) The evolutionary tree is built with the principle minimum evolution by MEGA 5.2. The genetic distance is measured by Poisson correction method with the formula dAB = −ln(1 − fAB), where fAB is the fraction of different amino acids after the Poisson distribution between two sequences (dissimilarity).
Figure 3.
Figure 3.
Net charge versus pH plot and hydrophobicity plot of calcins. (A) Net charge versus pH plot of calcins. The theoretical isoelectric points of calcins are highly basic with values ranging from 9.3 (vejocalcin) to 10.1 (urocalcin), whereas the net charges at pH 7.0 are positive for all calcins and vary from 5.8 (vejocalcin) to 8.7 (urocalcin). (B) Hydrophobicity plot of calcins. The ratio of hydrophilic residues (green) of calcins is between 52% (imperacalcin and hemicalcin) and 66% (hadrucalcin), indicating high solubility in water for all calcins.
Figure 4.
Figure 4.
Three-dimensional modeling of calcins. (A) Imperacalcin, resolved by 1H-NMR (Lee et al., 2004), was taken as the template molecule. (B–H) Other calcins, including opicalcin1 (B), opicalcin2 (C), maurocalcin (D), hemicalcin (E), vejocalcin (F), urocalcin (G), and hadrucalcin (H), were simulated by Swiss-PdbViewer 4.1.0 and viewed by Discovery Studio 3.5. Solvent-accessible PSAs were calculated using PyMOL, whereas DMs were analyzed by the online Protein Dipole Moments Server. For each calcin, the solid ribbon with line atom model may be found in Fig. S1, and the charged CPK model with frontal side (middle) and dorsal side (right) are displayed here. Positively charged residues (Lys and Arg), negatively charged residues (Asp and Glu), and neutral residues are colored by blue, red, and gray, respectively.
Figure 5.
Figure 5.
[3H]Ryanodine binding stimulation by calcins. (A) Dose-dependent activation of RyR1 by calcins, with boundaries set at 1 pM to 20 µM (n = 3–5). Heavy SR from rabbit skeletal muscle was incubated with 5 nM [3H]ryanodine in the absence (control) and the presence of the indicated concentrations of calcins. Binding conditions were specified in Materials and methods. The Kd was determined with the formula B = (Bmax)/[1 + (Kd/[calcin])nH), where B is specific binding of [3H]ryanodine, Bmax is the maximum binding stimulated by calcin, and nH is the Hill coefficient. (B) Effect of calcins (100 nM each; n = 3–5) on the Ca2+-dependent [3H]ryanodine binding curve. Ca2+-dependent activation and inactivation were fitted with the formula B = ((Bmax·[Ca2+])/(Ka + [Ca2+]))·(Ki/(Ki + [Ca2+])), where B is the specific binding of [3H]ryanodine, Bmax is the maximum binding stimulated by calcin, Ka is the activation constant, and Ki is the inactivation constant. The specific [3H]ryanodine binding was standardized with the value of the control at pCa5 as 100%. (C–E) Radar charts illustrating the effect of calcins on Ka, Ki, and maximal amplitude (Amax; percentage of stimulation with respect to control). The black line corresponds to control (no calcin) and is included in all charts for reference. Caffeine (C, dashed line) moves Ka but has little effect on Amax and no effect on Ki. This effect contrasts with that of calcins (C–E, color lines as indicated), which affect Ka, Ki, and Amax.
Figure 6.
Figure 6.
Fractional subconductance value induced by calcins on single RyR1 channels. RyR1 channel from rabbit skeletal muscle SR vesicles was reconstituted in lipid bilayers and recorded and analyzed as described in Materials and methods. (A) Single RyR1 channel in the absence of calcin is presented as control. (B–I) The eight calcins were added separately into the cis (cytosolic) chamber at the indicated concentration. c represents the zero current level when the channel is in the fully closed state, whereas s and o display the subconductance state and full opening of the channel, respectively. Current histograms from 10,000–30,000-ms segments of channel activity are shown at the right side of the traces for each calcin. The number of experiments varied for each calcin. Imperacalcin, maurocalcin, and hadrucalcin: n = 12, 8, and 5 different channels. All other calcins were tested at least two or three times.
Figure 7.
Figure 7.
Calcin-induced Ca2+ release from skeletal heavy SR vesicles. (A) Typical trace of Ca2+ release by calcins. A concentration of 20 nM imperacalcin elicited abrupt Ca2+ release from SR vesicles, and further additions had incremental effects only. The fraction of calcin-induced Ca2+ release was calculated by adding the Ca2+ ionophore A23187 (5 µM). (B) Except urocalcin, all calcins elicited abrupt Ca2+ release within 100 nM (n = 3–4). (C) At 100 nM, all calcins except urocalcin elicited Ca2+ release to ∼60% of total Ca2+ load from heavy SR. Mean ± SEM is shown. **, P < 0.01; calcins versus A23187, t test.
(Scheme 1)
(Scheme 1)
(Scheme 2)
(Scheme 2)
Figure 8.
Figure 8.
DM, fractional conductance, and Ca2+ release appear unrelated to the Kd of calcins. (A) Plot of DM versus Kd of [3H]ryanodine binding. The DMs have a poor correlation with the binding affinity (r2 = 0.15). (B) Subconductance versus Kd of [3H]ryanodine binding. The position of subconductance induced by calcin is unrelated to the Kd of [3H]ryanodine binding (r2 = 0.07). (C) Ca2+ release versus [3H]ryanodine binding. No correlation is seen between calcin concentration that induces Ca2+ release and Kd of [3H]ryanodine binding (r2 = 0.04).

Similar articles

Cited by

References

    1. Abramson, J.J., Buck E., Salama G., Casida J.E., and Pessah I.N.. 1988. Mechanism of anthraquinone-induced calcium release from skeletal muscle sarcoplasmic reticulum. J. Biol. Chem. 263:18750–18758. - PubMed
    1. Altafaj, X., Cheng W., Estève E., Urbani J., Grunwald D., Sabatier J.M., Coronado R., De Waard M., and Ronjat M.. 2005. Maurocalcine and domain A of the II-III loop of the dihydropyridine receptor Cav 1.1 subunit share common binding sites on the skeletal ryanodine receptor. J. Biol. Chem. 280:4013–4016. 10.1074/jbc.C400433200 - DOI - PMC - PubMed
    1. Ather, S., Respress J.L., Li N., and Wehrens X.H.. 2013. Alterations in ryanodine receptors and related proteins in heart failure. Biochim. Biophys. Acta. 1832:2425–2431. 10.1016/j.bbadis.2013.06.008 - DOI - PMC - PubMed
    1. Benkusky, N.A., Farrell E.F., and Valdivia H.H.. 2004. Ryanodine receptor channelopathies. Biochem. Biophys. Res. Commun. 322:1280–1285. 10.1016/j.bbrc.2004.08.033 - DOI - PubMed
    1. Bers, D.M. 2002. Cardiac excitation-contraction coupling. Nature. 415:198–205. 10.1038/415198a - DOI - PubMed

Publication types

MeSH terms

Substances

Associated data