. 2016 Mar 31:11:530-537.
doi: 10.1016/j.nicl.2016.03.017. eCollection 2016.

Autonomic correlations with MRI are abnormal in the brainstem vasomotor centre in Chronic Fatigue Syndrome

Affiliations

Autonomic correlations with MRI are abnormal in the brainstem vasomotor centre in Chronic Fatigue Syndrome

Leighton R Barnden et al. Neuroimage Clin. .

Abstract

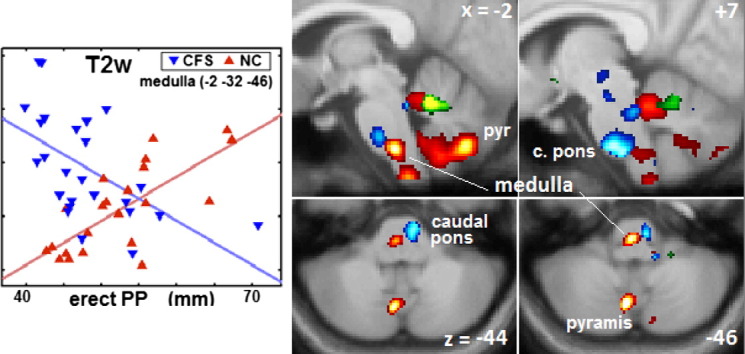
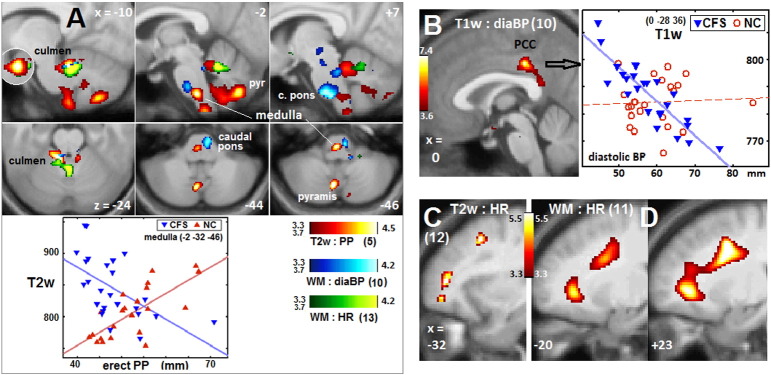
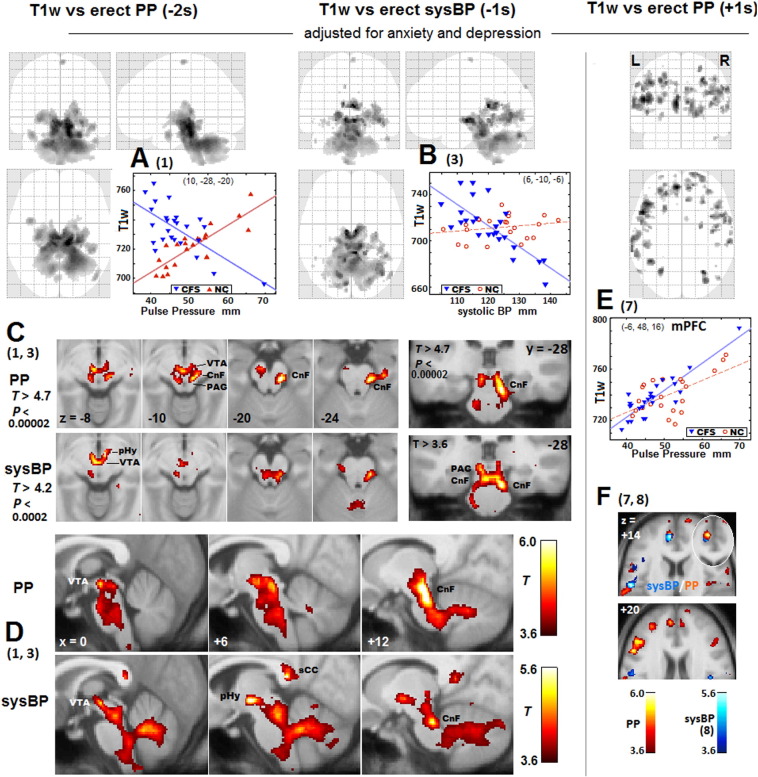
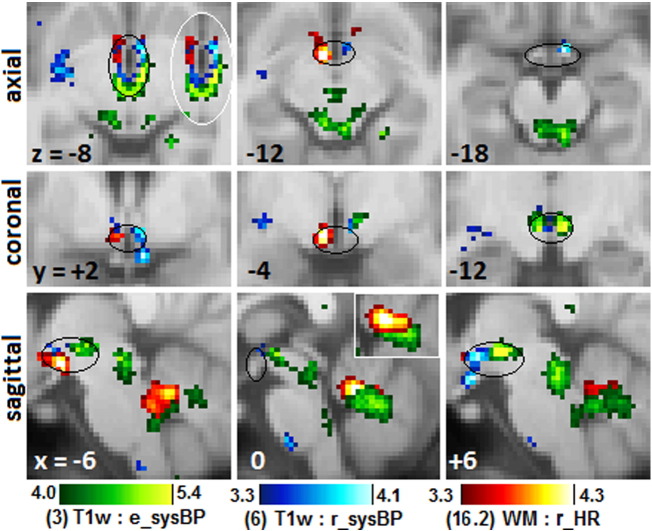
Autonomic changes are often associated with the chronic fatigue syndrome (CFS), but their pathogenetic role is unclear and brain imaging investigations are lacking. The vasomotor centre and, through it, nuclei in the midbrain and hypothalamus play a key role in autonomic nervous system regulation of steady state blood pressure (BP) and heart rate (HR). In this exploratory cross-sectional study, BP and HR, as indicators of autonomic function, were correlated with volumetric and T1- and T2-weighted spin-echo (T1w and T2w) brain MRI in 25 CFS subjects and 25 normal controls (NC). Steady state BP (systolic, diastolic and pulse pressure) and HR in two postures were extracted from 24 h blood pressure monitoring. We performed (1) MRI versus autonomic score interaction-with-group regressions to detect locations where regression slopes differed in the CFS and NC groups (collectively indicating abnormality in CFS), and (2) MRI regressions in the CFS and NC groups alone to detect additional locations with abnormal correlations in CFS. Significant CFS regressions were repeated controlling for anxiety and depression (A&D). Abnormal regressions were detected in nuclei of the brainstem vasomotor centre, midbrain reticular formation and hypothalamus, but also in limbic nuclei involved in stress responses and in prefrontal white matter. Group comparisons of CFS and NC did not find MRI differences in these locations. We propose therefore that these regulatory nuclei are functioning correctly, but that two-way communication between them is impaired in CFS and this affects signalling to/from peripheral effectors/sensors, culminating in inverted or magnified correlations. This single explanation for the diverse abnormal correlations detected here consolidates the conclusion for a brainstem/midbrain nerve conduction deficit inferred earlier (Barnden et al., 2015). Strong correlations were also detected in isolated NC regressions.

Keywords: 1s, 1 sample; 2s, 2 sample; A&D, anxiety and depression; Anxiety and depression; Autonomic; BA, Brodmann Area; BP, blood pressure; Blood pressure; CFS, chronic fatigue syndrome; Cb, cerebellum; Chronic fatigue syndrome; CnF, cuneiform nucleus of the reticular formation; DLPF, dorsolateral prefrontal; FDR, false discovery rate; FWE, family wise error; GM, grey matter; HADS, Hospital Anxiety and Depression Scale; HR, heart rate; Heart rate; Hypothalamus; MRI; Midbrain; NC, normal controls; Nerve conduction; PCC, posterior cingulate cortex; PHg, parahippocampal gyrus; POTS, postural orthostatic tachycardia syndrome; PP, pulse pressure; Posture; RAS, reticular activation system; Regression; SS, symptom score; VBIS, voxel based iterative sensitivity; Vasomotor centre; WM, white matter; ccP, corrected cluster P statistic; diaBP, diastolic blood pressure; sysBP, systolic Blood pressure; uvP, uncorrected voxel P statistic.


Figures

Image 1
Graphical abstract
Fig. 1
Fig. 1
Brainstem vasomotor centre, cerebellum, PCC and prefrontal WM clusters. Sections through 8 clusters from Table 2. Coloured voxels code for the T statistic (refer colour stripes). Image type, basic hemodynamic score and (Table 2 cluster number) are annotated. The voxel P threshold for colour display was 0.001, except for 0.00025 (T = 3.7) for the lower (axial) panel of (A). Plots show T2w and T1w values for individual CFS and NC subjects (adjusted for age and global value) at the most significant voxels. Lines show the general linear model fits. (A) shows involvement of the rostral ventral medulla (x = − 2), right caudal basal pons (x = + 7), and culmen (x = − 10) and pyramis (x = − 10, − 2 and z = − 44, − 46) of the cerebellar vermis. The x = − 10 insert reverses the overlap at the culmen. (B) posterior cingulate cortex (PCC). For the CFS regression plotted, corrected voxel P = 0.04. (C) left prefrontal WM, and (D) left and right prefrontal WM.
Fig. 2
Fig. 2
Clusters from T1w regressions with erect PP and erect sysBP. Numbers (in parentheses) reference Table 2 regressions. Greyscale (upper panels) or colour (lower panels) levels represent the T statistic. The voxel P threshold for voxel display is 0.001 except as labelled in (C). In (A), (B) and (E) maximum T statistic projections show the spatial extent of the correlations. The two negative regressions yielded clusters of similar extent but with different peak locations. Beneath are transaxial (C and F), coronal (C) and sagittal (D) sections through peak voxels. A stricter threshold is applied in(C). In PP, this isolates two peaks in the reticular formation cuneiform nucleus (CnF) at z = − 10 and − 20 and one in the ventral tegmental area (VTA) at z = − 10. In sysBP, there is posterior hypothalamus (pHy) peak adjacent to a VTA peak at z = − 8. Sections in (F) show positive PP and sysBP regression clusters: at z = + 14 in the medial prefrontal cortex for both (the elliptical insert reverses the overlap) and in the left postcentral somatosensory gyrus for sysBP; and at z = + 20 in the left DLPF cortex for PP. In the 1s plots in (B) and (E), NC values, although not used in the analysis, are also shown (in red). The plot in (E) illustrates a case when the 1s NC analysis detected a co-located cluster and the CFS result was not regarded as abnormal.
Fig. 3
Fig. 3
Clusters in the hypothalamus. Magnified sections of clusters that show peaks of significance in the hypothalamus from 3 different MR regressions with erect and reclining systolic BP, and reclining HR (Table 2, clusters 3, 6, 16.2). Black ellipses loosely outline the hypothalamus. White-bordered inserts at z = − 8 and x = 0 reverse the order of cluster overlap. There was little overlap at z = − 8. Clusters were from regressions not adjusted for anxiety and depression. Sagittal sections also show clusters in the midbrain, brainstem and cerebellar vermis. In the hypothalamus, peaks were located in the posterior (green, blue), lateral (red) and anterior (red, blue) divisions. The green sysBP posterior hypothalamus cluster at x = + 6 and z = − 8 is also seen in Fig. 2(D) at x = + 6.

References

    1. Abbott D., Pell G., Pardoe H., Jackson G. Voxel-Based Iterative Sensitivity (VBIS): methods and a validation of intensity scaling for T2-weighted imaging of hippocampal sclerosis. NeuroImage. 2009;44:812–819. - PubMed
    1. Barnden L., Crouch B., Kwiatek R., Burnet R., Del Fante P. Evidence in chronic fatigue syndrome for severity-dependent upregulation of prefrontal myelination that is independent of anxiety and depression. NMR Biomed. 2015;28(3):404–413. - PMC - PubMed
    1. Barnden L., Crouch B., Kwiatek R., Burnet R., Mernone A., Chryssidis S., Scroop G., Del Fante P. A brain MRI study of chronic fatigue syndrome: evidence of brainstem dysfunction and altered homeostasis. NMR Biomed. 2011;24(10):1302–1312. - PMC - PubMed
    1. Baroncini M., Jissendi P., Balland E., Besson P., Pruvo J., Francke J., Dewailly D., Blond S., Prevot V. MRI atlas of the human hypothalamus. NeuroImage. 2012;59:168–180. - PubMed
    1. Beacher F., Gray M., Mathias C., Critchley H. Vulnerability to simple faints is predicted by regional differences in brain anatomy. NeuroImage. 2009;47:937–945. - PMC - PubMed

Publication types

MeSH terms