. 2016 Apr 26;11(4):e0145254.
doi: 10.1371/journal.pone.0145254. eCollection 2016.

A Multi-Site Study of Norovirus Molecular Epidemiology in Australia and New Zealand, 2013-2014

Affiliations

A Multi-Site Study of Norovirus Molecular Epidemiology in Australia and New Zealand, 2013-2014

Kun Lee Lim et al. PLoS One. .

Abstract

Background: Norovirus (NoV) is the major cause of acute gastroenteritis across all age groups. In particular, variants of genogroup II, genotype 4 (GII.4) have been associated with epidemics globally, occurring approximately every three years. The pandemic GII.4 variant, Sydney 2012, was first reported in early 2012 and soon became the predominant circulating NoV strain globally. Despite its broad impact, both clinically and economically, our understanding of the fundamental diversity and mechanisms by which new NoV strains emerge remains limited. In this study, we describe the molecular epidemiological trends of NoV-associated acute gastroenteritis in Australia and New Zealand between January 2013 and June 2014.

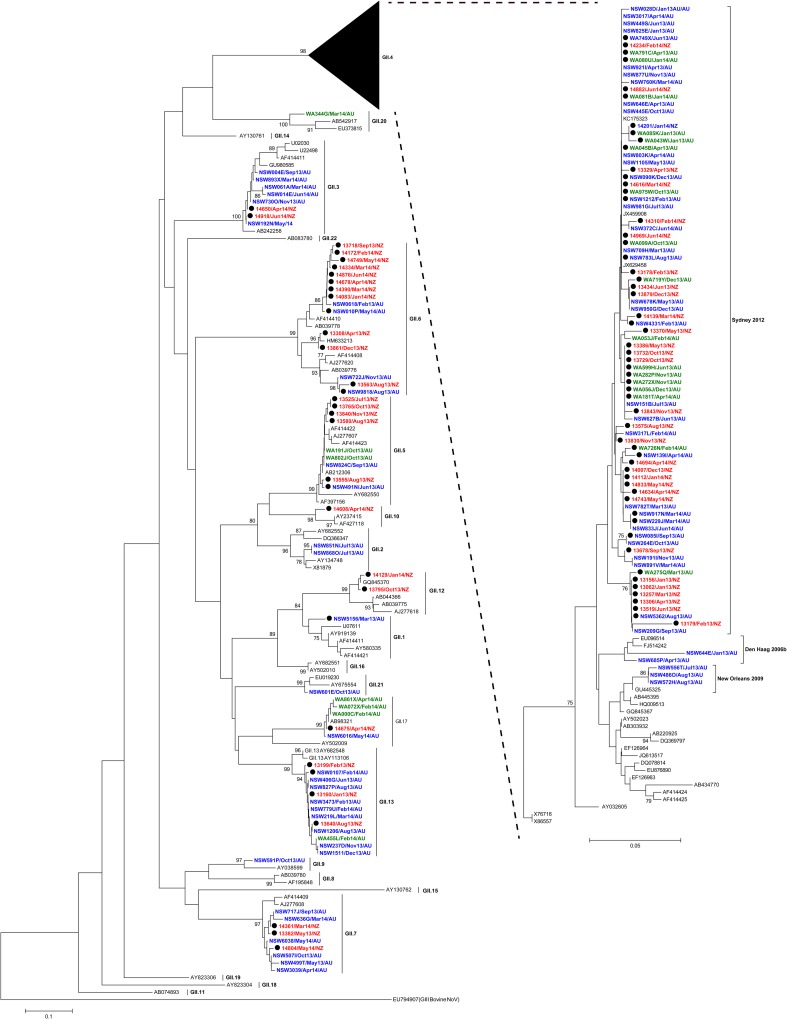
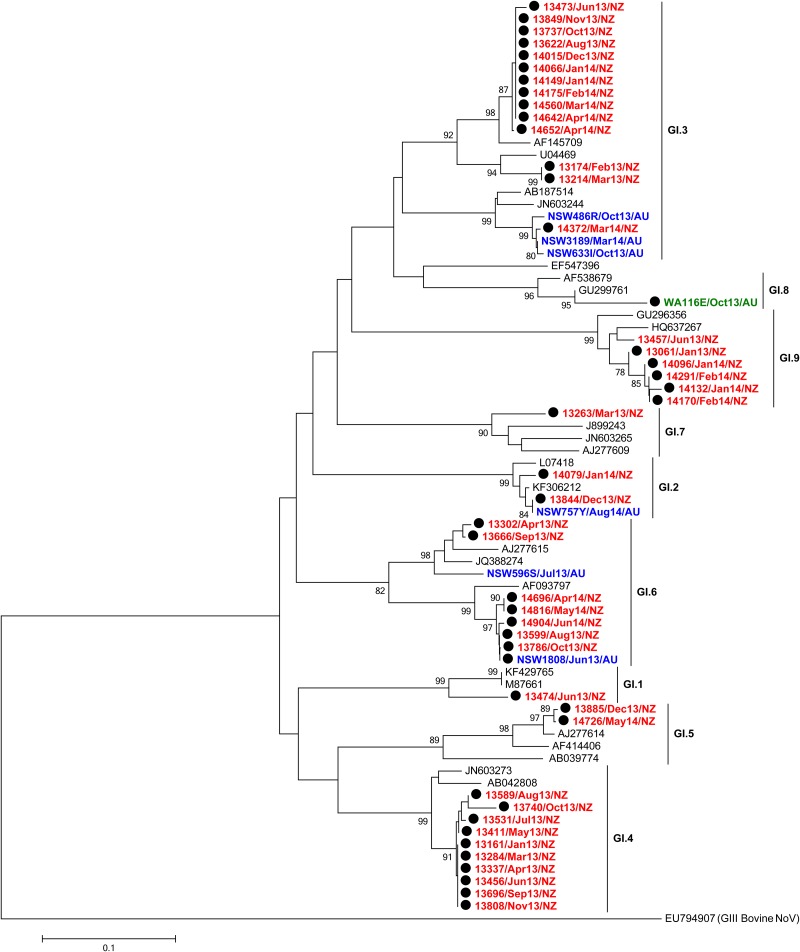
Methodology: Overall, 647 NoV-positive clinical faecal samples from 409 outbreaks and 238 unlinked cases of acute gastroenteritis were examined by RT-PCR and sequencing. Phylogenetic analysis was then performed to identify NoV capsid genotypes and to establish the temporal dominance of circulating pandemic GII.4 variants. Recombinant viruses were also identified based on analysis of the ORF1/2 overlapping region.

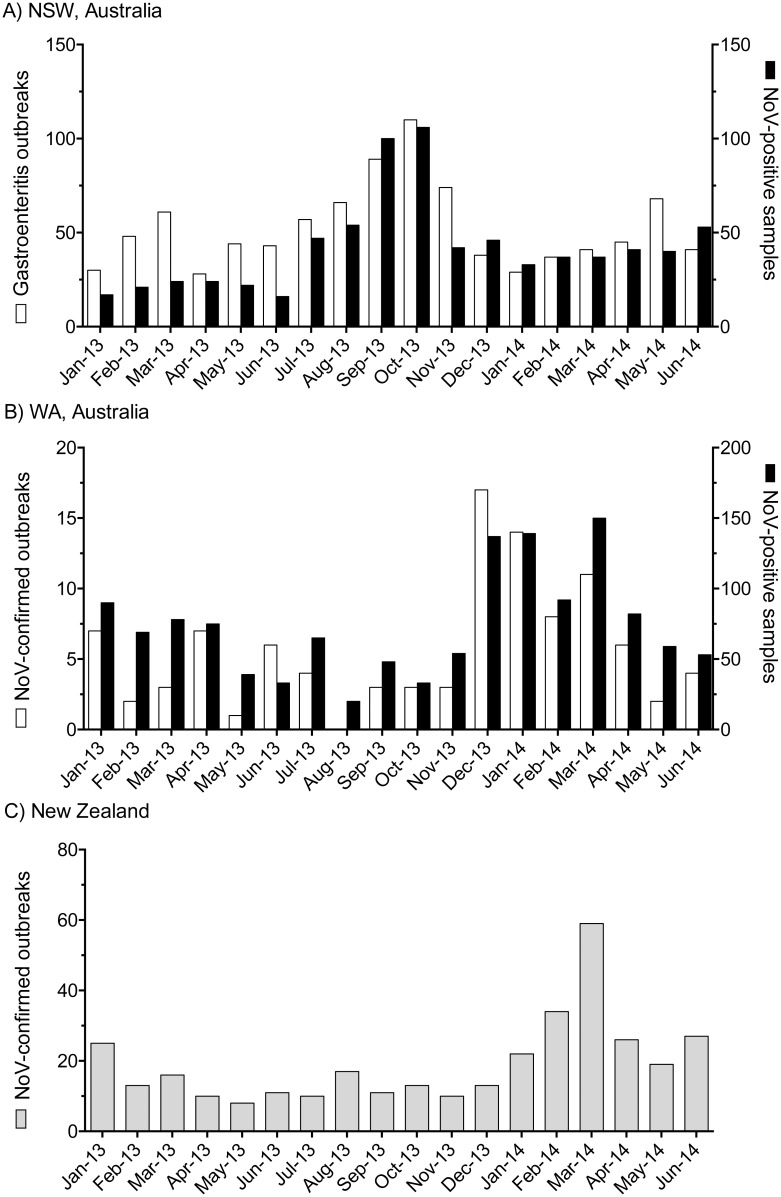
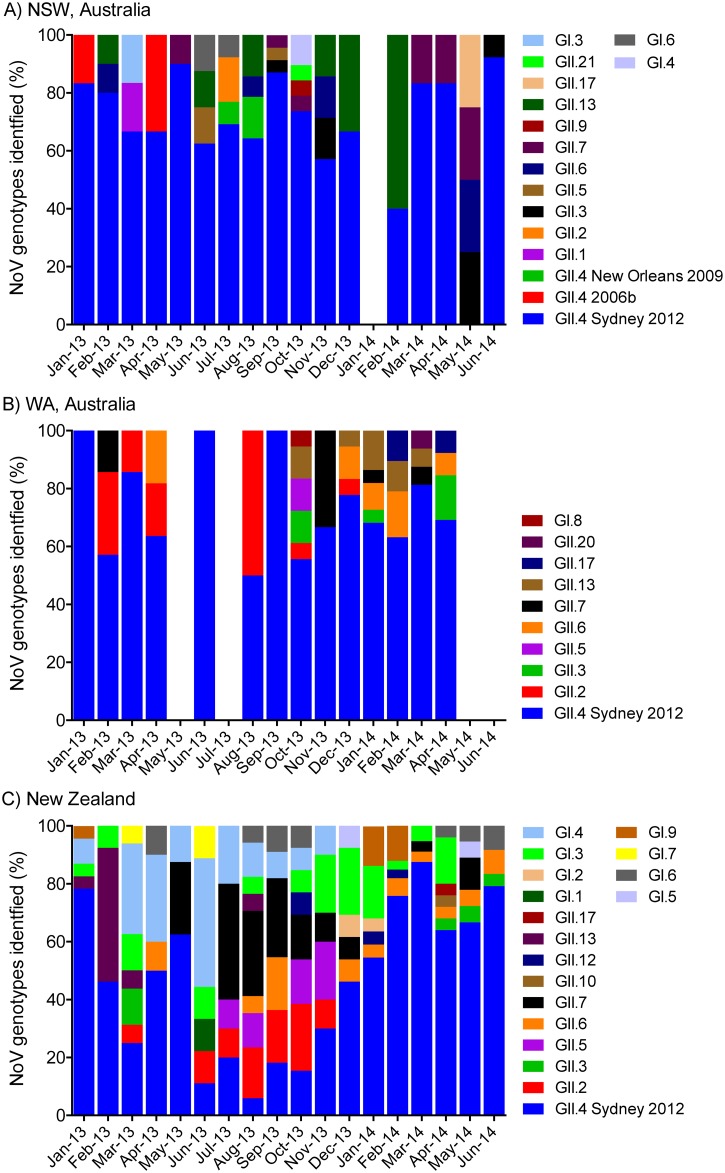
Findings: Peaks in NoV activity were observed, however the timing of these epidemics varied between different regions. Overall, GII.4 NoVs were the dominant cause of both outbreaks and cases of NoV-associated acute gastroenteritis (63.1%, n = 408/647), with Sydney 2012 being the most common GII.4 variant identified (98.8%, n = 403/408). Of the 409 reported NoV outbreaks, aged-care facilities were the most common setting in both Western Australia (87%, n = 20/23) and New Zealand (58.1%, n = 200/344) while most of the NoV outbreaks were reported from hospitals (38%, n = 16/42) in New South Wales, Australia. An analysis of a subset of non-GII.4 viruses from all locations (125/239) showed the majority (56.8%, n = 71/125) were inter-genotype recombinants. These recombinants were surprisingly diverse and could be classified into 18 distinct recombinant types, with GII.P16/GII.13 (24% of recombinants) the most common.

Conclusion: This study revealed that following its emergence in 2012, GII.4 Sydney 2012 variant continued to be the predominant cause of NoV-associated acute gastroenteritis in Australia and New Zealand between 2013 and 2014.


Conflict of interest statement

Competing Interests: The authors have declared that no competing interests exist.

Figures

Fig 1
Fig 1. The incidence of NoV-associated gastroenteritis in NSW and WA, Australia and New Zealand from January 2013 to June 2014.
(A) The number of monthly institutional gastroenteritis outbreaks reported to NSW Health (white) was compared to the monthly number of NoV-positive cases (black) reported to SEALS diagnostics laboratory Prince of Wales Hospital, NSW, Australia. (B) The number of confirmed NoV-outbreaks was compared by month to the number of NoV positive cases reported to PathWest Laboratory Medicine at the Queen Elizabeth II Medical Centre, Perth, WA, Australia. Note that the NoV-positive cases reported by both diagnostics laboratories included all individual outbreak cases and sporadic unlinked cases. (C) The number of laboratory confirmed NoV-outbreaks per month reported to the Norovirus Reference Laboratory, ESR, New Zealand from January 2013 to June 2014.
Fig 2
Fig 2. Monthly proportion of NoV genotypes identified in Australia and New Zealand between January 2013 and June 2014.
The prevalence of NoV capsid genotypes and specific GII.4 variants within the 634 NoV-positive samples were compared for NSW and WA, Australia (panel A and B, respectively) and New Zealand (panel C). Samples with unknown GI or GII capsid genotypes as well as mixed GI and GII infection are excluded in this analysis (n = 13). The percentage of each NoV capsid genotype (Y-axis) is plotted by month (X-axis). Different genotypes and GII.4 variants are labelled according to the legends provided and plotted from the top down with increasing prevalence so the most predominant genotype is at the base of the graph.
Fig 3
Fig 3. Phylogenetic analysis of NoV GII partial capsid nucleotide (nt) sequences from Australia and New Zealand.
Neighbour-Joining phylogeny of sequences of the 5’ end of ORF2 was generated. NoV GII sequences (266-bp, nt position 5101–5366 with reference to Lordsdale virus, GenBank accession number X86557) are shown. Global NoV reference sequences (n = 78) genotype were obtained from GenBank and are labelled with the GenBank accession number in black. The detailed reference strain information and collection year are tabulated in S1 Table. Representative NoV sequences used for the phylogenetic analysis (n = 156) are labelled with red (New Zealand), blue (NSW Australia) and green (WA Australia), in the format of: Sample ID/Collection month and year/Country. Each NoV-associated outbreak is indicated with a black solid circle. The phylogeny was generated using programs within MEGA 5, with bootstrap values of ≥75 indicated as a percentage of 1000 replicates. The distance scale represents the number of nucleotide substitutions per site. AU—Australia; NZ—New Zealand.
Fig 4
Fig 4. Phylogenetic analysis of NoV GI partial capsid nucleotide (nt) sequences.
GI sequences (294 nt, nt position 5359–5652 with reference to Norwalk virus, GenBank accession number X87661) are shown in the neighbour-joining phylogeny of the 5’ end of ORF2. Global NoV reference sequences (n = 25) from GenBank are labelled in black while representative NoV sequences of this study (n = 50) are labelled in red (New Zealand), blue (NSW Australia) or green (WA Australia). Each NoV-associated outbreak is indicated with a black solid circle. The phylogeny was generated using programs within MEGA 5, with bootstrap values of ≥75 indicated as a percentage of 1000 replicates.

References

    1. Patel MM, Hall AJ, Vinje J, Parashar UD. Noroviruses: a comprehensive review. J Clin Virol. 2009;44(1):1–8. 10.1016/j.jcv.2008.10.009 - DOI - PubMed
    1. Estes MK, Prasad BV, Atmar RL. Noroviruses everywhere: has something changed? Curr Opin Infect Dis. 2006;19(5):467–74. - PubMed
    1. Hoffmann S, Batz MB, Morris JG Jr. Annual cost of illness and quality-adjusted life year losses in the United States due to 14 foodborne pathogens. J Food Prot. 2012;75(7):1292–302. 10.4315/0362-028X.JFP-11-417 - DOI - PubMed
    1. Patel MM, Widdowson MA, Glass RI, Akazawa K, Vinje J, Parashar UD. Systematic literature review of role of noroviruses in sporadic gastroenteritis. Emerg Infect Dis. 2008;14(8):1224–31. 10.3201/eid1408.071114 - DOI - PMC - PubMed
    1. Ahmed SM, Hall AJ, Robinson AE, Verhoef L, Premkumar P, Parashar UD, et al. Global prevalence of norovirus in cases of gastroenteritis: a systematic review and meta-analysis. Lancet Infect Dis. 2014;14(8):725–30. 10.1016/S1473-3099(14)70767-4 - DOI - PMC - PubMed

Publication types

MeSH terms