. 2016 Sep;12(3):248-56.
doi: 10.1007/s12024-016-9778-9. Epub 2016 Apr 27.

The radiodensity of cerebrospinal fluid and vitreous humor as indicator of the time since death

Affiliations

The radiodensity of cerebrospinal fluid and vitreous humor as indicator of the time since death

Desirée H J L M Koopmanschap et al. Forensic Sci Med Pathol. 2016 Sep.

Abstract

Purpose: After death, a series of changes occur naturally in the human body in a fairly regular pattern. These postmortem changes are detectable on postmortem CT scans (PMCT) and may be useful in estimating the postmortem interval (PMI). The purpose of our study is to correlate the PMCT radiodensities of the cerebrospinal fluid (CSF) and vitreous humor (VH) to the PMI.

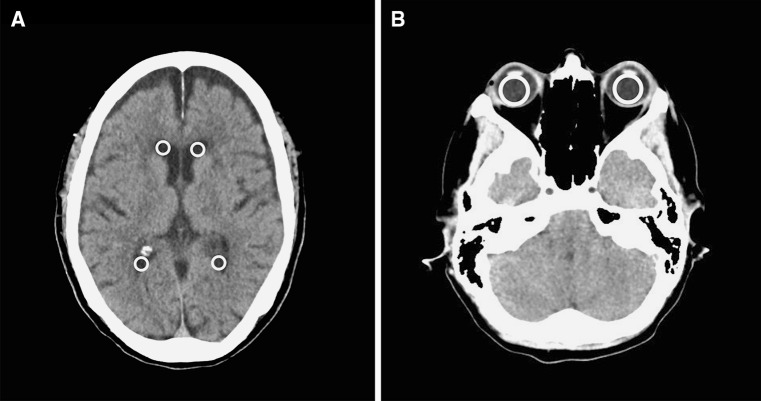
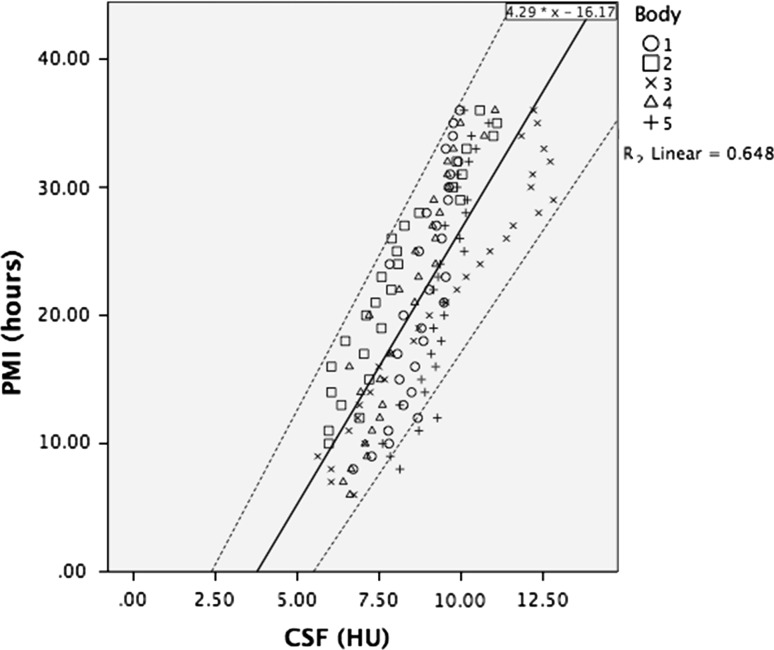
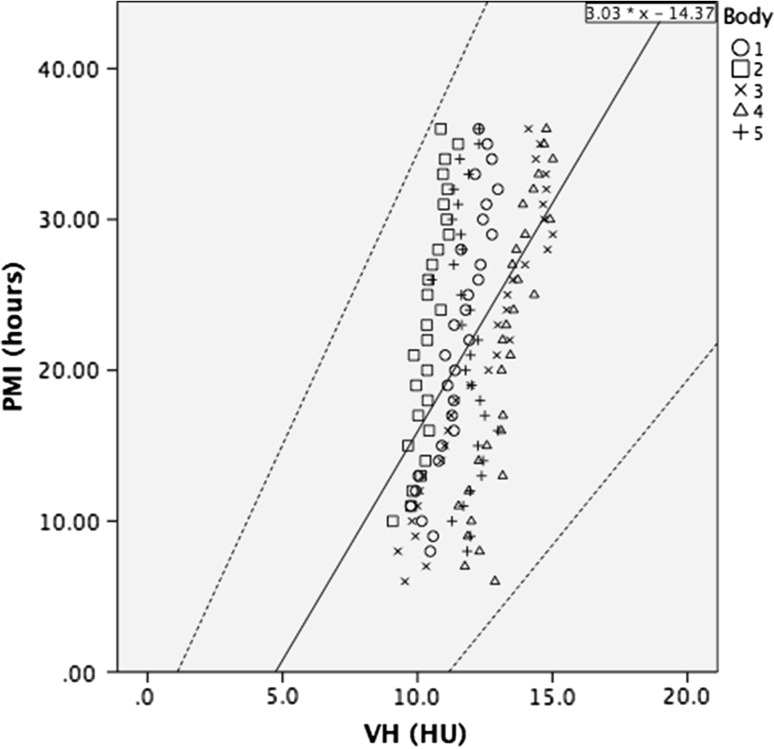
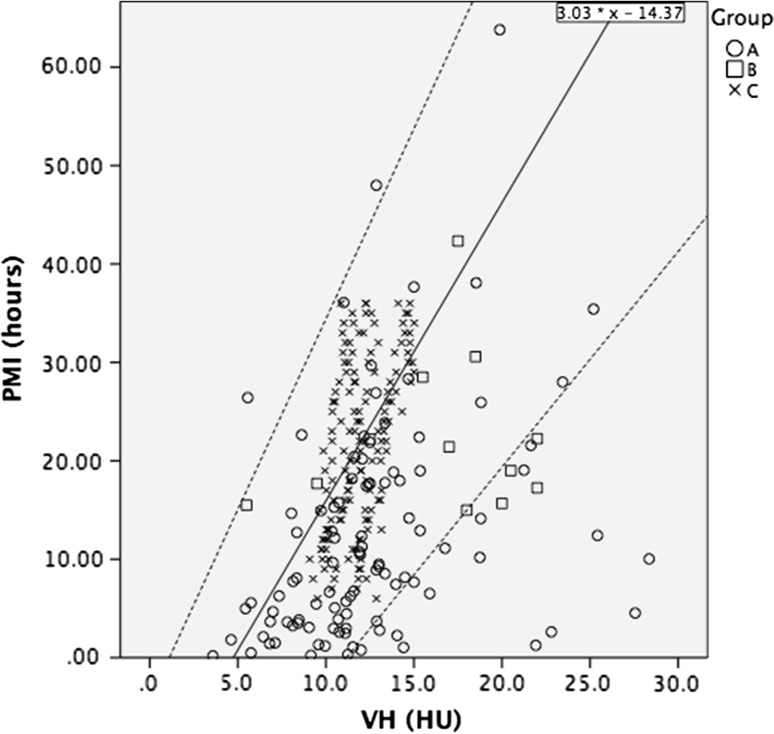
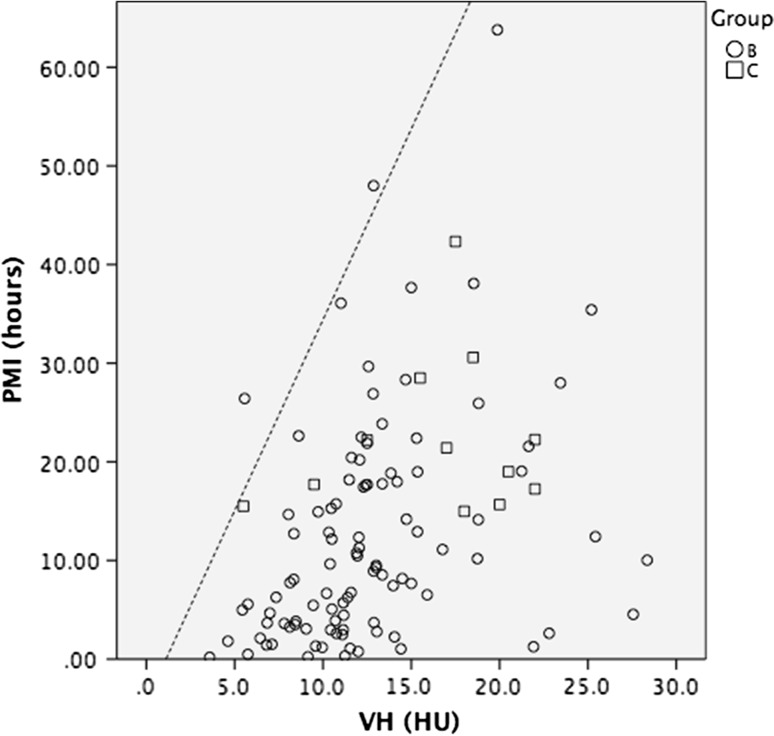
Methods: Three patient groups were included: group A consisted of 5 donated cadavers, group B, 100 in-hospital deceased patients, and group C, 12 out-of-hospital forensic cadavers. Group A were scanned every hour for a maximum of 36 h postmortem, and the tympanic temperature was measured prior to each scan. Groups B and C were scanned once after death (PMI range 0.2-63.8 h). Radiodensities of the VH and CSF were measured in Hounsfield units. Correlation between density and PMI was determined using linear regression and the influence of temperature was assessed by a multivariate regression model. Results from group A were validated in groups B and C.

Results: Group A showed increasing radiodensity of the CSF and VH over time (r (2) CSF, 0.65). PMI overruled the influence of temperature (r = 0.99 and p = 0.000). Groups B and C showed more diversity, with CSF and VH radiodensities below the mean regression line of Group A. The formula of this upper limit indicated the maximum PMI and was correct for >95 % of the cadavers.

Conclusion: The results of group A showed a significant correlation between CSF radiodensity and PMI. The radiodensities in groups B and C were higher than in group A, therefore the maximum PMI can be estimated with the upper 95 % confidence interval of the correlation line of group A.

Keywords: Cerebrospinal fluid; Postmortem computed tomography; Postmortem interval; Radiodensity; Vitreous humor.


Figures

Fig. 1
Fig. 1
The radiodensity, in Hounsfield units (HU), was determined by the mean values in the maximum fitting circular regions of interest (ROI). ROI’s were positioned in the anterior and posterior horns of the lateral region of the left and right ventricles (a) and in the vitreous humor of both eyes (b)
Fig. 2
Fig. 2
Scatterplot of the radiodensities of the CSF in the 5 donated cadavers that were scanned hourly, starting at a PMI of 6–10, to 36 h postmortem. R 2 is 0.65, which indicates a fairly accurate application of the model. The middle continuous line denotes the linear correlation line fitting the formula PMI (h) = 4.29 × HUCSF − 16.17 and the upper and lower lines denote the 95 % confidence interval
Fig. 3
Fig. 3
Scatterplot showing the CSF radiodensities of patients in groups B and C. The middle continuous line denotes the correlation line of the CSF radiodensity of group A, fitting the formula 4.29 × HUCSF − 16.17. Dashed lines denote 95 % confidence interval
Fig. 4
Fig. 4
Scatterplot showing the CSF radiodensities of patients in groups B and C. The line denotes the upper limit prediction of the CSF radiodensity of group A, corresponding to the formula 4.82 × HUCSF − 11.47, indicating estimated maximum postmortem interval
Fig. 5
Fig. 5
Scatterplot of the radiodensities of the VH in the 5 donated cadavers that were scanned hourly, up to 36 h postmortem, starting at a PMI of 6–10 h. The fixed effect regression line r 2 is 0.26, which indicates a low correlation. The middle continuous line, denotes the linear correlation line corresponding to the formula PMI (h) = 3.03 × HUVH − 14.37 and the upper and lower lines indicate the 95 % confidence interval
Fig. 6
Fig. 6
Scatterplot showing the VH radiodensities of patients in groups B and C. The middle continuous line denotes the correlation of the VH radiodensity of group A, corresponding to the formula 3.03 × HUVH − 14.37. Dashed lines indicate 95 % confidence interval
Fig. 7
Fig. 7
Scatterplot showing the VH radiodensities of patients in groups B and C. The line denotes the upper limit prediction of the CSF radiodensity of group A, corresponding to the formula 3.87 × HUVH − 4.30, indicating the estimated maximum postmortem interval

References

    1. Henssge C, Madea B. Estimation of the time since death in the early postmortem period. Forensic Sci Int. 2004;144:167–175. doi: 10.1016/j.forsciint.2004.04.051. - DOI - PubMed
    1. Christe A. Clinical radiology and postmortem imaging (virtopsy) are not the same: specific and unspecific postmortem signs. Leg Med (Tokyo) 2010;12:215–222. doi: 10.1016/j.legalmed.2010.05.005. - DOI - PubMed
    1. Levy AD. Postmortem imaging: MDCT features of postmortem change and decomposition. Am J Forensic Med Pathol. 2010;31:12–17. doi: 10.1097/PAF.0b013e3181c65e1a. - DOI - PubMed
    1. Klein WM. Normal pediatric postmortem CT appearances. Pediatr Radiol. 2015;45:517–526. doi: 10.1007/s00247-014-3258-8. - DOI - PubMed
    1. Henssge C, Knight B, Krompecher T. The estimation of the time since death in the early postmortem period. 2. London: Hodder Arnold Publishers; 2002.

LinkOut - more resources