. 2016 May 3;15(5):999-1012.
doi: 10.1016/j.celrep.2016.03.064. Epub 2016 Apr 21.

Ctip1 Regulates the Balance between Specification of Distinct Projection Neuron Subtypes in Deep Cortical Layers

Affiliations

Ctip1 Regulates the Balance between Specification of Distinct Projection Neuron Subtypes in Deep Cortical Layers

Mollie B Woodworth et al. Cell Rep. .

Abstract

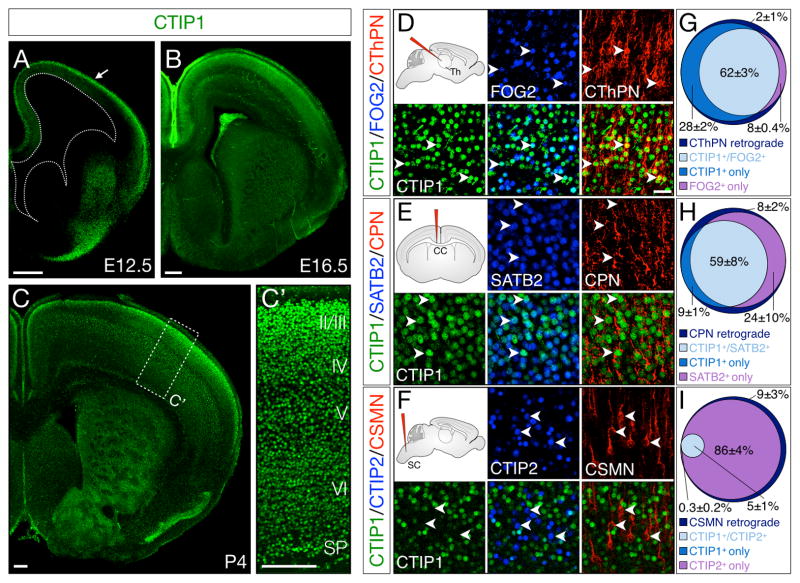
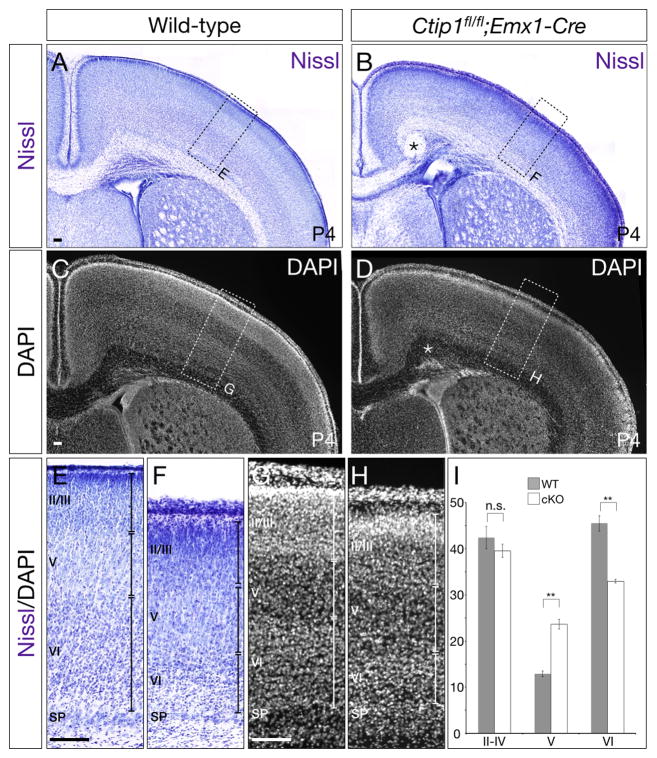
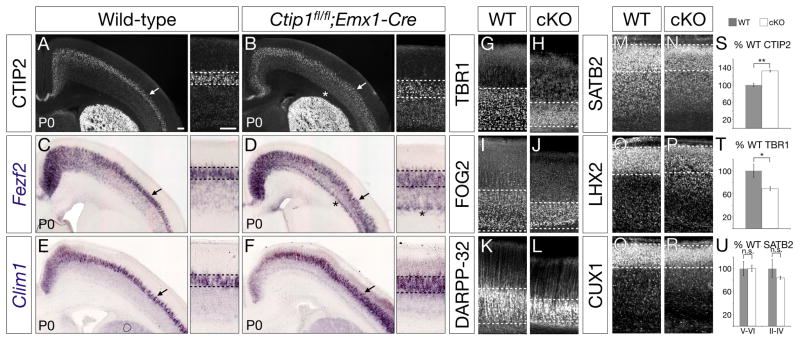
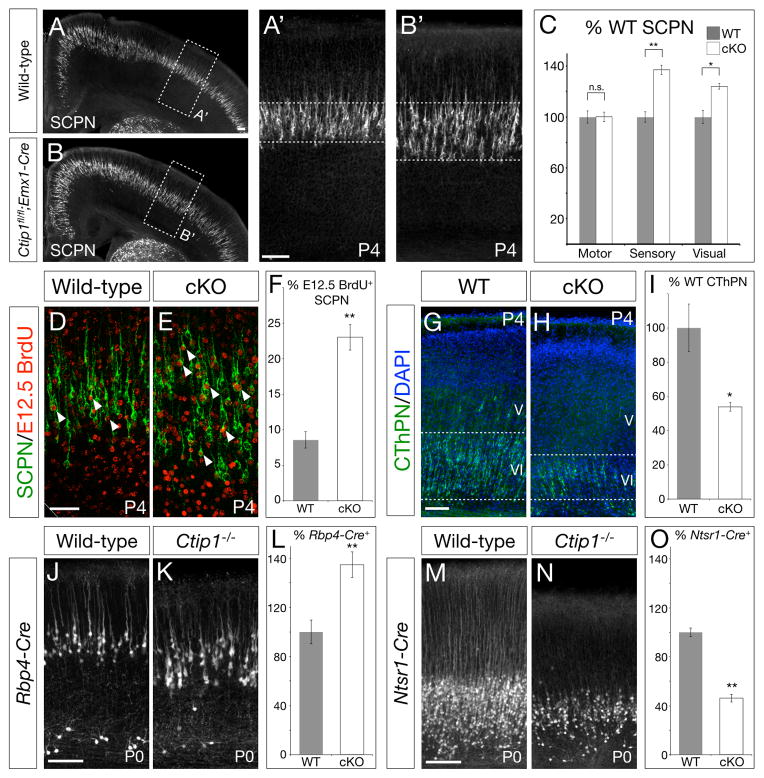
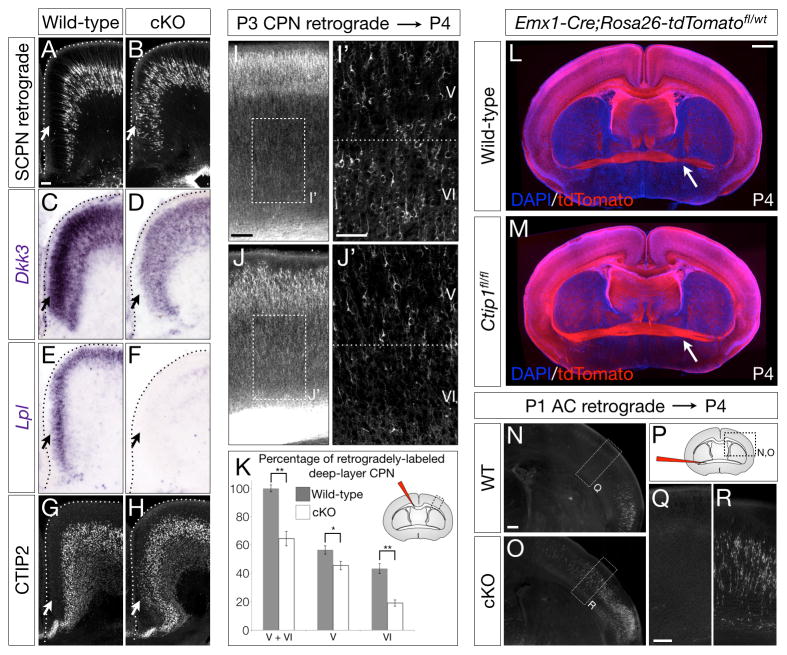
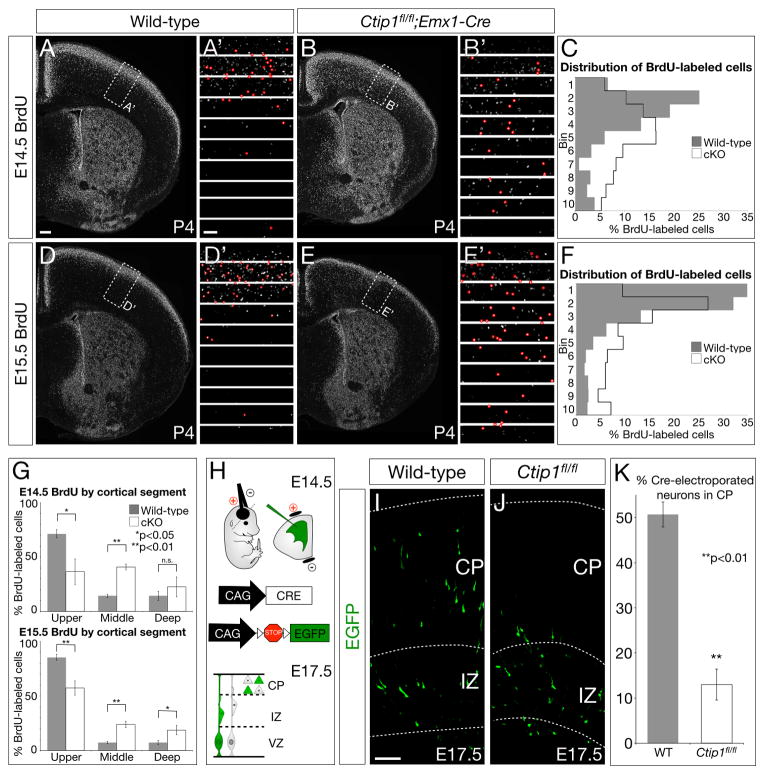
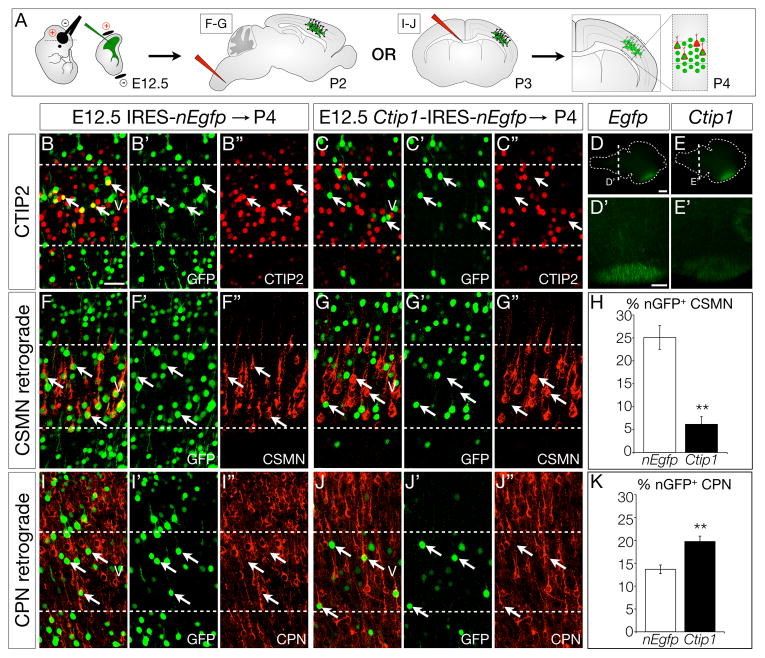
The molecular linkage between neocortical projection neuron subtype and area development, which enables the establishment of functional areas by projection neuron populations appropriate for specific sensory and motor functions, is poorly understood. Here, we report that Ctip1 controls precision of neocortical development by regulating subtype identity in deep-layer projection neurons. Ctip1 is expressed by postmitotic callosal and corticothalamic projection neurons but is excluded over embryonic development from corticospinal motor neurons, which instead express its close relative, Ctip2. Loss of Ctip1 function results in a striking bias in favor of subcerebral projection neuron development in sensory cortex at the expense of corticothalamic and deep-layer callosal development, while misexpression of Ctip1 in vivo represses subcerebral gene expression and projections. As we report in a paired paper, Ctip1 also controls acquisition of sensory area identity. Therefore, Ctip1 couples subtype and area specification, enabling specific functional areas to organize precise ratios of appropriate output projections.


Figures

Figure 1
Figure 1. Ctip1 is expressed by postmitotic corticothalamic and callosal projection neurons, but is excluded from corticospinal motor neurons
(A–C′) CTIP1 immunocytochemistry on coronal brain sections. CTIP1 is expressed by newly-postmitotic projection neurons in the cortical plate beginning around E12.5 (A, arrow) and continuing through E16.5 (B) and P4 (C). At P4, CTIP1 is expressed by neurons in all layers of primary sensory cortex (C′). (D–I) At P4, CTIP1 is expressed by CThPN and CPN, but not by CSMN. CTIP1 co-localizes with FOG2, as well as with cholera toxin B (CTB) retrograde label after injection into thalamus (D). CPN express both CTIP1 and SATB2, and are retrogradely labeled by injection of CTB into the corpus callosum (E). CSMN are retrogradely labeled by CTB injection into the cervical spinal cord, and express CTIP2, but not CTIP1 (F). Quantification, n=4 (G–I). CC, corpus callosum; CPN, callosal projection neurons; CSMN, corticospinal motor neurons; CThPN, corticothalamic projection neurons; SC, spinal cord; SP, subplate; Th, thalamus. Scale bars: 200um (A–C), 40um (D–F). Data are represented as mean ± SEM.
Figure 2
Figure 2. In the absence of neocortical Ctip1, cortical layer V is expanded at the expense of cortical layer VI
(A–H) Nissl staining and DAPI staining of cortex in wild-type (A, C) and Ctip1fl/fl;Emx1-Cre cortical conditional null (B, D) mice at P4. Layer V is expanded in conditional null cortex (F, H) compared with wild-type (E, G). Asterisk in B and D marks the location of a Probst bundle. (I) Quantification of layer thickness performed on Nissl-stained tissue, with each layer presented as a percentage of total cortical thickness (n=5). Scale bars: 100um. Data are represented as mean ± SEM.
Figure 3
Figure 3. More neurons in Ctip1fl/fl;Emx1-Cre cortex adopt a subcerebral projection neuron identity, and fewer adopt a corticothalamic projection neuron identity
(A–F) In the absence of Ctip1 function, expression of SCPN marker and control genes CTIP2, Fezf2, and Clim1 increases at P0, especially in somatosensory cortex (arrows in A–F). Dashed lines denote superficial and deep limits of gene expression. (G–L) In tandem, expression of CThPN marker and control genes TBR1, FOG2, and DARPP-32 is reduced at P0. Dashed lines denote superficial and deep limits of gene expression. Even layer VI neurons that continue to express CThPN identity genes (H, J, L) express aberrantly high levels of CTIP2 and Fezf2 (asterisks in B, D), suggesting mixed CThPN/SCPN identity. (M–R) CPN marker and control genes SATB2, LHX2, and CUX1 are expressed normally at P0, although boundaries between superficial and deep layers are more difficult to discern. Dashed lines denote superficial and deep limits of gene expression. (S–U) Quantification of the number of neurons expressing CTIP2 (S), TBR1 (T), and SATB2 (U) in conditional null cortex, presented as a percentage of wild-type neurons, n=3 for each marker. *, p<0.05; **, p<0.01; n.s., not significant Scale bars: 100um. Data are represented as mean ± SEM.
Figure 4
Figure 4. More neurons in Ctip1fl/fl;Emx1-Cre somatosensory and visual cortex project toward subcerebral targets, and fewer project toward thalamic targets
(A–B) More neurons in Ctip1 conditional null somatosensory cortex (B, B′) are retrogradely labeled by injection of cholera toxin B (CTB) into the cerebral peduncle than in wild-type cortex (A, A′). (C) Quantification of retrogradely-labeled SCPN by area, presented as a percentage of wild-type SCPN in each area, n=3. (D–F) Additional SCPN in Ctip1fl/fl;Emx1-Cre brains are aberrantly differentiated from E12.5-born neurons. More neurons labeled by injection of BrdU at E12.5 are co-labeled by injection of CTB into the cerebral peduncle in conditional null cortex (E) compared with wild-type cortex (D). Arrowheads mark representative co-labeled neurons. Quantification, n=4 (F). (G–I) Compared with wild-type (G), fewer CThPN are retrogradely labeled in somatosensory cortex of Ctip1fl/fl;Emx1-Cre mutants (H) following CTB injection into sensory thalamic nuclei. Quantification (I). (J–O) Ctip1 null cortex contains more mature SCPN and fewer mature CThPN than wild-type. More neurons are marked by SCPN-specific Rbp4-Cre in Ctip1−/− P0 cortex (K) compared with wild-type (J) (n=4). In contrast, fewer neurons are marked by CThPN-specific Ntsr1-Cre in null P0 cortex (N) compared with wild-type (M) (n=3). Quantification (L, O). Recombination by Rbp4-Cre and Ntsr1-Cre is reported by a Rosa26R-tdTomatofl allele. n.s., not significant; *, p<0.05; **, p<0.01 Scale bars: 100um (A–B, G–H, J–K, M–N), 50um (D–E). Data are represented as mean ± SEM.
Figure 5
Figure 5. Cingulate CPN fail to pioneer the callosum in the absence of Ctip1 function, impairing projections of deep-layer CPN
(A–H) Superficial-layer neurons in Ctip1fl/fl;Emx1-Cre cingulate cortex aberrantly project through the cerebral peduncle (A–B), fail to express cingulate CPN genes Dkk3 (C–D) and Lpl (E–F), and instead express CTIP2 (G–H). (I–K) Failure of cingulate CPN to pioneer the corpus callosum results in a reduction of retrogradely-labeled deep-layer CPN in Ctip1fl/fl;Emx1-Cre cortex. Fewer CPN are retrogradely labeled in P4 Ctip1fl/fl;Emx1-Cre layers V and VI (J-J′) compared with wild-type (I–I′). Quantification of I–J as a percentage of wild-type deep-layer CPN, n=3 (K). Layer VI CPN are more severely affected than layer V CPN. Schematic of injection site, upper right corner. (L–R) More neurons in Ctip1 conditional null brains aberrantly project to the contralateral hemisphere via the anterior commissure pathway. The anterior commissure is abnormally enlarged in P4 Ctip1fl/fl;Rosa26R-tdTomatofl/wt;Emx1-Cre brains (arrow in M) compared with Ctip1wt/wt;Rosa26R-tdTomatofl/wt;Emx1-Cre (wild-type) (arrow in L). Retrograde labeling from the contralateral hemisphere at P1 reveals that additional AC-projecting neurons in Ctip1 conditional null brains are aberrantly located in somatosensory cortex, an area where AC-projecting neurons are not normally located (N–O, Q–R). Schematic of injection site (P). *, p<0.05; **, p<0.01 Scale bars: 100um (A–J), 50um (I′–J′), 500um (L–M), 200um (N–R). Data are represented as mean ± SEM.
Figure 6
Figure 6. In the absence of neocortical Ctip1, superficial-layer projection neurons migrate aberrantly and become inappropriately positioned in cortex
(A–F) Wild-type neurons labeled by BrdU injection at E14.5 (A–A′) or E15.5 (D–D′) are primarily located in superficial layers, while Ctip1fl/fl;Emx1-Cre neurons labeled by BrdU at E14.5 (B–B′) or E15.5 (E–E′) are frequently ectopically located in deep layers. The overall laminar distribution of labeled neurons (marked in red in A′–B′, D′–E′) is strikingly abnormal (C, F). Bin 1 is the most superficial bin, and Bin 10 is the deepest. (G) Quantification of A–F, with bins 1–4 grouped as “upper” cortical segment, 5–7 as “middle”, and 8–10 as “deep”. (H–K) Sparse electroporation of Cre at E14.5 causes Ctip1fl/fl neurons to be delayed in the intermediate zone rather than migrate into the cortical plate at E17.5. Schematic of experimental approach (H). Wild-type neurons electroporated with Cre (I) are significantly more likely than electroporated Ctip1fl/fl neurons (J) to have migrated into the cortical plate by E17.5 (quantification, K). CP, cortical plate; IZ, intermediate zone; VZ, ventricular zone; *, p<0.05; **, p<0.01 Scale bars: 200um (A–B, D–E), 50um (A′–B′, C′–D′, I–J). Data are represented as mean ± SEM.
Figure 7
Figure 7. CTIP1 misexpression in vivo represses SCPN identity and projection to the spinal cord
(A) Schematic of experimental approach. Wild-type embryos were electroporated at E12.5, and retrograde labeling from spinal cord (F–G) or from the contralateral cortical hemisphere (I–J) was performed on electroporated pups at P2 or P3, respectively. Brains were collected at P4 and somatosensory cortex was imaged and analyzed. (B–C) Many neurons electroporated with control nuclear Egfp (nEgfp) at E12.5 express CTIP2 (B–B″; 39%), while few neurons electroporated with Ctip1-IRES-nEgfp express CTIP2 (C–C″; 7%), n = 3. (D–K) Misexpression of Ctip1 causes E12.5-born neurons to redirect their axons away from the brainstem and spinal cord, toward targets on the contralateral cortical hemisphere. Neurons electroporated with Ctip1-IRES-Egfp at E12.5 send few axons to the brainstem (wholemount electroporated brains in D–E, coronal brainstem sections in D′–E′). Fewer neurons electroporated at E12.5 with Ctip1-IRES-nEgfp are retrogradely labeled by spinal cord injection at P2 than those electroporated with control nEgfp (F–G; quantification in H, n = 3), while more Ctip1-electroporated neurons than control nEgfp-electroporated neurons are retrogradely labeled by injection into the corpus callosum (I–J; quantification in K, n = 3). **, p<0.01 Scale bars: 50um (B–C, F–G, I–J), 1mm (D–E), 100um (D′–E′). Data are represented as mean ± SEM.

References

    1. Alcamo EA, Chirivella L, Dautzenberg M, Dobreva G, Fariñas I, Grosschedl R, McConnell SK. Satb2 regulates callosal projection neuron identity in the developing cerebral cortex. Neuron. 2008;57:364–377. - PubMed
    1. Arlotta P, Molyneaux BJ, Chen J, Inoue J, Kominami R, Macklis JD. Neuronal subtype-specific genes that control corticospinal motor neuron development in vivo. Neuron. 2005;45:207–221. - PubMed
    1. Arlotta P, Molyneaux BJ, Jabaudon D, Yoshida Y, Macklis JD. Ctip2 controls the differentiation of medium spiny neurons and the establishment of the cellular architecture of the striatum. J Neurosci. 2008;28:622–632. - PMC - PubMed
    1. Avram D, Fields A, Pretty On Top K, Nevrivy DJ, Ishmael JE, Leid M. Isolation of a novel family of C(2)H(2) zinc finger proteins implicated in transcriptional repression mediated by chicken ovalbumin upstream promoter transcription factor (COUP-TF) orphan nuclear receptors. J Biol Chem. 2000;275:10315–10322. - PMC - PubMed
    1. Azim E, Shnider SJ, Cederquist GY, Sohur US, Macklis JD. Lmo4 and Clim1 progressively delineate cortical projection neuron subtypes during development. Cereb Cortex. 2009;19(Suppl 1):i62–i69. - PMC - PubMed

Publication types

LinkOut - more resources