. 2016 May 3;15(5):1024-1036.
doi: 10.1016/j.celrep.2016.03.090. Epub 2016 Apr 21.

Dysregulation of miRNA-9 in a Subset of Schizophrenia Patient-Derived Neural Progenitor Cells

Affiliations

Dysregulation of miRNA-9 in a Subset of Schizophrenia Patient-Derived Neural Progenitor Cells

Aaron Topol et al. Cell Rep. .

Erratum in

  • Dysregulation of miRNA-9 in a Subset of Schizophrenia Patient-Derived Neural Progenitor Cells.
    Topol A, Zhu S, Hartley BJ, English J, Hauberg ME, Tran N, Rittenhouse CA, Simone A, Ruderfer DM, Johnson J, Readhead B, Hadas Y, Gochman PA, Wang YC, Shah H, Cagney G, Rapoport J, Gage FH, Dudley JT, Sklar P, Mattheisen M, Cotter D, Fang G, Brennand KJ. Topol A, et al. Cell Rep. 2017 Sep 5;20(10):2525. doi: 10.1016/j.celrep.2017.08.073. Cell Rep. 2017. PMID: 28877483 Free PMC article. No abstract available.

Abstract

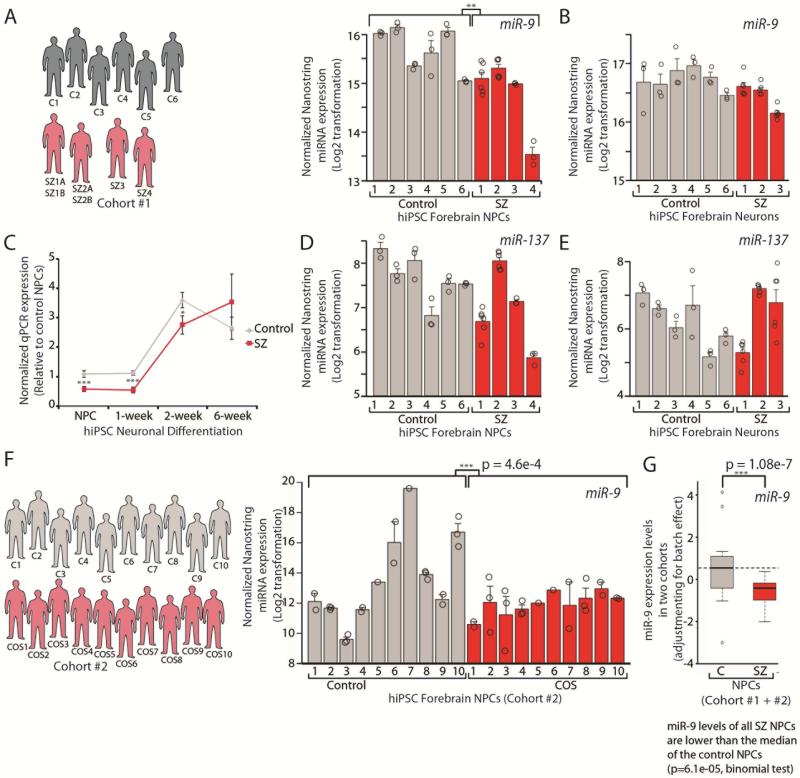
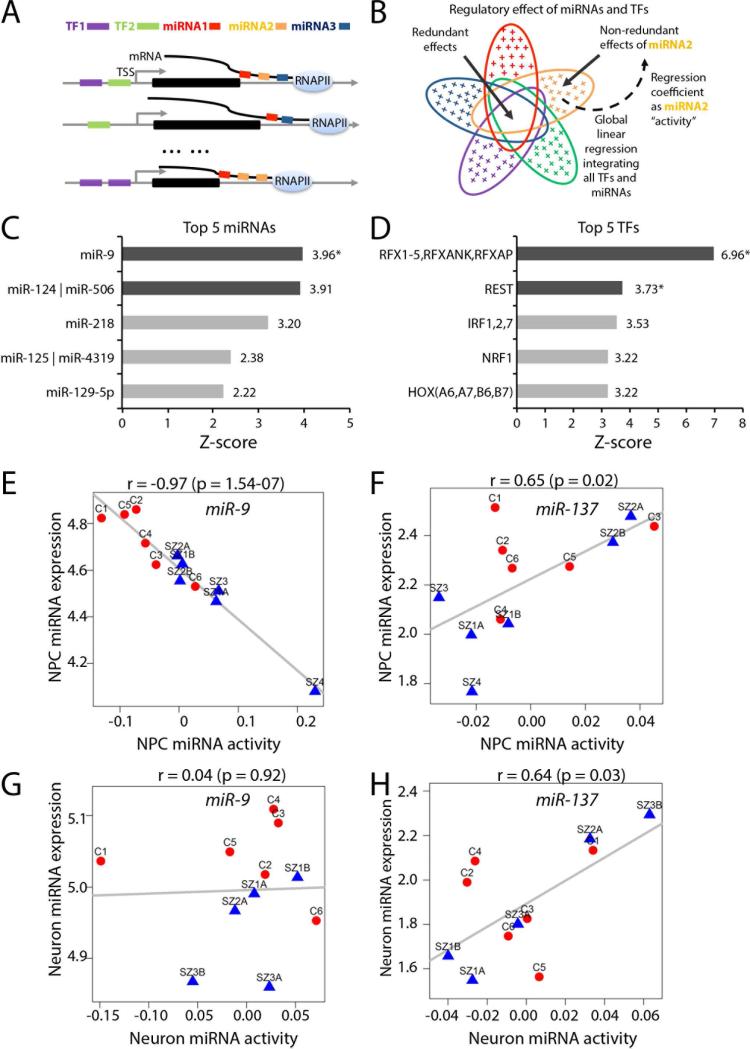
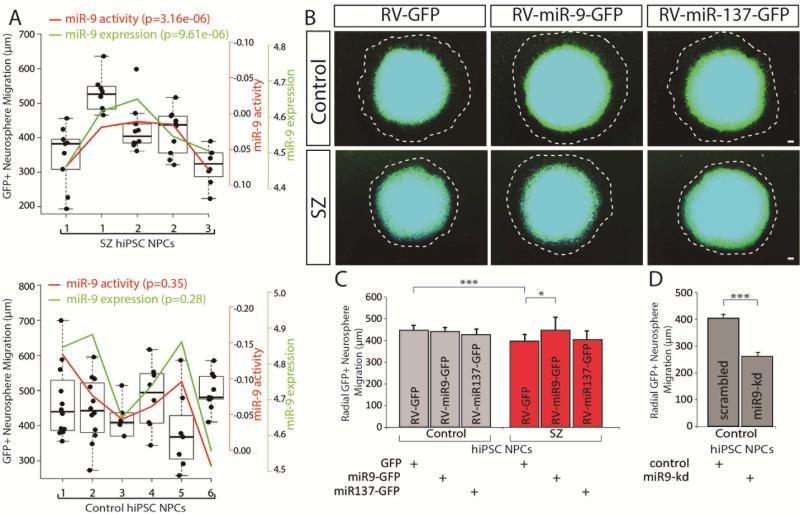
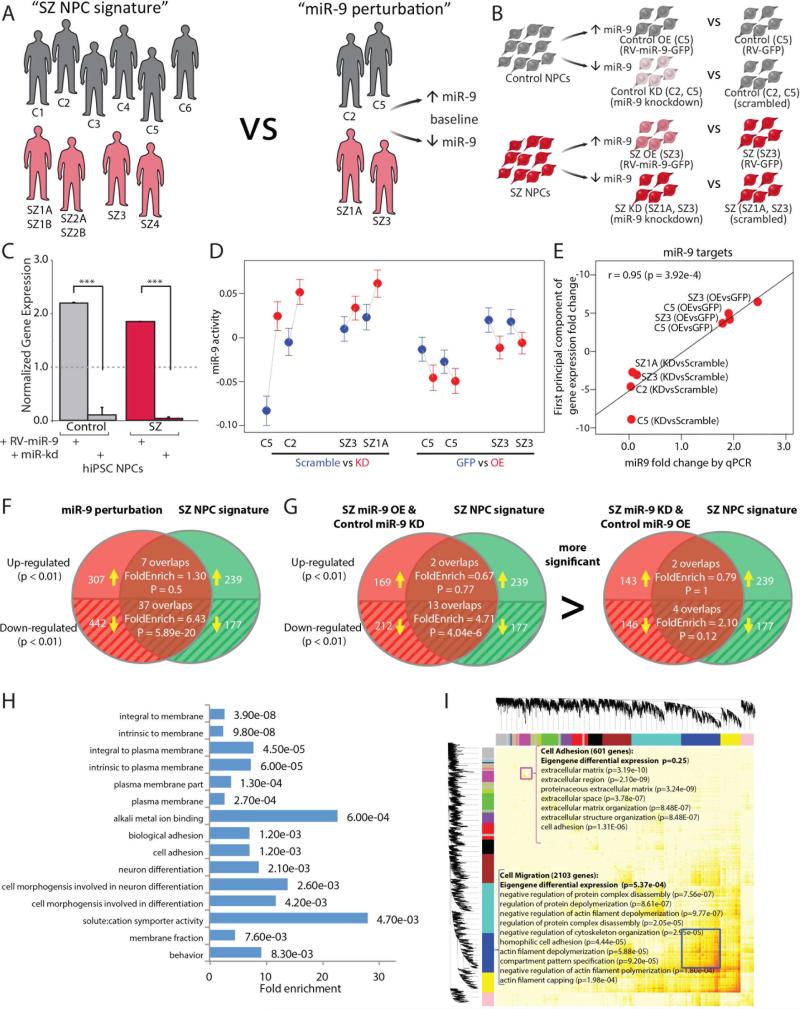
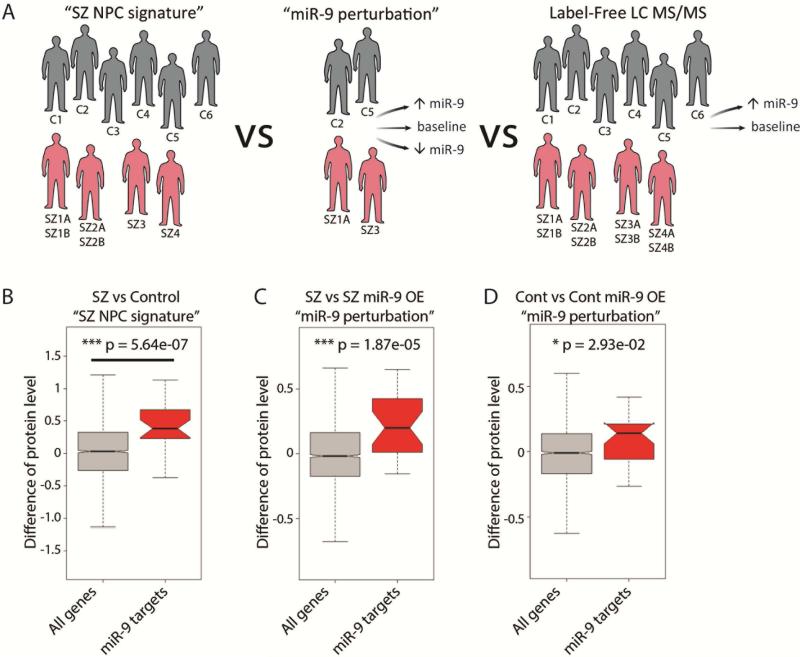
Converging evidence indicates that microRNAs (miRNAs) may contribute to disease risk for schizophrenia (SZ). We show that microRNA-9 (miR-9) is abundantly expressed in control neural progenitor cells (NPCs) but also significantly downregulated in a subset of SZ NPCs. We observed a strong correlation between miR-9 expression and miR-9 regulatory activity in NPCs as well as between miR-9 levels/activity, neural migration, and diagnosis. Overexpression of miR-9 was sufficient to ameliorate a previously reported neural migration deficit in SZ NPCs, whereas knockdown partially phenocopied aberrant migration in control NPCs. Unexpectedly, proteomic- and RNA sequencing (RNA-seq)-based analysis revealed that these effects were mediated primarily by small changes in expression of indirect miR-9 targets rather than large changes in direct miR-9 targets; these indirect targets are enriched for migration-associated genes. Together, these data indicate that aberrant levels and activity of miR-9 may be one of the many factors that contribute to SZ risk, at least in a subset of patients.

Keywords: human-induced pluripotent stem cell; microRNA-9; neural progenitor cells; schizophrenia.


Figures

Fig. 1
Fig. 1. Decreased miR-9 levels occur in SZ NPCs but not SZ hiPSC forebrain neurons
A,B,D,E. Nanostring nCounter analysis of normalized miR-9 (A,B) and miR-137 (D,E) expression levels in SZ NPCs (A,D) and neurons (B,E). Values from independent replicates of the same NPC line for all individuals are indicated by circles (as well as from two independent NPC lines from SZ1,2 (A,D) and two independent NPC lines from SZ1,2,3 (B,E)). C. qPCR validation of normalized miR-9 expression during the differentiation of SZ NPCs into 1-, 2- and 6-week-old neurons. F. Nanostring nCounter analysis of normalized miR-9 expression levels in NPCs from ten COS patients and ten unrelated controls. Values from biological replicates of NPC lines differentiated from independent hiPSC clones are indicated by circles (C1,2,3,4,8,9,10; COS1,2,3,5,6,7,8,10) as well as independent replicates from the same NPC lines (C2,3,9; COS2,3,4,8). G. Samples from two SZ hiPSC cohorts were combined after adjusting for the batch effect with linear regression, where average miR-9 expression level was calculated for each sample. Error bars are s.e., *P < 0.05, **P < 0.01, ***P < 0.001.
Fig. 2
Fig. 2. A global integrative model identified miRNA and transcription factor (TF) candidates for regulating gene expression changes between SZ and control NPCs
A. An illustrative example of regulatory relationships between five regulators (two TFs and three miRNAs, color coded) and three genes. The expression of each gene can be regulated by one or multiple miRNAs and TFs. B. Linear regression is used to model global regulatory relationships between all TFs and miRNAs and genome-wide mRNA expression and to predict change of activity (importance) of each miRNA and TF, conditional on all the other regulators to remove redundant effects, as illustrated for miRNA2. The color codes for miRNAs and TFs are consistent with (A). An ellipse denotes the downstream regulatory effect of a miRNA or a TF. The blank overlapping region denotes the redundant effect shared among miRNAs and TFs; the colored crosses in each ellipse represent the non-redundant regulatory effect for the corresponding miRNA or TF. Each regression coefficient reflects the importance (change of activity) of an miRNA or a TF between SZ and controls NPCs. C-D. Top five miRNAs (C) and top five TFs (D) with change of activities predicted by the model. The dark gray bars mark miRNAs/TFs with Bonferroni corrected p-value <0.05; the stars mark the miRNAs/TFs whose change of activities are also significantly correlated with their expression. E-F. Scatter plots showing relationship between expression and predicted change of activities for miRNA-9 (E) and miR-137 (F) in control and SZ NPCs. G-H. Scatter plots show no relationship between expression and predicted change of activities for miRNA-9 (G) and miR-137 (H) in control and SZ hiPSC neurons.
Fig. 3
Fig. 3. Aberrant migration in SZ NPCs rescued by restoration of miR-9 levels
A. Correlation between miR-9 level (both endogenous expression and regulatory activity inferred from RNAseq data) and radial neurosphere migration in control and SZ NPCs. B. Representative florescent images of hiPSC forebrain NPC neurosphere outgrowth assay, following stable transduction with RV-GFP, RV-miR-9-GFP or RV-miR137-GFP. The average distance between the radius of the inner neurosphere (dense aggregate of nuclei) and outer circumference of cells (white dashed line) was calculated. DAPI-stained nuclei (blue). Scale bar 100 m. C. Radial neurosphere migration by control and SZ NPCs, following stable transduction with RV-GFP, RV-miR-9-GFP or RV-miR137-GFP. D. Radial neurosphere migration by control and SZ NPCs, following transient reduction of miR-9 levels. Error bars are s.e., *P < 0.05, **P < 0.01, ***P < 0.001.
Fig. 4
Fig. 4. Effect of manipulating miR-9 levels on global gene expression
A. Schematic demonstrating the integration of RNAseq datasets for “SZ NPC signature” (6 controls; 4 SZ patients) with “miR-9 perturbation” (2 controls, 2 SZ patients). B. Experimental design for comparing the effects of stable miR-9 overexpression and transient miR-9 knockdown in control and SZ NPCs. C. qPCR validation of RV-miR-9 overexpression and transient miR-9 knockdown in NPCs. D. miR-9 activity for each sample in the perturbation dataset, inferred from RNAseq data. E. Correlation between miR-9 perturbation fold-change (validated by qPCR) and miR-9 target gene fold-change (first principal component; see Methods). F. Overlap between DE genes in the “miR-9 perturbation” dataset and the “SZ NPC signature” RNAseq datasets. G. Overlap between DE genes in two subsets of “miR-9 perturbation” dataset and the “SZ NPC signature” RNAseq datasets. H. DAVID Gene Ontology analysis for the genes significantly differentially expressed in the similar direction between “miR-9 perturbation” and “SZ NPC signature” datasets. I. WGCNA for the “miR-9 perturbation” RNAseq dataset identified 17 modules. Error bars are s.e., *P < 0.05, **P < 0.01, ***P < 0.001.
Fig. 5
Fig. 5. Effect of manipulating miR-9 levels on proteome
A. Schematic demonstrating integration of “SZ NPC signature” (6 controls; 4 SZ patients) with “miR-9 perturbation” (2 controls, 2 SZ patients) and “Label-free LC MS/MS” (6 controls; 4 SZ patients) B-D. Putative miR-9 targets enriched for proteomic changes in “SZ NPC signature.” The direction of changes were also consistent with the RNAseq data: significant in both comparisons of SZ/Control (B) and SZ+RV-GFP/SZ+RV-miR-9 (C), and modest significant in comparison of control+RV-GFP/control+RV-miR-9 (D).

References

    1. Balwierz PJ, Pachkov M, Arnold P, Gruber AJ, Zavolan M, van Nimwegen E. ISMARA: automated modeling of genomic signals as a democracy of regulatory motifs. Genome research. 2014;24:869–884. - PMC - PubMed
    1. Brennand K, Savas JN, Kim Y, Tran N, Simone A, Hashimoto-Torii K, Beaumont KG, Kim HJ, Topol A, Ladran I, et al. Phenotypic differences in hiPSC NPCs derived from patients with schizophrenia. Mol Psychiatry. 2015;20:361–368. - PMC - PubMed
    1. Brennand KJ, Simone A, Jou J, Gelboin-Burkhart C, Tran N, Sangar S, Li Y, Mu Y, Chen G, Yu D, et al. Modelling schizophrenia using human induced pluripotent stem cells. Nature. 2011 - PMC - PubMed
    1. Chambers SM, Fasano CA, Papapetrou EP, Tomishima M, Sadelain M, Studer L. Highly efficient neural conversion of human ES and iPS cells by dual inhibition of SMAD signaling. Nat Biotechnol. 2009;27:275–280. - PMC - PubMed
    1. Collins AL, Kim Y, Bloom RJ, Kelada SN, Sethupathy P, Sullivan PF. Transcriptional targets of the schizophrenia risk gene MIR137. Translational psychiatry. 2014;4:e404. - PMC - PubMed

Publication types