. 2016 May 3;15(5):1037-1050.
doi: 10.1016/j.celrep.2016.03.093. Epub 2016 Apr 21.

Homophilic Protocadherin Cell-Cell Interactions Promote Dendrite Complexity

Affiliations

Homophilic Protocadherin Cell-Cell Interactions Promote Dendrite Complexity

Michael J Molumby et al. Cell Rep. .

Abstract

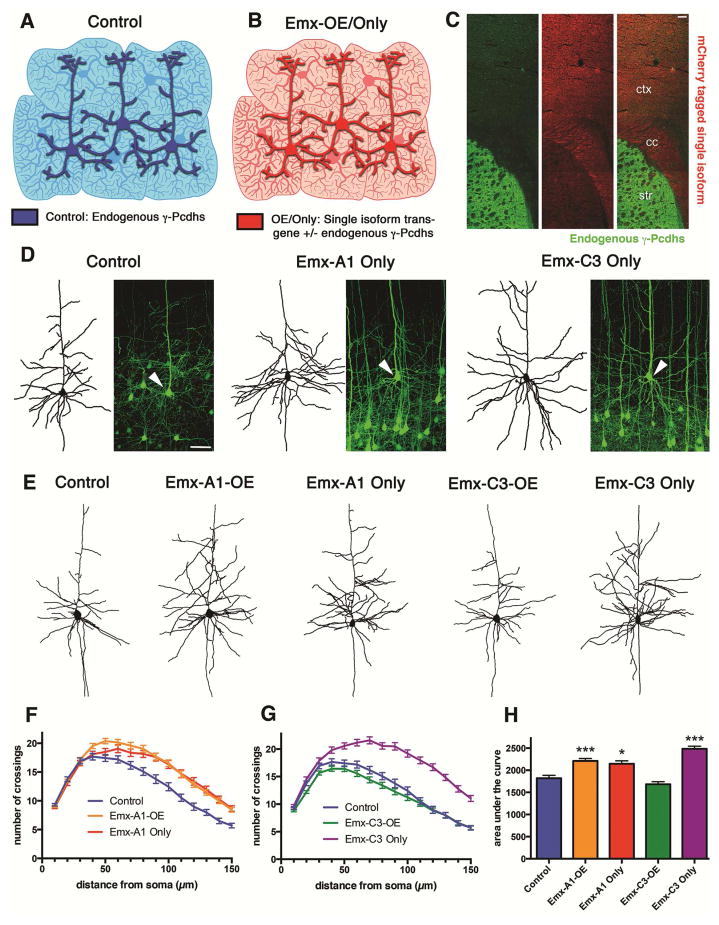
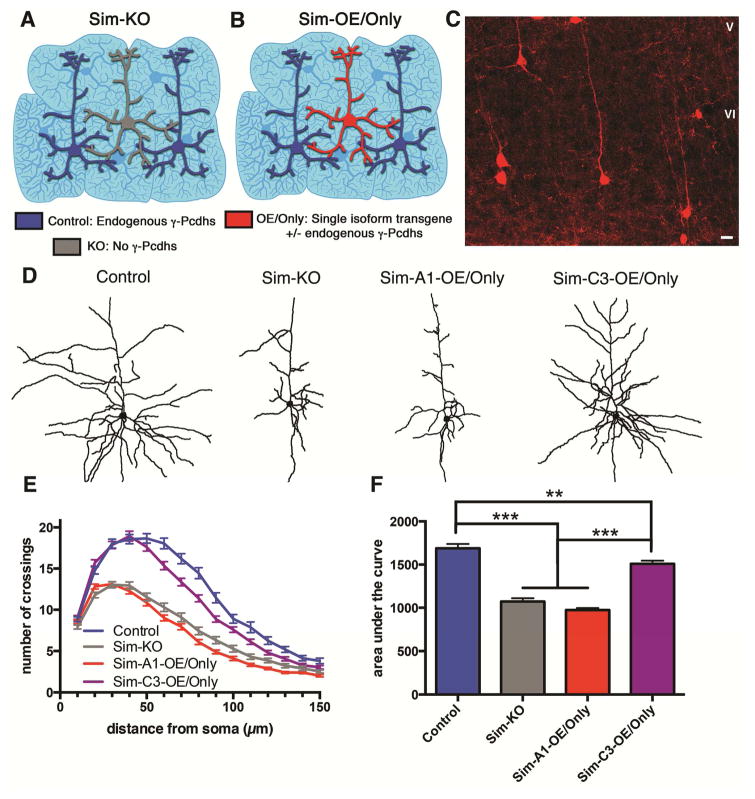
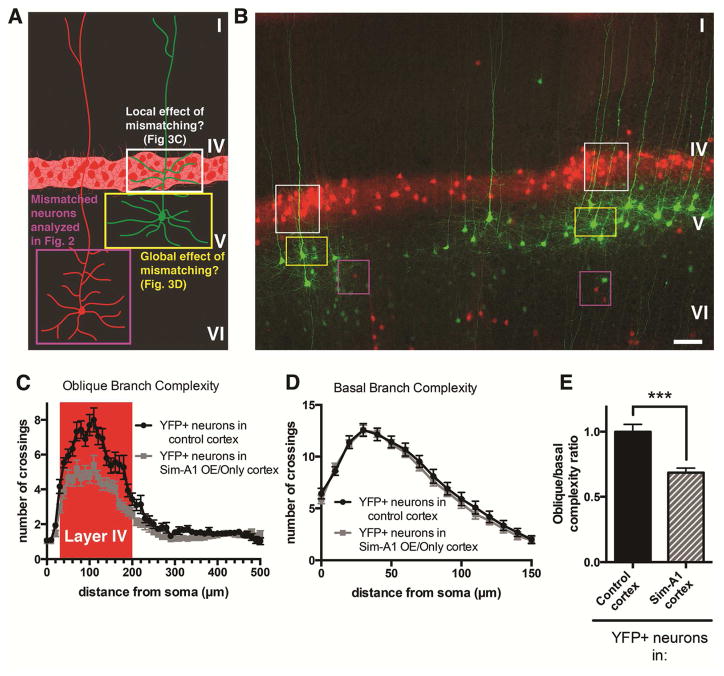
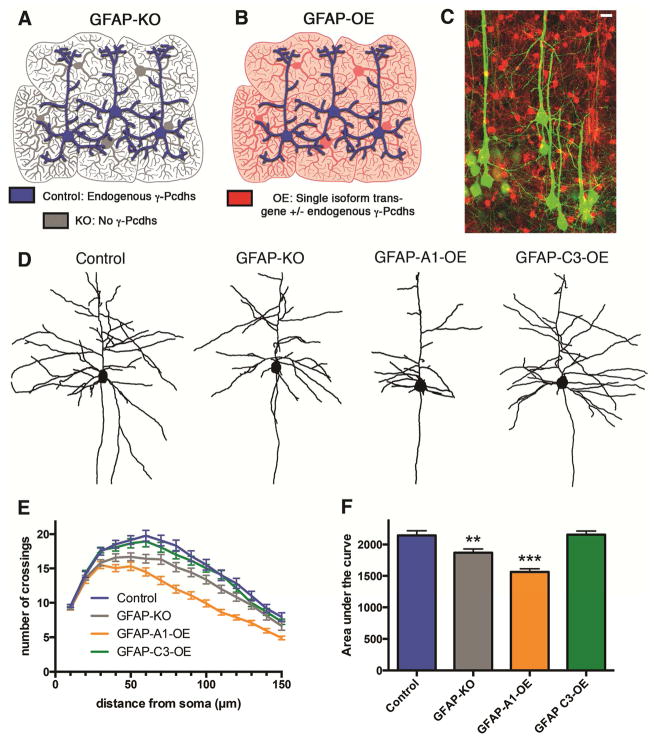
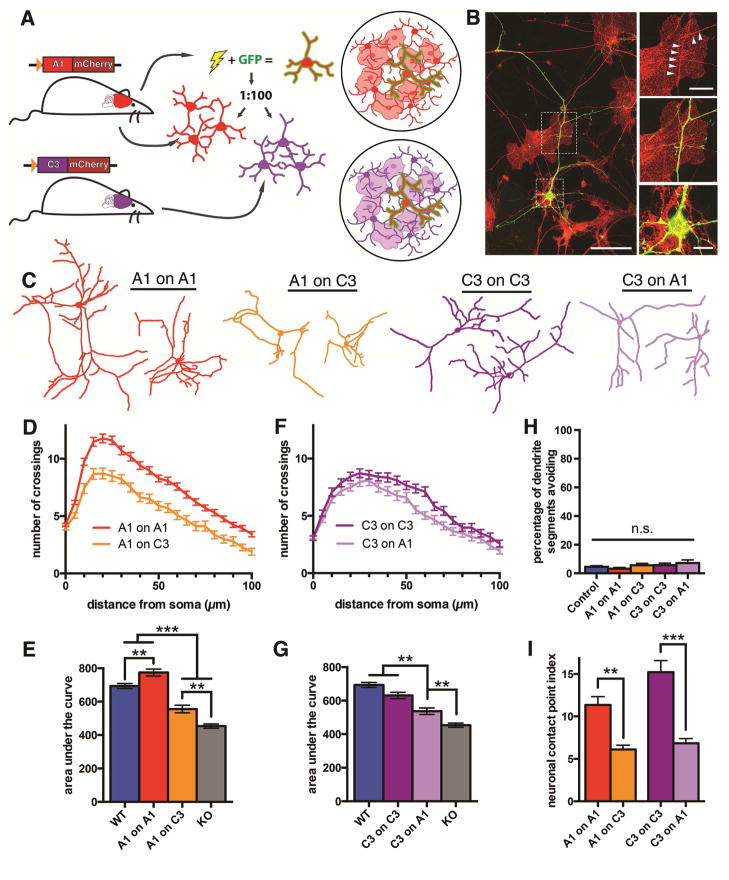
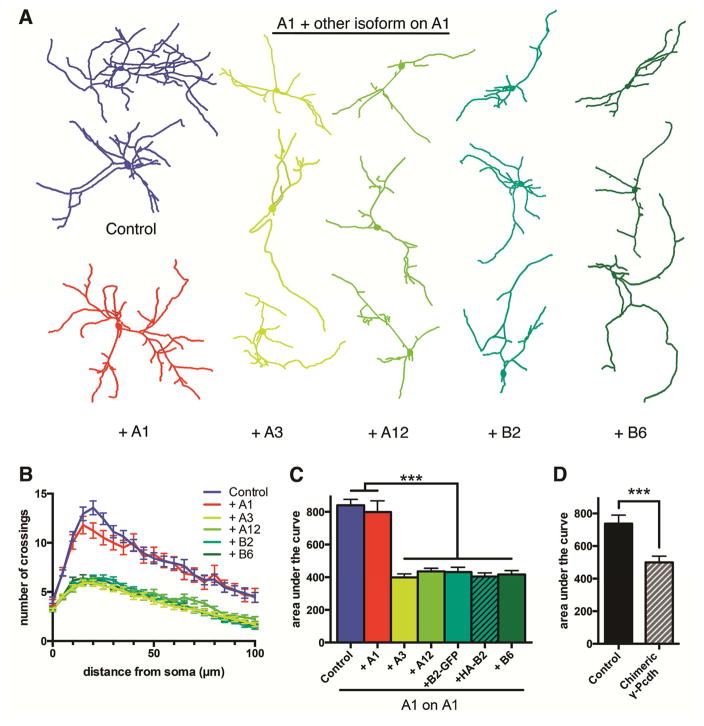
Growth of a properly complex dendrite arbor is a key step in neuronal differentiation and a prerequisite for neural circuit formation. Diverse cell surface molecules, such as the clustered protocadherins (Pcdhs), have long been proposed to regulate circuit formation through specific cell-cell interactions. Here, using transgenic and conditional knockout mice to manipulate γ-Pcdh repertoire in the cerebral cortex, we show that the complexity of a neuron's dendritic arbor is determined by homophilic interactions with other cells. Neurons expressing only one of the 22 γ-Pcdhs can exhibit either exuberant or minimal dendrite complexity, depending only on whether surrounding cells express the same isoform. Furthermore, loss of astrocytic γ-Pcdhs, or disruption of astrocyte-neuron homophilic matching, reduces dendrite complexity cell non-autonomously. Our data indicate that γ-Pcdhs act locally to promote dendrite arborization via homophilic matching, and they confirm that connectivity in vivo depends on molecular interactions between neurons and between neurons and astrocytes.


Figures

Figure 1
Figure 1. Increased homophilic γ-Pcdh matching promotes dendrite arbor complexity in the cerebral cortex
A,B) Schematics representing the cortex of controls and mice in which the A1-mCherry or C3-mCherry transgene is expressed in all primary neurons (thick lined cells) and astrocytes (thin lined cells) using Emx1-Cre. C) Cryosection from an Emx1-Cre; Pcdhgfcon3/fcon3; C3-mCherry animal showing GFP-tagged endogenous γ-Pcdhs (green, striatum [str]) and exogenous C3-mCherry (red, cortex [ctx], corpus callosum [cc]); Cre excision is limited to the cortex, and there is no leaky expression from the non-excised transgene. D,E) Representative images and traces of Thy1-YFPH-labeled layer V pyramidal neurons in the indicated genotypes; arrowheads indicate traced neurons in (D). F–H) Sholl analysis graphs showing dendrite crossings of circles drawn at 10 μm radius intervals from the soma (F,G) and area under the curve graph (H) for indicated genotypes. N=60 (control, A1-Only, C3-Only) or 120 (A1-OE, C3-OE) neurons per genotype; bar in (C)=50 μm; bar in (D)=60 μm; *p<0.05, ***p<0.001. See also Figure S1.
Figure 2
Figure 2. Inducing γ-Pcdh isoform mismatching reduces dendrite arbor complexity in the cerebral cortex
A,B) Schematics representing the cortex of mice in which endogenous γ-Pcdhs are knocked-out (grey; Sim-KO), and/or the A1-mCherry or C3-mCherry transgene is expressed (red; Sim-OE/Only) in scattered deep-layer pyramidal neurons using Sim1-Cre. C) Confocal image of isolated tdTomato+ layer V/VI neurons in a Sim1-Cre;Ai14-tdTomato cortex. D) Representative traces of tdTomato+ layer V/VI pyramidal neurons of the indicated genotypes. Sholl (E) and area under the curve (F) graphs of tdTomato+ layer V/VI pyramidal neurons of the indicated genotypes. Note that results shown here are pooled for OE and Only mice, as the results were identical [Figure S2]), N=58–60 (controls, Sim-KO), 97 (Sim-A1), or 79 (Sim-C3) neurons; Bar in C=20 μm; **p<0.01; ***p<0.001. See also Figure S2.
Figure 3
Figure 3. γ-Pcdhs control dendrite complexity through local homophilic interactions
A,B) Schematic diagram (A) and low magnification confocal image (B) of a Sim1-Cre;Thy1-YFPH;Ai14-tdTomato;A1-mCherry cortex. Regions marked by different color boxes correspond between A and B. Purple boxes mark the basal and oblique arbors of isolated tdTomato+ layer V/VI neurons, which were analyzed in Figure 2; because these neurons overexpress the A1-mCherry transgene while their surrounding cells are wildtype, their dendrites experience mis-matches that lead to greatly reduced arborization (Figure 2). Yellow boxes mark the basal arbors of YFP+ layer V neurons, which are analyzed in D. These neurons express endogenous γ-Pcdh repertoires, as do the immediately surrounding cells, so their basal arbors should exhibit normal complexity. White boxes mark the oblique arbors of YFP+ layer V neurons, which are analyzed in C (red shaded region). These oblique arbors branch off the apical shaft within layer IV, which contains a band of denser Sim1-Cre activity and thus A1-mCherry expression. These YFP+ oblique dendrites express endogenous γ-Pcdh repertoires, but locally encounter layer IV neurons overexpressing the mis-matching A1-mCherry isoform. C,D) Sholl analysis of the oblique (mis-matching; C) and basal (normal matching; D) arbors of YFP+ neurons in control (black lines) and Sim-A1-OE or Sim-A1-Only cortex (gray lines; OE and Only results are pooled here, as they were identical; see Figure S3). E) The calculated ratio of oblique/basal dendrite complexity (oblique area under the curve divided by basal area under the curve; control normalized to 1) confirms a significant localized loss of complexity only within the oblique arbor of YFP+ neurons in the Sim-A1 cortex. N=28 YFP+ neurons per genotype; Bar=100 μm; ***p<0.001.
Figure 4
Figure 4. Astrocytic γ-Pcdhs regulate dendrite arborization cell non-autonomously in the cerebral cortex
A,B) Schematics representing neurons and astrocytes in the indicated genotypes, as in previous figures. C) Maximum projection of a confocal stack through the cortex of a Gfap-Cre;Thy1-YFPH;Ai-14-tdTomato mouse, demonstrating astrocyte-restricted excision mediated by the 77.6 Cre line. D–F) Representative traces (D), Sholl analysis (E) and area under the curve graph (F) of Thy1-YFPH+ layer V pyramidal neurons of the indicated genotypes. Bar in (C)=20 μm; N=60 neurons per genotype; **p <0.01. See also Figure S4.
Figure 5
Figure 5. Dendrite arborization can be increased or decreased by manipulating γ-Pcdh homophilic matching between a neuron and its environment in vitro
A) Schematic of the neuronal co-culture assay: neonatal cortical cells from one transgenic mouse (red) are nucleofected with a plasmid encoding GFP, diluted at a 1:100 ratio with cells from another cortex expressing the same (red, top dish) or a different (purple) single-isoform transgene. B) Image of a nucleofected GFP+/mCherry+ neuron growing on GFP−/mCherry+ astrocytes in an “A1-Only on A1-Only” (perfectly matching) culture. A1-mCherry protein is concentrated at sites of contact (arrowheads), suggesting the formation of a homophilic trans-interaction complex at the cell surface. C) Representative traces of GFP+ nucleofected neurons in matching “A1 on A1” or “C3 on C3” cultures and mis-matching “A1 on C3” or “C3 on A1” cultures. Sholl (D,F) and area under the curve (E,G) graphs showing that dendrite arbor complexity is significantly higher in neurons growing in homophilically-matching co-cultures (“A1 on A1” or “C3 on C3”) than in those growing in mis-matching co-cultures (“A1 on C3” or “C3 on A1”; all results shown here are OE; OE vs. Only results shown in Figure S5). Additionally, comparison to similarly generated wildtype (WT) cultures corroborates the in vivo results shown in Figures 1, 2 and 4: “A1 on A1” OE (E) neurons exhibit significantly greater arborization than control neurons, while “C3 on C3” OE neurons do not (G). C3-Only on C3-Only neurons, again as in vivo, exhibit significantly greater arborization than do C3-OE on C3-OE neurons (Figure S5). H) Relationship of dendrites to astrocytes was quantified in fixed cultures. Each instance where a dendrite appeared to contact only the edge of an astrocyte, or to have turned to grow away from an astrocyte was counted, and this number divided by the total number of dendrite/astrocyte contacts to obtain the percentage of dendrite segments “avoiding” astrocytes(H). I) An index measuring neuron-neuron contact points was calculated by counting the number of intersections between GFP+ nucleofected dendrites and other surrounding MAP2+ dendrites, normalizing to total dendrite area and multiplying by a constant. N=57–60 (A1/C3 on A1/C3 and WT), 180 (KO), or 30–36 (avoidance and contact point index) neurons per condition; Bars in (B)=50 μm (left), 15 μm (upper, middle right), or 10 μm (lower right). **p<0.01; ***p<0.001. See also Figure S5.
Figure 6
Figure 6. Disrupting γ-Pcdh homophilic interactions by overexpressing a single mis-matching isoform reduces dendrite arborization
Neurons in “A1 on A1” homophilically matching co-cultures were lipofected at low efficiency (1–5%) with a plasmid expressing GFP alone (Control) or in addition to a plasmid encoding one of several γ-Pcdh isoforms with a C-terminal GFP tag: γ-Pcdh-A1, -A3, -A12, -B2, or –B6 (an N-terminally HA-tagged γ-Pcdh-B2 plasmid was also used to control for effects of the GFP tag). A) Representative neuronal traces in each transfection condition. B) Sholl analysis and C) area under the curve graphs. Addition of a single non-matching γ-Pcdh isoform to a neuron growing in an otherwise homophilically-matching co-culture (“A1 on A1”) is sufficient to reduce arborization to KO levels (c.f. Figure 5E,G). D) Introducing a chimeric γ-Pcdh isoform that can interact with itself but not with any endogenous γ-Pcdh isoform into wildtype neurons also significantly reduced dendrite arborization (measured by Sholl analysis at 8 days in vitro; area under the curve shown) compared to control neurons. N=80–105 (+additional isoform) or 30 (+chimera) neurons. ***p<0.001.

References

    1. Balthasar N, Dalgaard LT, Lee CE, Yu J, Funahashi H, Williams T, Ferreira M, Tang V, McGovern RA, Kenny CD, et al. Divergence of melanocortin pathways in the control of food intake and energy expenditure. Cell. 2005;123:493–505. - PubMed
    1. Chen J, Lu Y, Meng S, Han MH, Lin C, Wang X. alpha- and gamma-Protocadherins negatively regulate PYK2. J Biol Chem. 2009;284:2880. - PMC - PubMed
    1. Clarke LE, Barres BA. Emerging roles of astrocytes in neural circuit development. Nat Rev Neurosci. 2013;14:311–321. - PMC - PubMed
    1. Dickson BJ. Molecular mechanisms of axon guidance. Science. 2002;298:1959–1964. - PubMed
    1. Duan X, Krishnaswamy A, De la Huerta I, Sanes JR. Type II cadherins guide assembly of a direction-selective retinal circuit. Cell. 2014;158:793–807. - PubMed

Publication types