. 2016 Apr 27:7:11275.
doi: 10.1038/ncomms11275.

Epigenetic profiles signify cell fate plasticity in unipotent spermatogonial stem and progenitor cells

Affiliations

Epigenetic profiles signify cell fate plasticity in unipotent spermatogonial stem and progenitor cells

Ying Liu et al. Nat Commun. .

Abstract

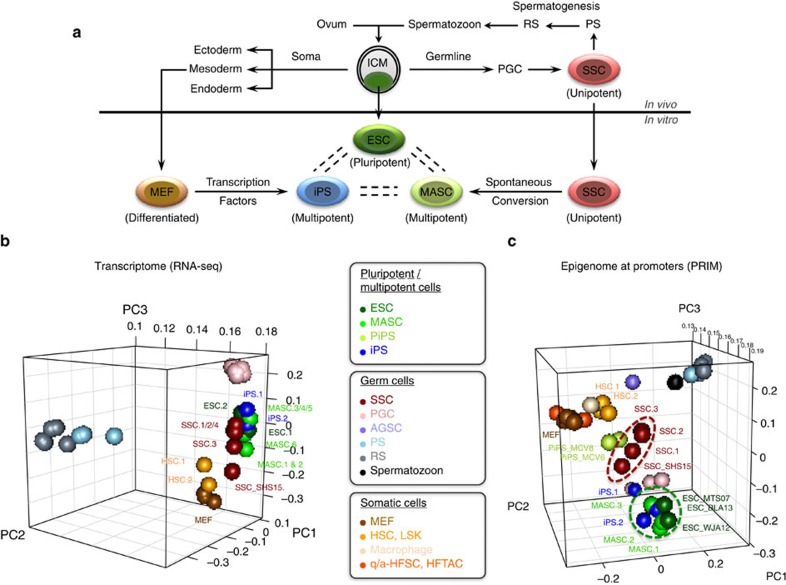
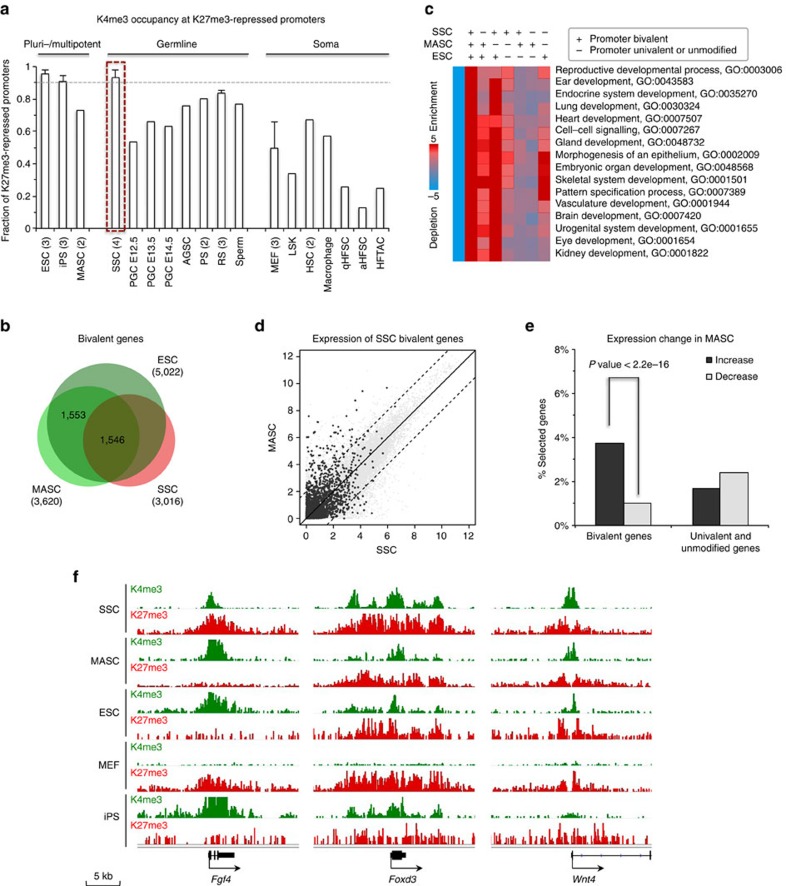
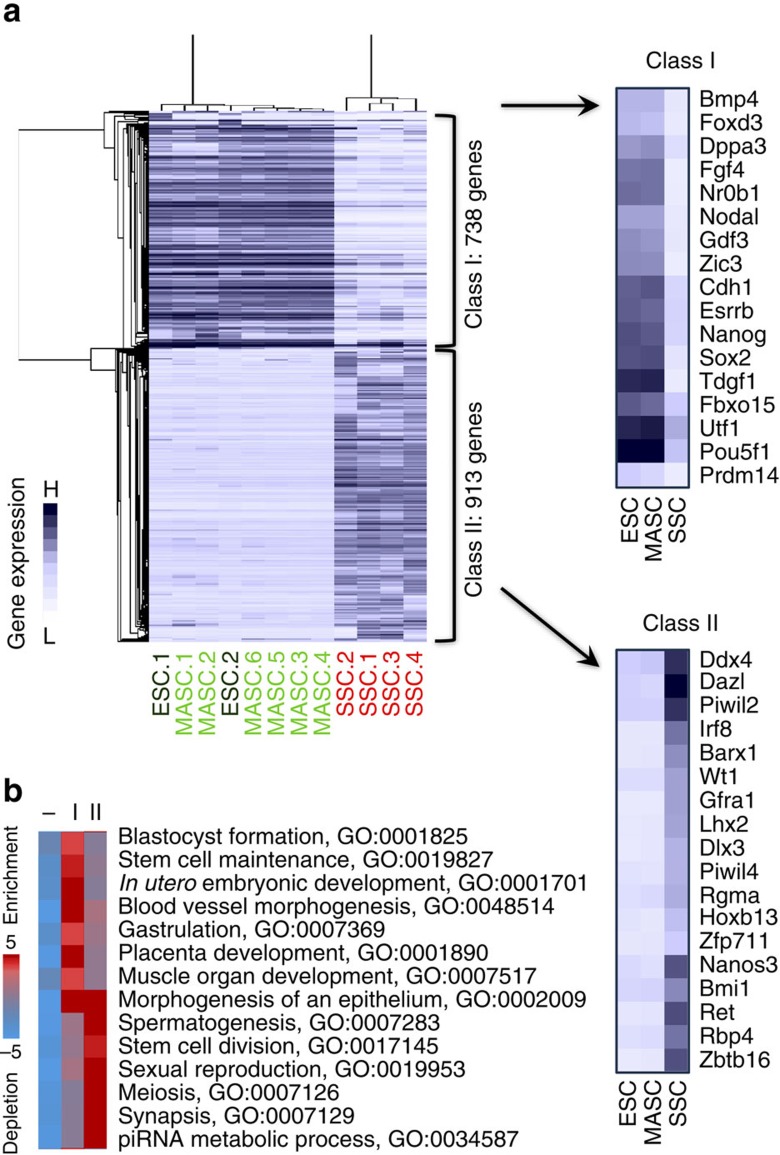
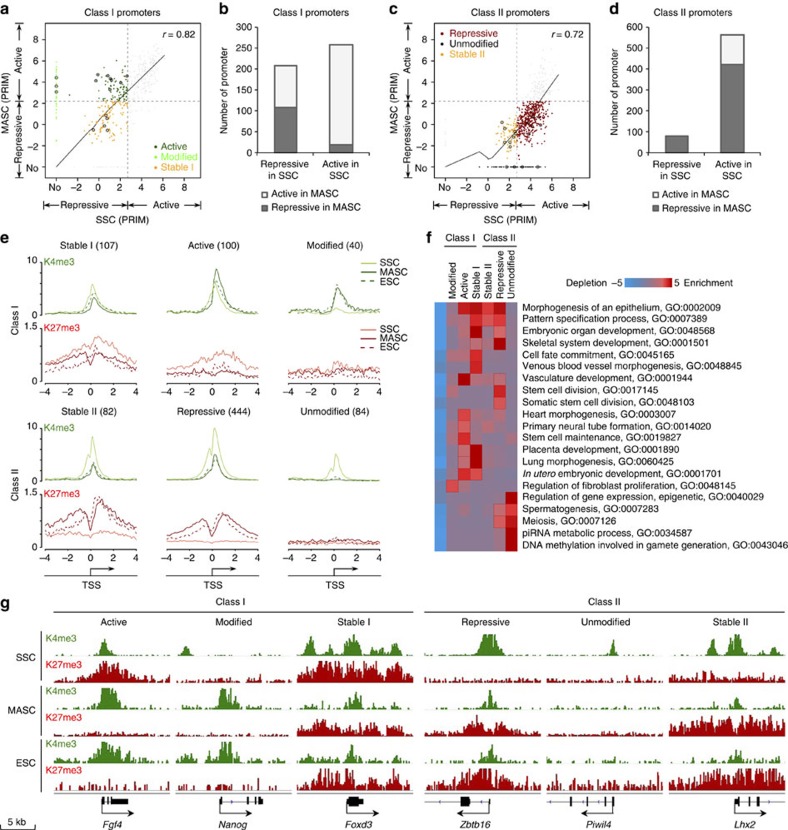
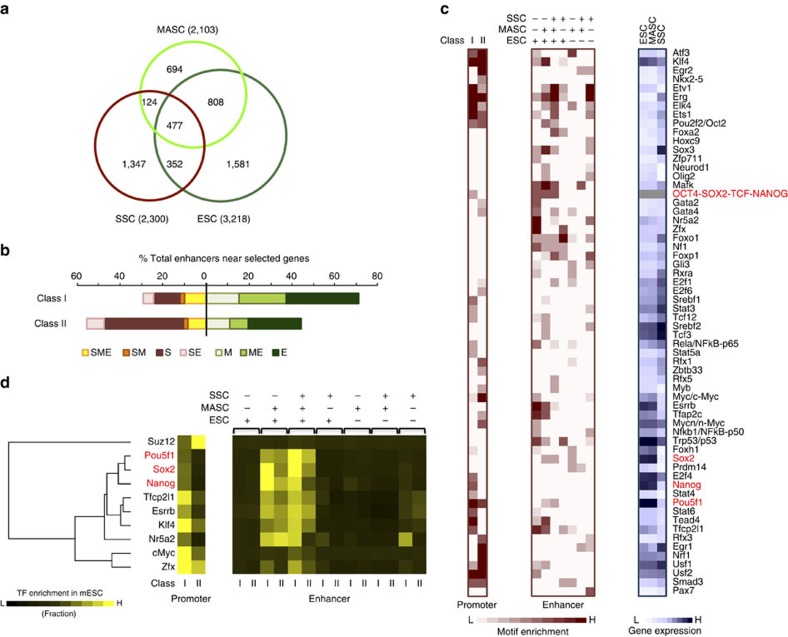
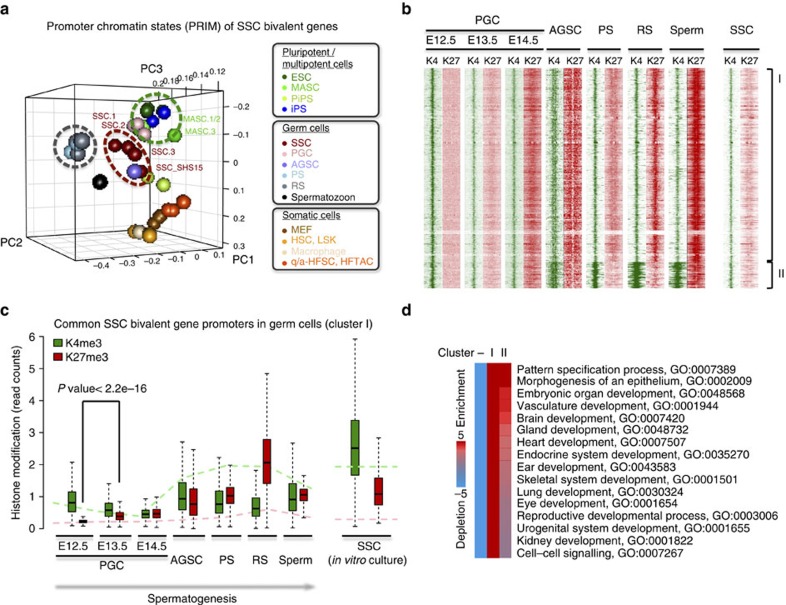
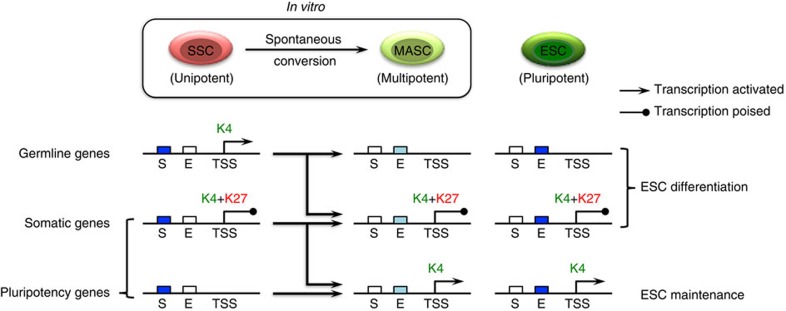
Spermatogonial stem and progenitor cells (SSCs) generate adult male gametes. During in vitro expansion, these unipotent murine cells spontaneously convert to multipotent adult spermatogonial-derived stem cells (MASCs). Here we investigate this conversion process through integrative transcriptomic and epigenomic analyses. We find in SSCs that promoters essential to maintenance and differentiation of embryonic stem cells (ESCs) are enriched with histone H3-lysine4 and -lysine 27 trimethylations. These bivalent modifications are maintained at most somatic promoters after conversion, bestowing MASCs an ESC-like promoter chromatin. At enhancers, the core pluripotency circuitry is activated partially in SSCs and completely in MASCs, concomitant with loss of germ cell-specific gene expression and initiation of embryonic-like programs. Furthermore, SSCs in vitro maintain the epigenomic characteristics of germ cells in vivo. Our observations suggest that SSCs encode innate plasticity through the epigenome and that both conversion of promoter chromatin states and activation of cell type-specific enhancers are prominent features of reprogramming.


Figures

Figure 1
Figure 1. Comparison of transcriptomes and epigenomes among different cell types.
(a) Cell type and developmental potency. Dark green, ESC and inner cell mass (ICM); green, MASC; red, SSC; blue, iPS cell; brown, MEF. Other male germ cells include PGC, pachytene spermatocyte (PS), round spermatid (RS) and spermatozoon. (b) Three-dimensional (3D) PCA plot based on mRNA expression of all protein-coding and noncoding genes. Dark green, ESCs; green, MASCs; blue, iPS; light green, incompletely reprogrammed MEFs (PiPS); red, SSC; pink, PGCs; brown, MEFs; dark orange, quiescent/activated-hair follicle stem cell (q/a-HFSC) and hair follicle transient-amplifying matrix cell (HFTAC); orange, HSC from culture or fluorescent-activated cell sorting (FACS)-isolated lineage, Sca-1+ and c-kit+ (LSK) cells; light orange, macrophage; slate blue, FACS-isolated Thy1+ adult germline stem cell (AGSC); sky blue, PS; grey, RS; black, spermatozoon. (c) 3D PCA plot based on PRIMs of all protein-coding and noncoding gene promoters with K4me3 and/or K27me3 modification. PRIM is calculated by read intensity ratio between K4me3 and K27me3 peaks at the same promoter region (log2(K4me3/K27me3)). Different cell types are distinguished by colours as in b.
Figure 2
Figure 2. ESC-like bivalent promoter modifications are largely preserved in SSCs and selectively activated in MASCs.
(a) Fraction of K4me3+K27me3 bivalent promoters within K27me3-marked promoters. For each cell type with at least three biological replicates (Supplementary Data 2) from different cell lines or resources, results are presented as mean values and s.d.'s. Number in brackets, sample size. Grey dashed line, fraction=0.9. (b) Overlap of bivalent genes identified by peak detection in SSCs, MASCs and ESCs (see Methods). (c) GO enrichment in bivalent genes shared in or unique to SSCs, MASCs and ESCs. ‘+' denotes promoter bivalency detected in each cell type. Enrichment and depletion of specific GO functions (shown on the right) were measured by hypergeometric P values (log10-transformed). The first column contains genes that do not belong to any of the measured classes and is used as a control gene list. Red, over-representation; blue, under-representation. (d) Comparison of global gene expression profiles between SSCs and MASCs. Black dots, SSC bivalent genes identified by peak detection; dashed line, cutoff of two-fold (log2) expression difference between SSCs and MASCs. (e) Percentage of genes with expression increase (black) or decrease (grey) in MASCs compared to SSCs for SSC bivalent genes (3,016 genes with both K4me3 and K27me3 modifications at promoters) and SSC univalent and unmodified genes (29,565 genes modified with either K4me3, K27me3 or neither of the two modifications at promoters). P value <2.2e-16 by Fisher's exact test (one-sided). (f) Promoter modification at selected genes. Green, K4me3; red, K27me3. K4me3 track range, 0–1; K27me3 track range, 0–0.5.
Figure 3
Figure 3. Activation of early embryonic genes and silencing of spermatogenesis-specific genes in MASCs.
(a) Differential gene expression profiling among ESCs, MASCs and SSCs. Genes with over two-fold (log2) expression difference between any pair of samples were selected and subjected to hierarchical clustering. Right, average expression profiling in each cell type for example genes in each class. Blue and white indicate relative high and low gene expression, respectively. (b) GO enrichment in each gene class. Red and blue indicate relative over- and under-representation, respectively.
Figure 4
Figure 4. Promoter chromatin states of differentially expressed genes are selectively changed.
(a) Comparison of chromatin states (PRIMs) between SSCs and MASCs for all class I gene promoters (grey dots). x axis, PRIMs from SSCs; y axis, PRIMs from MASCs. Black circles, representative class I genes from Fig. 3a; dashed black line, cutoff between active and repressive chromatin states; dark grey line, optimal curve fits to all class I gene promoters. r, correlation coefficient with all class I gene promoter PRIMs. On the basis of the cutoff value, three groups of promoters were selected: MASCActive (dark green dots); MASCModified (light green dots); and MASCStable I (yellow dots). (b) Number of class I gene promoters changing between repressive and active chromatin states in SSCs and MASCs. Light grey, epigenetically active promoters in MASCs; dark grey, epigenetically repressive promoters in MASCs. (c) Comparison of chromatin states (PRIMs) between SSCs and MASCs for all class II gene promoters (grey dots). Black circles, representative class II from Fig. 3a; dark grey line, optimal curve fits to all class II gene promoters. r, correlation coefficient with all class II gene promoter PRIMs. On the basis of the cutoff value, three groups of promoters were selected: MASCRepressive (dark red dots); MASCUnmodified (black dots); and MASCStable II (yellow dots). (d) Number of class II gene promoters changing between repressive and active chromatin states in SSCs and MASCs. Light grey, epigenetically active promoters in MASCs; dark grey, epigenetically repressive promoters in MASCs. (e) Histone modification enrichment profiling for selected class I gene promoters (top) and class II gene promoters (bottom) (grouped as in a,c). Number in brackets, gene number in each group. Green, K4me3; red, K27me3; solid light line, SSCs; solid dark line, MASCs; dashed dark line, ESCs; arrow, direction of transcription; x axis, distance to TSS; y axis, average read density. TSS, transcription start site. (f) GO enrichment in selected genes. Genes are grouped by promoter PRIMs as in a and c. (g) Promoter modification at selected genes. Top, expression class and promoter type of each gene; green, K4me3; red, K27me3. K4me3 track range, 0–1; K27me3 track range, 0–0.5.
Figure 5
Figure 5. Transcriptional regulators potentially involved in chromatin state changes at promoters and enhancers.
(a) Overlap of active enhancers in SSCs, MASCs, and ESCs. Number, number of enhancers in each subset. (b) Percentage of enhancers near Class I and II genes. S, enhancers active only in SSCs; SM, enhancers active in SSCs and MASCs; SE, enhancers active in SSCs and ESCs; SME, enhancers active in SSCs, MASCs, and ESCs; E, enhancers active only in ESCs; ME, enhancers active in MASCs and ESCs; M, enhancers active only in MASCs. (c) Enrichment of transcription factor binding motifs for promoters of expression class I and II (left) and enhancers active (+) or silent (−) in different cell types (middle). Each row represents a motif, and the expression of the corresponding transcriptional regulator is shown in the same row in the heatmap (right). Core pluripotency transcription factors are highlighted in red. Red and white in the heatmap indicate relative over- and under-representation of motif enrichment, respectively. Blue and white indicate relative high and low gene expression, respectively. (d) Enrichment of transcription factors at promoters and associated enhancers in ESCs. Promoters are grouped by expression class as in Fig. 3. Enhancers are grouped by activation (+) or silence (−) in different cell types (top) and expression class of associated promoters (bottom). Core pluripotency transcription factors are highlighted in red.
Figure 6
Figure 6. SSCs maintain consistent promoter bivalency with germ cells in vivo.
(a) Three-dimensional (3D) PCA plot based on PRIMs of all promoters with K4me3+K27me3 bivalent histone modifications in SSCs. Different cell types are distinguished by colours as in Fig. 1. (b) k-means clustering of SSC bivalent genes by similarity of K4me3 and K27me3 profiles at promoters. Green, K4me3; red, K27me3. Cluster I, 2,644 genes; cluster II, 372 genes. (c) Histone modification profiling at promoters of all cluster I genes as grouped in b. Germ cells include those isolated from testis by fluorescent-activated cell sorting (left) and SSCs cultured in vitro (right). y axis, average read count within promoter region. Green box, K4me3 modification; red box, K27me3 modification. The bottom and top of the boxes indicate the 25th and 75th percentiles, the central bars indicate medians and whiskers indicate non-outlier extremes. P values were calculated using Wilcoxon tests. Dashed green line, average read count of K4me3 modification at all promoters in each cell type; dashed red line, average read count of K27me3 modification at all promoters in each cell type. (d) GO enrichment using iPAGE. Genes are grouped by promoter K4me3 and K27me3 profiles as in b.
Figure 7
Figure 7. Model of epigenomic changes during SSC conversion to MASC.
SSC reprogramming involves changes in the epigenome at both cell-type-specific promoters and enhancers. Together with gene reactivation and silencing in reprogrammed MASCs, K4me3 modification (K4) is enriched at the promoters of pluripotency-associated genes but depleted from promoters of germline-specific genes. Conversely, K27me3 modification (K27) is erased from the promoters of many genes that are expressed in ESCs. However, K27me3 modification ‘poises' both germline- and somatic-specific gene promoters together with K4me3 modification. At enhancer regions, MASCs are devoid of most germ cell signature enhancer activity (S) marked by K27ac modification but exhibit partially active ESC-specific enhancers (E). In summary, MASCs acquire an ESC-like epigenome at promoters and a subset of ESC-specific enhancers. Dark blue box, completely active enhancer; light blue box, partially active enhancer; white box, silent enhancer; TSS, transcription start site.

References

    1. Kanatsu-Shinohara M. et al.. Generation of pluripotent stem cells from neonatal mouse testis. Cell 119, 1001–1012 (2004). - PubMed
    1. Seandel M. et al.. Generation of functional multipotent adult stem cells from GPR125+ germline progenitors. Nature 449, 346–350 (2007). - PMC - PubMed
    1. Takahashi K. & Yamanaka S. Induction of pluripotent stem cells from mouse embryonic and adult fibroblast cultures by defined factors. Cell 126, 663–676 (2006). - PubMed
    1. Takahashi K. et al.. Induction of pluripotent stem cells from adult human fibroblasts by defined factors. Cell 131, 861–872 (2007). - PubMed
    1. Pesce M., Wang X., Wolgemuth D. J. & Scholer H. Differential expression of the Oct-4 transcription factor during mouse germ cell differentiation. Mech. Dev. 71, 89–98 (1998). - PubMed

Publication types