. 2017 Jan;67(1):173-180.
doi: 10.1007/s12576-016-0452-5. Epub 2016 Apr 27.

Coupling of dyspnea perception and occurrence of tachypnea during exercise

Affiliations

Coupling of dyspnea perception and occurrence of tachypnea during exercise

Setsuro Tsukada et al. J Physiol Sci. 2017 Jan.

Abstract

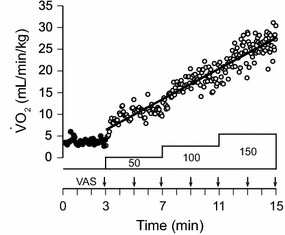
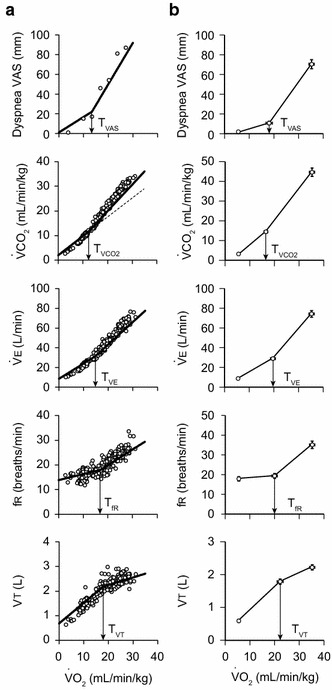
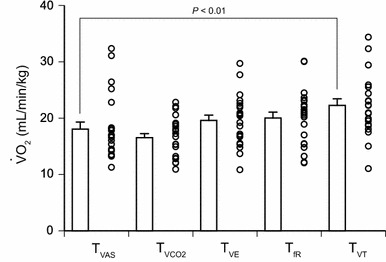
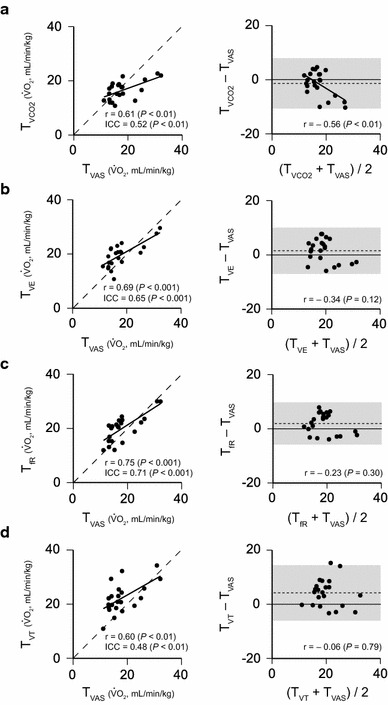
During exercise, tidal volume initially contributes to ventilatory responses more than respiratory frequency, and respiratory frequency then increases rapidly while tidal volume stabilizes. Dyspnea intensity is also known to increase in a threshold-like manner. We tested the possibility that the threshold of tachypneic breathing is equal to that of dyspnea perception during cycle ergometer exercise (n = 27). Dyspnea intensity was scored by a visual analog scale. Thresholds were expressed as values of pulmonary O2 uptake at each breakpoint. Dyspnea intensity and respiratory frequency started increasing rapidly once the intensity of stimuli exceeded a threshold level. The thresholds for dyspnea intensity and for occurrence of tachypnea were significantly correlated. An intraclass correlation coefficient of 0.71 and narrow limits of agreement on the Bland-Altman plot indicated a good agreement between these thresholds. These results suggest that the start of tachypneic breathing coincides with the threshold for dyspnea intensity during cycle ergometer exercise.

Keywords: Dyspnea; Exercise hyperpnea; Pulmonary O2 uptake; Respiratory frequency; Tachypnea.


Conflict of interest statement

The authors declare that they have no conflict of interest.

Figures

Fig. 1
Fig. 1
Pulmonary O2 uptake (VO2) during exercise in one participant. Exercise testing was performed on an electrically braked bicycle ergometer. After a 3-min rest (filled circles), he started exercise at an initial work rate of 50 W, which was increased in a stepwise manner by 50 W every 4 min to 150 W. The VO2 values at each time during exercise (open circles) were predicted by regression analysis between time and VO2. The intensity of dyspnea was measured using a 100-mm horizontal visual analog scale (VAS) at 2-min intervals
Fig. 2
Fig. 2
Typical examples from one participant and pooled data from 22 participants. a The participant is the same person for whom results are shown in Fig. 1. Changes in dyspnea VAS, pulmonary CO2 output (VCO2), minute ventilation (Ve), respiratory frequency (fr), and tidal volume (Vt) during exercise are shown. Each plot is fitted with a segmental linear regression model composed of two segments connected by a breakpoint to predict the threshold VO2 value (T VAS, T VCO2, T VE, T fR, T VT). b Pooled data from 22 participants. Values are mean ± SE (n = 22)
Fig. 3
Fig. 3
Mean threshold values of 22 participants, with the threshold values of each individual (open circles). The threshold for Vt (T VT) was significantly higher than that for dyspnea VAS (T VAS) (P < 0.01, Dunnett’s multiple-comparison post hoc test with T VAS serving as a control). There were no significant differences between T VAS and T VCO2, T VAS and T VE, or T VAS and T fR. Values are mean ± SE (n = 22)
Fig. 4
Fig. 4
Agreement between the thresholds assessed by the intraclass correlation coefficients (ICC) and the Bland–Altman plot. We analyzed the agreement between T VAS and any of the other thresholds using ICC and the Bland–Altman plot. T VAS and all other thresholds were significantly correlated (left panels; a–d). The calculated ICC values between T VAS and any of the other thresholds were also significant. A good agreement of ICC values was given between T VAS and T VE (0.65) (b) and between T VAS and T fR (0.71) (c). The Bland–Altman plots (right panels; a–d) show that the widths of the 95 % limits of agreement (gray color area) are 18.5 ml/min/kg of VO2 for T VCO2 and T VAS (a), 17.0 ml/min/kg for T VE and T VAS (b), 15.5 ml/min/kg for T fR and T VAS (c), and 20.4 ml/min/kg for T VT and T VAS (d). The Bland–Altman plot suggests better agreement between T VAS and T fR than other combinations

References

    1. Dejours P. Neurogenic factors in the control of ventilation during exercise. Circ Res. 1967;20(Suppl 1):146–153.
    1. Bechbache RR, Chow HH, Duffin J, Orsini EC. The effects of hypercapnia, hypoxia, exercise and anxiety on the pattern of breathing in man. J Physiol. 1979;293:285–300. doi: 10.1113/jphysiol.1979.sp012889. - DOI - PMC - PubMed
    1. Duffin J, Mohan RM, Vasiliou P, Stephenson R, Mahamed S. A model of the chemoreflex control of breathing in humans: model parameters measurement. Respir Physiol. 2000;120:13–26. doi: 10.1016/S0034-5687(00)00095-5. - DOI - PubMed
    1. Haouzi P (2006) Counterpoint: supraspinal locomotor centers do not contribute significantly to the hyperpnea of dynamic exercise. J Appl Physiol 100: 1079–1082; (discussion 1082–1073) - PubMed
    1. Waldrop TG, Iwamoto GA. Point: supraspinal locomotor centers do contribute significantly to the hyperpnea of dynamic exercise. J Appl Physiol. 2006;100:1077–1079. doi: 10.1152/japplphysiol.01528.2005. - DOI - PubMed