. 2017 Jun 1;34(2):241-260.
doi: 10.1093/imammb/dqw005.

Mass drug administration: the importance of synchrony

Affiliations

Mass drug administration: the importance of synchrony

Daozhou Gao et al. Math Med Biol. .

Abstract

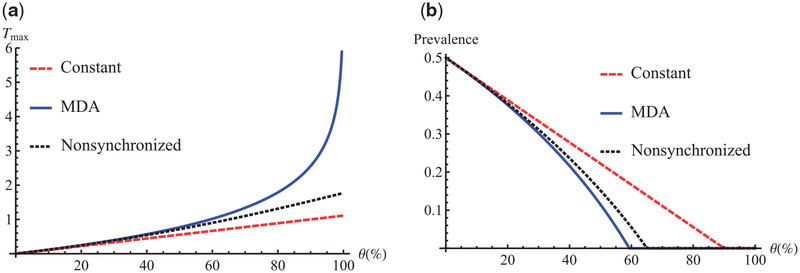
Mass drug administration, a strategy in which all individuals in a population are subject to treatment without individual diagnosis, has been recommended by the World Health Organization for controlling and eliminating several neglected tropical diseases, including trachoma and soil-transmitted helminths. In this article, we derive effective reproduction numbers and average post-treatment disease prevalences of a simple susceptible-infectious-susceptible epidemic model with constant, impulsive synchronized and non-synchronized drug administration strategies. In the non-synchronized model, the individuals in the population are treated at most once per period and their treatment times are uniformly distributed. Mathematically, the set of pulses for the non-synchronized model has the cardinality of the continuum. We show that synchronized and constant strategies are, respectively, the most and least effective treatments in disease control. Elimination through synchronized treatment is always possible when adequate drug efficacy and coverage are fulfilled and sustained. For a strategy with multiple rounds of synchronized treatment per period, the average post-treatment prevalence is irrelevant what the time differences between treatments are, as long as there are the same number of treatments per period.

Keywords: cost-effectiveness; effective reproduction number; non-synchronized treatment; synchronized treatment; trachoma.


Figures

Fig. 1.
Fig. 1.
The disease prevalence of each subpopulation and whole population through one time period. (a) The plot of Ij*(t) for the jth subpopulation under one impulsive synchronized treatment per period, 1 ≤ jn. (b) The plot of I*(t) under n impulsive treatments per period. The parameter values are β = 5, γ = 2, θ = 90%, T = 1 and n = 5.
Fig. 2.
Fig. 2.
(a) The curves of maximum allowable period for elimination of infection and (b) the curves of stable average prevalence under constant treatment (dashed line), impulsive synchronized MDA (solid line) and impulsive non-synchronized treatment (dotted line). Parameter values are β = 1.8, γ = 0.9 in both figures and T = 1 in the right figure.
Fig. 3.
Fig. 3.
Numerical solutions of the system under constant treatment (dashed line), impulsive synchronized MDA (solid line) and impulsive non-synchronized treatment (dotted line). (a) Even if all three treatment strategies can eliminate an infectious disease in one population, synchronized MDA is still the best one in the speed of achieving elimination. (b) If all three treatment strategies fail to eliminate an infectious disease, then synchronized MDA may spend the longest time in attaining a stable state. Dotted horizontal lines in the right figure are at the stable average prevalence of the system under constant treatment, impulsive synchronized MDA and impulsive non-synchronized treatment, respectively. Parameter values are β = 1.8, γ = 1.2, T = 1, θ = 70% in (a) and θ = 40% in (b).
Fig. 4.
Fig. 4.
Smoothed probability density plot of maximum allowable period of impulsive synchronized MDA. Solid line—all qualified scenarios, dash-doted line—scenarios with pretreatment prevalence less than 35%, dashed line—scenarios with pretreatment prevalence from 35 to 50% and dotted line—scenarios with pretreatment prevalence greater than 50%. The parameter ranges are listed in Table 1.

References

    1. Agur Z, Cojocaru L, Mazor G, Anderson RM & Danon YL (1993) Pulse mass measles vaccination across age cohorts. Proc. Natl Acad. Sci. USA, 90, 11698–11702. - PMC - PubMed
    1. Anderson R, Hollingsworth TD, Truscott J & Brooker S (2012) Optimisation of mass chemotherapy to control soil-transmitted helminth infection. Lancet, 379, 289–290. - PubMed
    1. Anderson R, Truscott J & Hollingsworth TD (2014) The coverage and frequency of mass drug administration required to eliminate persistent transmission of soil-transmitted helminths. Philos. Trans. R. Soc. B, 369, 20130435. - PMC - PubMed
    1. Bacaër N & Ouifki R (2007) Growth rate and basic reproduction number for population models with a simple periodic factor. Math. Biosci, 210, 647–658. - PubMed
    1. Bailey R, Duong T, Carpenter R, Whittle H & Mabey D (1999) The duration of human ocular Chlamydia trachomatis infection is age dependent. Epidemiol. Infect, 123, 479–486. - PMC - PubMed

Publication types

Substances