. 2016 Apr 27:6:25070.
doi: 10.1038/srep25070.

Differential utilization of binding loop flexibility in T cell receptor ligand selection and cross-reactivity

Affiliations

Differential utilization of binding loop flexibility in T cell receptor ligand selection and cross-reactivity

Cory M Ayres et al. Sci Rep. .

Abstract

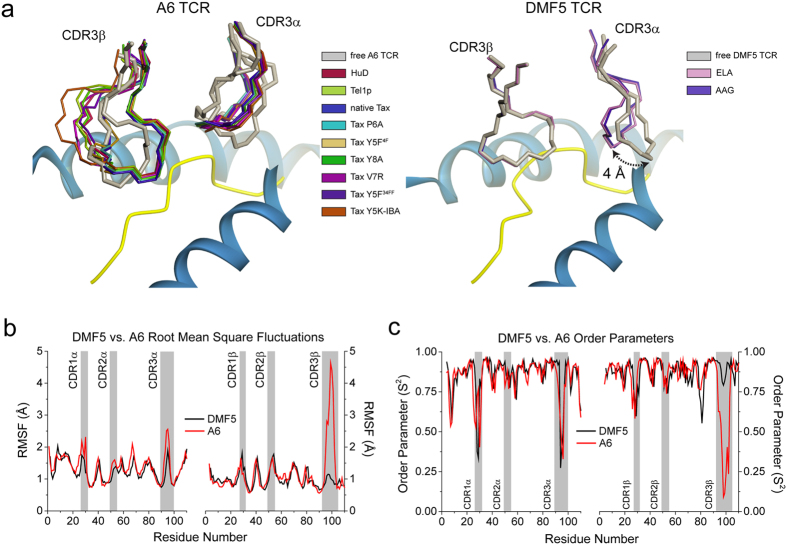
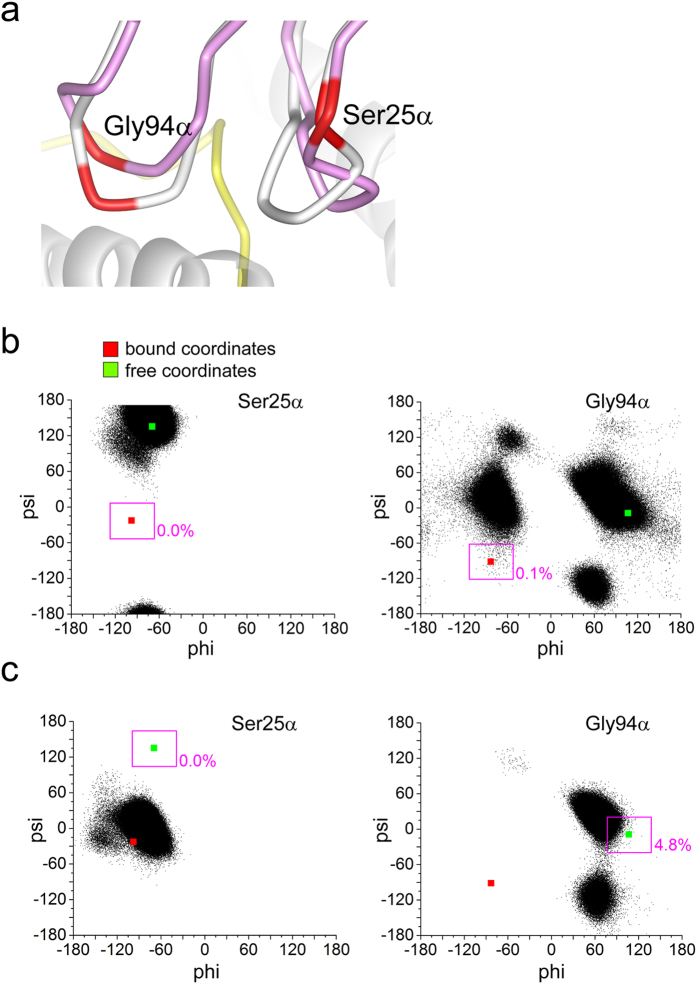
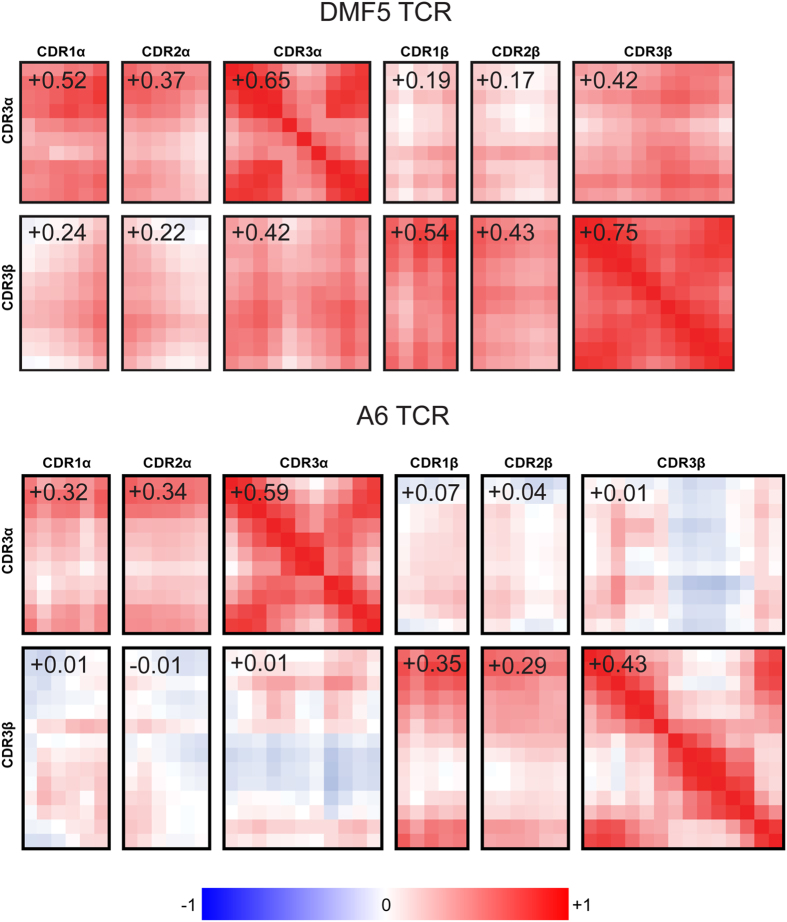
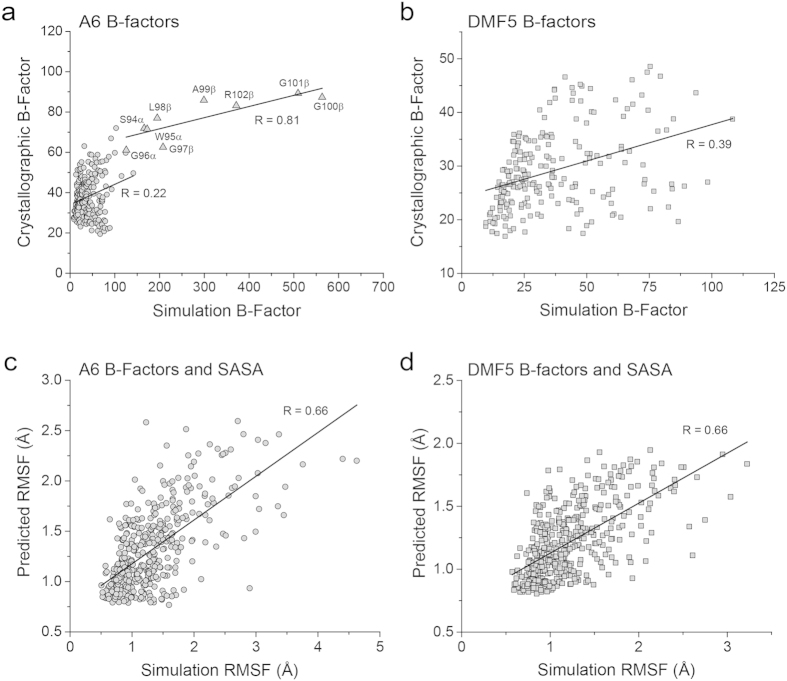
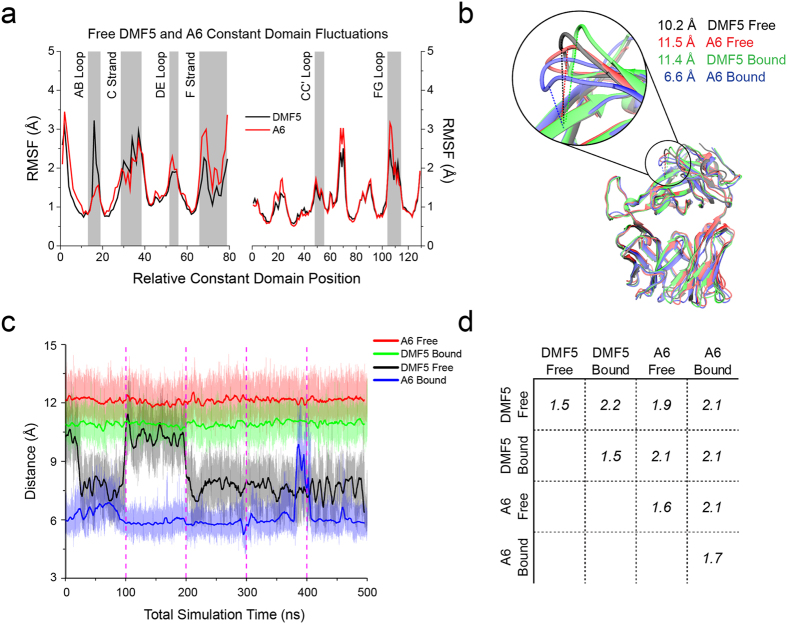
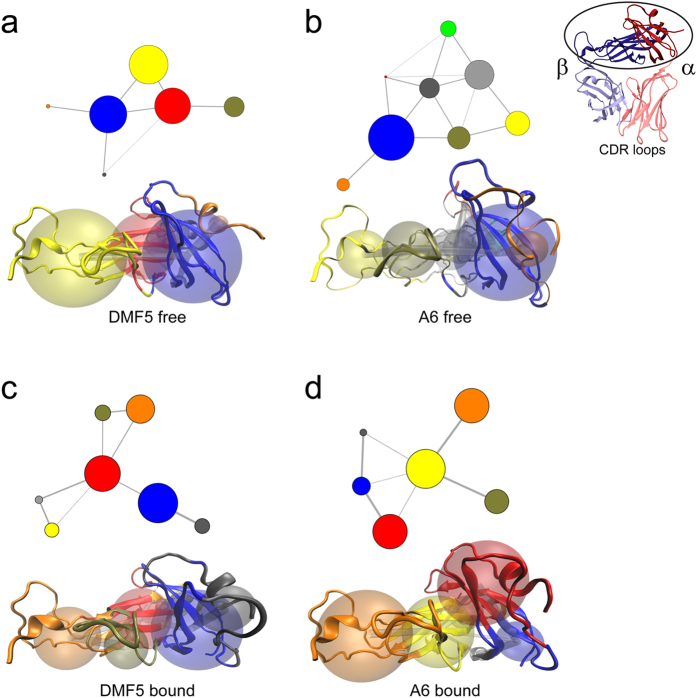
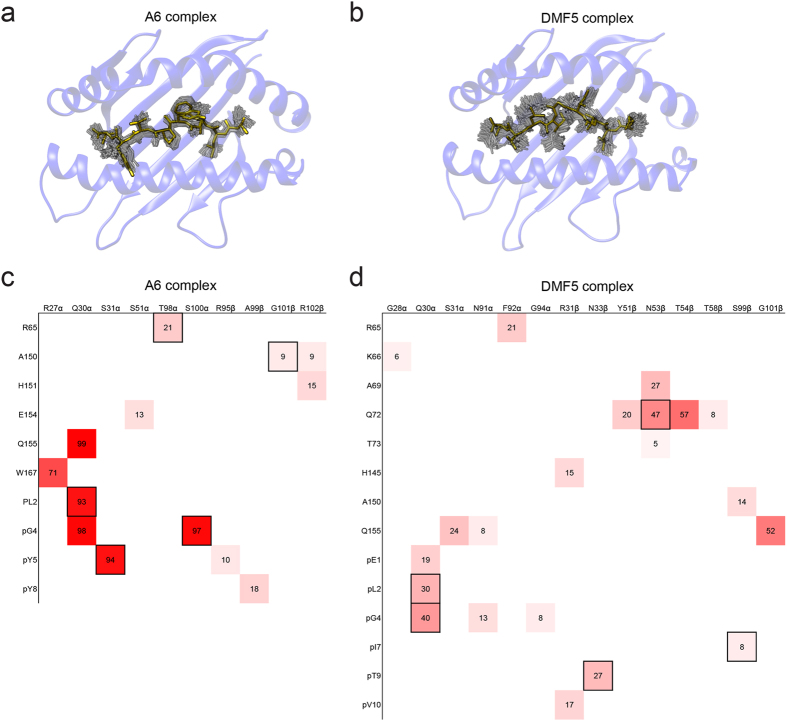
Complementarity determining region (CDR) loop flexibility has been suggested to play an important role in the selection and binding of ligands by T cell receptors (TCRs) of the cellular immune system. However, questions remain regarding the role of loop motion in TCR binding, and crystallographic structures have raised questions about the extent to which generalizations can be made. Here we studied the flexibility of two structurally well characterized αβ TCRs, A6 and DMF5. We found that the two receptors utilize loop motion very differently in ligand binding and cross-reactivity. While the loops of A6 move rapidly in an uncorrelated fashion, those of DMF5 are substantially less mobile. Accordingly, the mechanisms of binding and cross-reactivity are very different between the two TCRs: whereas A6 relies on conformational selection to select and bind different ligands, DMF5 uses a more rigid, permissive architecture with greater reliance on slower motions or induced-fit. In addition to binding site flexibility, we also explored whether ligand-binding resulted in common dynamical changes in A6 and DMF5 that could contribute to TCR triggering. Although binding-linked motional changes propagated throughout both receptors, no common features were observed, suggesting that changes in nanosecond-level TCR structural dynamics do not contribute to T cell signaling.


Figures

Figure 1
Figure 1. Differential dynamics of the A6 and DMF5 CDR binding loops.
(a) Comparison of the conformations of the hypervariable CDR3α and CDR3β loops of A6 (left) and DMF5 (right) in bound and free crystal structures. The loops of the A6 TCR show considerable structural variation when structures are compared, whereas those of the DMF5 TCR are in the same conformation when bound to the MART-1 26-35 decamer or 27–35 nonamer, with a small 4 Å shift in the position of the CDR3α loop between free and bound (left hand image adapted from ref. 20). (b) RMS fluctuations for the A6 and DMF5 variable domains computed from 500 ns of MD simulation of the free A6 and DMF5 TCRs. The shaded boxes indicate the positions and values of the various CDR loops. (C) As in panel B, but for order parameters.
Figure 2
Figure 2. Slower movement of DMF5 CDR loops suggest induced-fit behavior for a binding-linked conformational change.
(a) Comparison of the structures of the DMF5 CDR3α and CDR1α loop in their bound (purple) and free (grey) conformations, with Ser25α and Gly94α highlighted in red. The peptide and part of the MHC α1/α2 helices are shown in yellow and grey for orientation. (b) Phi/psi angle distributions from 500 ns of MD simulation of free DMF5 for Ser25α (left) and Gly94α (right). Green squares show the angles in the crystallographic structure of the free TCR. Red squares show the angles in the crystallographic structures of the bound TCR. Boxes indicate ±30° from the bound-state angles, with percentage of sampling within the box indicated. The bound conformation is not sampled for Ser25α, and only to 0.1% for Gly94α. (c) Phi/psi distribution from 500 ns for Ser25α (left) and Gly94α (right) of MD simulation of free DMF5, but beginning with the coordinates of the bound-state. Figures are notated as above. For Ser25α the loop does not return to its free-state conformation over the course of the simulation, indicative of a high-energy barrier between the bound and free conformations. For Gly94α the loop moves close to but does not fully arrive at the conformation seen in the free TCR.
Figure 3
Figure 3. The CDR loop motions of DMF5 (top) are positively correlated, whereas those of A6 (bottom) are largely uncorrelated.
Each large rectangle indicates a cross-correlation matrix for pairs of the CDR loops, with the individual squares indicating motional correlations between the α carbons of each amino acid of each loop. Numbers are the average correlation value for the data in each rectangle, yielding the average correlations between the CDR loops. The color scale from −1 (blue; full anti-correlation) to +1 (red; full correlation) is indicated at the bottom.
Figure 4
Figure 4. Structural correlations with motional amplitudes.
(a) Crystallographic vs. simulation B-factors for CDR loop α carbons in the free A6 TCR simulation. The observed vs. computed values for the apex of the highly mobile CDR3β loop (triangles) are well-correlated (R = 0.81). The values for the remainder of the CDR loops, however, are poorly correlated (R = 0.22). (b) As in panel A, but for the free DMF5 TCR. The values are poorly correlated, with R = 0.39. (c) Combining α carbon crystallographic B-factors with residue-specific relative solvent accessible surface areas led to a correlation between predicted and simulation RMSF values for the residues of the A6 CDR loops of 0.66. Weights for the linear terms are 0.012 for B-factors, 0.009 for surface area, and 0.5 for the intercept. (d) As in panel C, but for the DMF5 TCR. Weights for the linear terms are 0.014 for B-factors, 0.0075 for relative SASA, and 0.58 for the intercept.
Figure 5
Figure 5. Common dynamical changes do not propagate to the A6 and DMF5 TCR constant domains upon binding.
(a) RMS fluctuations for the A6 and DMF5 constant domains computed from 500 ns of MD simulation of the bound A6 and DMF5 TCRs. The shaded boxes indicate regions of interest. (b) Conformations of the AB loop within the Cα domains of the A6 and DMF5 bound and free crystal structures, showing distances between the α carbon of S127α at the loop apex and the nearby α carbon of A127β. (c) Distance between the α carbon of S127α of the AB loop and the α carbon of A127β in the A6 and DMF5 bound and free simulations as a function of simulation time. The loop remained static in all but two of the 20 100 ns trajectories. For free DMF5, the loop transitioned from closed to open in one trajectory (note that the loop started closed and remained so for three trajectories). Similarly, the loop transitioned from closed to open in one of the bound A6 trajectories. Transparent lines indicate frame-by-frame distance for each simulation (i.e., picosecond steps) whereas solid lines indicate the running average over 5000 frames (5 ns). Vertical dashed demark the independent 100 ns trajectories. (d) Matrix of average α carbon RMS deviations between the A6 and DMF5 constant domains and the bound and free simulations. Although the average conformation differs between free and bound for both A6 and DMF5 (RMSDs of 2.1 Å for A6, 2.2 Å for DMF5), conformational differences of similar magnitude exist between the free and bound states of the A6 and DMF5 constant domains (RMSDs of 1.9 Å and 2.1 Å).
Figure 6
Figure 6. Community network analysis fails to identify common dynamical changes in the A6 and DMF5 TCR after ligand binding.
(a,b) Community analysis for the constant domains of free DMF5 (a) and A6 (b). Communities and their connections are shown in the top images, and mapped to the three-dimensional structure of the constant domains in the bottom images. (c,d) Community analysis for the constant domains of bound DMF5 (c) and A6 (d). There is no apparent trend in the community assignment upon ligation, as DMF5 increased in the number of assigned communities and A6 decreased in the number of assigned communities. While communities of both TCRs were connected to the interior A, B, and E strands of the Cβ domain while bound (DMF5 red, A6 yellow), there was no impact on the correlation of α chain DE and β chain CC’ loops.
Figure 7
Figure 7. Fluctuations within the TCR-pMHC interface.
(a) Motion of the Tax peptide in the A6 complex. The solid peptide shows the crystallographic peptide conformation, while the shaded renderings show positions extracted every nanosecond of the simulations. (b) As in panel a, but for the MART-1 peptide in the DMF5 interface. (c) Heat map of hydrogen bonds within the A6 interface that form during the TCR-pMHC simulation. The map shows hydrogen bonds between residues, colored by percent hydrogen bond duration during the simulation (solid red = 100%). Numbers indicate percent duration. Boxed entries show those hydrogen bonds present in the TCR-pMHC crystallographic structure. (d) As in panel c, but for the DMF5 interface.

References

    1. Mason D. A very high level of crossreactivity is an essential feature of the T-cell receptor. Immunology Today 19, 395–404 (1998). - PubMed
    1. Wooldridge L. et al. A Single Autoimmune T Cell Receptor Recognizes More Than a Million Different Peptides. Journal of Biological Chemistry 287, 1168–1177 (2012). - PMC - PubMed
    1. Rossjohn J. et al. T Cell Antigen Receptor Recognition of Antigen-Presenting Molecules. Annual Review of Immunology 33, 169–200 (2015). - PubMed
    1. Gagnon S. J. et al. T Cell Receptor Recognition via Cooperative Conformational Plasticity. Journal of Molecular Biology 363, 228–243 (2006). - PubMed
    1. Garcia K. C. et al. Structural basis of plasticity in T cell receptor recognition of a self peptide-MHC antigen. Science 279, 1166–1172 (1998). - PubMed

Publication types

MeSH terms

Substances