

Big data visualization identifies the multidimensional molecular landscape of human gliomas
- PMID: 27118839
- PMCID: PMC4868421
- DOI: 10.1073/pnas.1601591113
Big data visualization identifies the multidimensional molecular landscape of human gliomas
Abstract
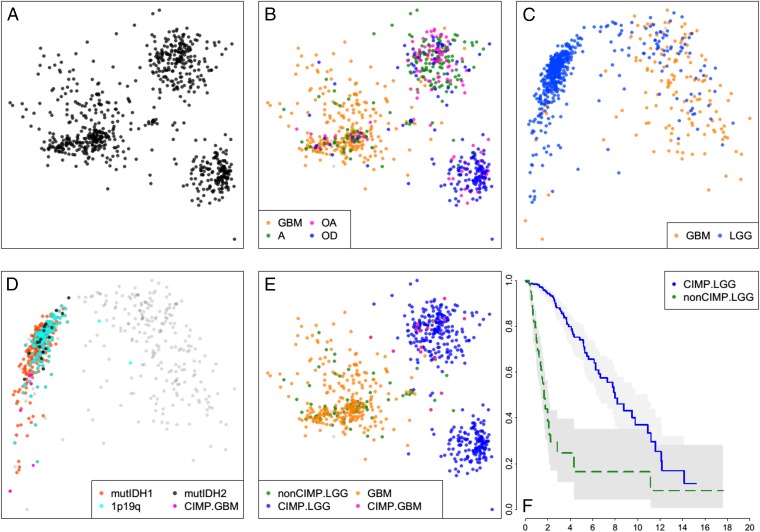
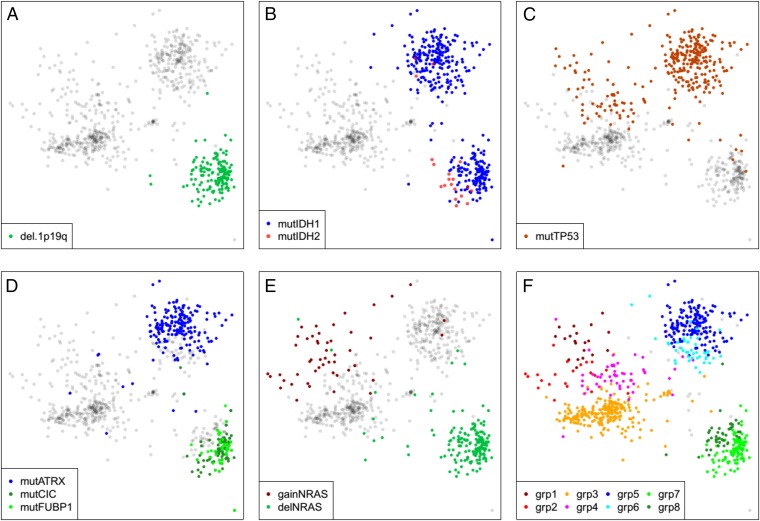
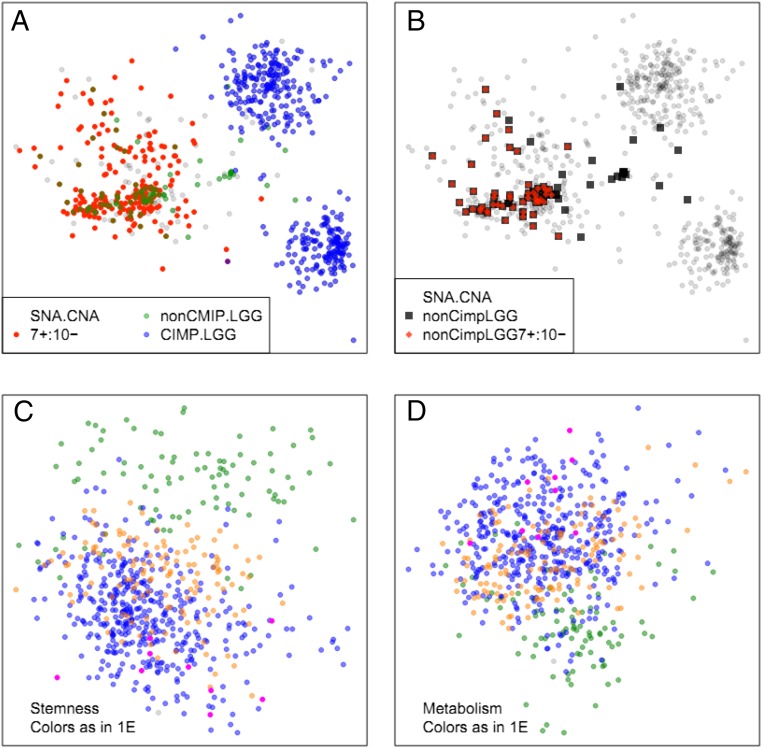
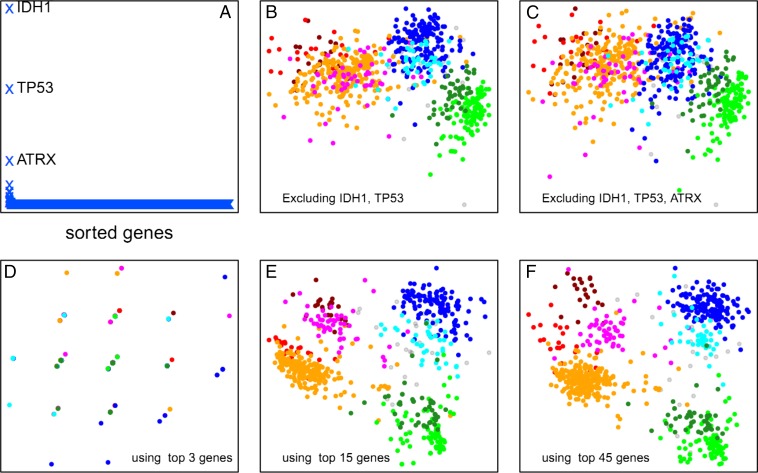
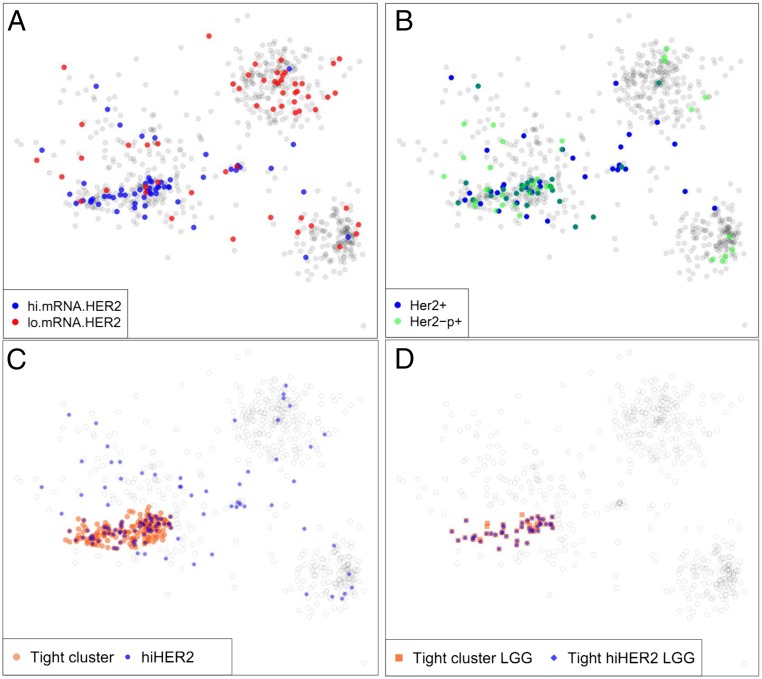
We show that visualizing large molecular and clinical datasets enables discovery of molecularly defined categories of highly similar patients. We generated a series of linked 2D sample similarity plots using genome-wide single nucleotide alterations (SNAs), copy number alterations (CNAs), DNA methylation, and RNA expression data. Applying this approach to the combined glioblastoma (GBM) and lower grade glioma (LGG) The Cancer Genome Atlas datasets, we find that combined CNA/SNA data divide gliomas into three highly distinct molecular groups. The mutations commonly used in clinical evaluation of these tumors are regionally distributed in these plots. One of the three groups is a mixture of GBM and LGG that shows similar methylation and survival characteristics to GBM. Altogether, our approach identifies eight molecularly defined glioma groups with distinct sequence/expression/methylation profiles. Importantly, we show that regionally clustered samples are enriched for specific drug targets.
Keywords: big data; biomarkers; glioma; precision medicine; visualization.
Conflict of interest statement
The authors declare no conflict of interest.
Figures
Similar articles
-
Discovering gene-environment interactions in glioblastoma through a comprehensive data integration bioinformatics method.Neurotoxicology. 2013 Mar;35:1-14. doi: 10.1016/j.neuro.2012.11.001. Epub 2012 Dec 20. Neurotoxicology. 2013. PMID: 23261424
-
Integrating multiple-level molecular data to infer the distinctions between glioblastoma and lower-grade glioma.Int J Cancer. 2019 Aug 15;145(4):952-961. doi: 10.1002/ijc.32174. Epub 2019 Feb 11. Int J Cancer. 2019. PMID: 30694558
-
GliomaDB: A Web Server for Integrating Glioma Omics Data and Interactive Analysis.Genomics Proteomics Bioinformatics. 2019 Aug;17(4):465-471. doi: 10.1016/j.gpb.2018.03.008. Epub 2019 Dec 5. Genomics Proteomics Bioinformatics. 2019. PMID: 31811943 Free PMC article.
-
A Comprehensive Review of Genomics and Noncoding RNA in Gliomas.Top Magn Reson Imaging. 2017 Feb;26(1):3-14. doi: 10.1097/RMR.0000000000000111. Top Magn Reson Imaging. 2017. PMID: 28079712 Review.
-
Progress in the application of molecular biomarkers in gliomas.Biochem Biophys Res Commun. 2015 Sep 11;465(1):1-4. doi: 10.1016/j.bbrc.2015.07.148. Epub 2015 Aug 4. Biochem Biophys Res Commun. 2015. PMID: 26253473 Review.
Cited by
-
Translating Basic Science Discoveries into Improved Outcomes for Glioblastoma.Clin Cancer Res. 2020 Jun 1;26(11):2457-2460. doi: 10.1158/1078-0432.CCR-19-3924. Epub 2020 Feb 14. Clin Cancer Res. 2020. PMID: 32060102 Free PMC article.
-
Tumor Cell Invasion in Glioblastoma.Int J Mol Sci. 2020 Mar 12;21(6):1932. doi: 10.3390/ijms21061932. Int J Mol Sci. 2020. PMID: 32178267 Free PMC article. Review.
-
An RNA seq-based reference landscape of human normal and neoplastic brain.Res Sq [Preprint]. 2023 Jan 10:rs.3.rs-2448083. doi: 10.21203/rs.3.rs-2448083/v1. Res Sq. 2023. Update in: Sci Rep. 2023 Mar 14;13(1):4228. doi: 10.1038/s41598-023-31180-z. PMID: 36711972 Free PMC article. Updated. Preprint.
-
Copy number profiling across glioblastoma populations has implications for clinical trial design.Neuro Oncol. 2018 Sep 3;20(10):1368-1373. doi: 10.1093/neuonc/noy108. Neuro Oncol. 2018. PMID: 29982740 Free PMC article.
-
Mutant IDH1 regulates the tumor-associated immune system in gliomas.Genes Dev. 2017 Apr 15;31(8):774-786. doi: 10.1101/gad.294991.116. Epub 2017 May 2. Genes Dev. 2017. PMID: 28465358 Free PMC article.
References
-
- Bailey P, Cushing H. A Classification of Tumours of the Glioma Group on a Histogenic Basis. J B Lippincott; Philadelphia: 1926.
-
- Hegi ME, et al. MGMT gene silencing and benefit from temozolomide in glioblastoma. N Engl J Med. 2005;352(10):997–1003. - PubMed
Publication types
MeSH terms
Substances
Grants and funding
LinkOut - more resources
Full Text Sources
Other Literature Sources
Research Materials
