. 2016 Jul 15;11(7):1880-90.
doi: 10.1021/acschembio.6b00291. Epub 2016 May 5.

ML314: A Biased Neurotensin Receptor Ligand for Methamphetamine Abuse

Affiliations

ML314: A Biased Neurotensin Receptor Ligand for Methamphetamine Abuse

Larry S Barak et al. ACS Chem Biol. .

Abstract

Pharmacological treatment for methamphetamine addiction will provide important societal benefits. Neurotensin receptor NTR1 and dopamine receptor distributions coincide in brain areas regulating methamphetamine-associated reward, and neurotensin peptides produce behaviors opposing psychostimulants. Therefore, undesirable methamphetamine-associated activities should be treatable with druggable NTR1 agonists, but no such FDA-approved therapeutics exist. We address this limitation with proof-of-concept data for ML314, a small-molecule, brain penetrant, β-arrestin biased, NTR1 agonist. ML314 attenuates amphetamine-like hyperlocomotion in dopamine transporter knockout mice, and in C57BL/6J mice it attenuates methamphetamine-induced hyperlocomotion, potentiates the psychostimulant inhibitory effects of a ghrelin antagonist, and reduces methamphetamine-associated conditioned place preference. In rats, ML314 blocks methamphetamine self-administration. ML314 acts as an allosteric enhancer of endogenous neurotensin, unmasking stoichiometric numbers of hidden NTR1 binding sites in transfected-cell membranes or mouse striatal membranes, while additionally supporting NTR1 endocytosis in cells in the absence of NT peptide. These results indicate ML314 is a viable, preclinical lead for methamphetamine abuse treatment and support an allosteric model of G protein-coupled receptor signaling.


Figures
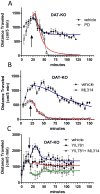
Figure 1
Figure 1. Locomotion of dopamine transporter knockout mice in the presence of ML314
Mice were injected (i.p.) at the times indicated by arrows with vehicle (saline) or compound, and horizontal distance traveled over 5 minute intervals measured. Points following the injection were fit to Lorentzian distributions with amplitude, center, width, and offset terms, [amp, cent, width, off]. A. PD at 1 mg/kg, vehicle [580 ± 61, 28.1 ± 0.86, 8.98 ± 2.1, 731 ± 22], n= 6; PD [1488 ± 65, 28.1 ± 0.86, 13.5 ±, 1.5, 0 ± 0], n = 4; B. ML314 at 20 mg/kg i.p., vehicle [1053 ± 88, 23.2 ± 1.0, 85.9 ± 9.3, 123 ± 94], n = 7; ML314 [652 ± 30, 23.2 ± 1.0, 12.4 ± 1.4, 0 ± 11], n = 10. C. YIL781 at 10 mg/kg, or YIL781 at 10 mg/kg and ML314 at 5 mg/kg, vehicle [964 ± 161, 30.9 ± 1.4, 8.8 ± 2.5, 1353 ± 59], n = 5; YIL781 [231 ± 116, 30.9 ± 1.4, 8.8 ± 2.5, 1063 ± 43], n = 4; YIL781 + ML314 [280 ± 136, 30.9 ± 1.4, 8.8 ± 2.5, 750 ± 47], n = 6. Data are presented as parameter ± standard error and were fit using GraphPad Prism 5.0.
Figure 2
Figure 2. Effect of ML314 on horizontal locomotion and conditioned place preference in the presence of methamphetamine
A- B. Mice placed in activity monitors and were injected (i.p.) at the times indicated by arrows with vehicle (saline) or the indicated compounds plus methamphetamine at 2 mg/kg (i.p.). Horizontal distance traveled over 5 minute intervals is plotted and points following the injection were fit to Lorentzian distributions with amplitude, center, width, and offset terms, [amp, cent, width, off]. (A) ML314 at 30mg/kg, vehicle [933 ± 36, 67.1 ± 0.67, 43.4 ± 2.6, 151 ± 40.1, n = 7; ML314 [705 ± 40, 85.6 ± 0.8, 43.4 ±, 2.6, 151 ± 40], n = 7; B. ML314 at 20 and 10 mg/kg i.p., vehicle [1067 ± 48, 44.5 ± 1.5, 42.5 ± 3.6, 204 ± 45], n = 5; ML314-20 [811 ± 45, 44.5 ± 1.5, 42.5 ± 3.6, 130 ± 38], n = 5; ML314-10 [798 ± 45, 44.5 ± 1.5, 42.5 ± 3.6, 208 ± 38], n = 5. Data are reported as parameter ± standard error and were determined using the program GraphPad Prism version 5.04. C-D. Bar graph of CPP results in (C) depicts the mean ± sem preference of WT C57BL/6J mice in the presence of vehicle (0.32 ± 0.03, n = 22 mice) or 20 mg/kg ML314 (0.20 ± 0.04, n=25 mice), Data were compared by Student’s t-test using GraphPad Prism, p=0.04. Graph in (D) is a scatter plot of the responses of the cohort of mice with mean shown in (C). E-F. Reduction of meth self-administration by pretreatment with ML314 (30 mg/kg) or vehicle. The pre group is the total presses during the 4 hour session the day before the drug treatment. The post group is the 4 hours session after the ML314 or vehicle was injected. Either ML314 or vehicle was injected 15 minutes prior to placement of rats in a self-administration chamber. Each lever press resulted in an i.v. infusion of 0.06 mg of meth. Results for pre/post exposure expressed as (mean ± sem, N)/ (mean ± sem, N) were for vehicle (53.0 ± 8.3, 15)/(48.0 ± 6.2, 15) and for ML314 (59.1 ± 8.3, 10)/(30. 1 ± 8.7, 10). Data were analyzed by Repeated Measures Analysis of Variance using SAS software, * corresponds to p = 0.0013. Graph in (F) is a scatter plot of the cohort responses of rats with mean shown in (E).
Figure 3
Figure 3. ML314 Activity via β-arrestin and G protein pathways
A. Fluorescence images of fixed U2OS cells (upper panels) demonstrating that translocation of β-arrestin2-GFP in a U2OS cell line containing the NTR1. Images were taken using a fluorescein filter set and a 40×, Plan Apo objective, NA/0.85, on a Zeiss Axiovert 200. To improve aggregate definition, the upper panel images were subject to wavelet analysis using the in-house, computer software Waveprog to remove high frequency noise and the low frequency blur arising from non-translocated, homogeneously distributed cytoplasmic β-arrestin2-GFP (corresponding lower panels). B. Competitive assessment of β-arrestin2 translocation to the NTR1 using the antagonist SR142948A in U2OS cells (left). The cells were pre-treated with the neurotensin receptor antagonist SR142948A for 10 minutes as described , followed by the addition of 10 μM ML301 for 40 minutes and paraformaldehyde fixation. The number of cytoplasmic aggregated objects was determined using Waveprog . Log(IC50) for SR142948A inhibition of ML301 is -7.2 ± 0.13 (mean ± sem, N = 3 independent experiments). Assessing the effects of ML314 and the control compound ML301 on NT(8-13) calcium signaling (right). HEK-293 cells expressing NTR1 were equilibrated with 5 μM Coelenterazine H for 2 hours in the dark at 37°C. Ten minutes prior to the measurement, the cells were treated with vehicle, 10 μM ML301, or 10 μM ML314. Treated cells were injected into assay plate wells containing the neurotensin peptide fragment NT(8-13), and bioluminescence was recorded for 15 seconds following injection. Data fit to a sigmoid response using GraphPad Prism version 5 and are presented as mean ± sem. (Maxima, Log(IC50)) for NT(8-13) are in the presence of vehicle, (3841 ± 140, -8.4 ± 0.09); ML301, (2316 ± 134, -8.7 ± 0.16); ML314, (1065 ± 206, -7.6 ± 0.43); (N = 3).
Figure 4
Figure 4. ML314 and Neurotensin Receptor1 NT-mediated binding, internalization, and β-arrestin translocation
A. The competitive displacement of 125I-NT was measured in the presence of ML314, ML301, or cold NT. Membranes containing the NTR1 were incubated in 100 μL of binding buffer at room temperature in the presence of 10 pM 125I-NT and increasing concentrations of neurotensin (NT) peptide, ML301, or ML314. Dose response curves of displacing compound were acquired and data are expressed as percent bound radioligand (mean ± sem) relative to no displacer (100%). The percent remaining with large concentrations of displacer and Log(IC50)s are for the different compounds: NT, (16 ± 8 %, -8.6 ± 0.3); ML301, (9 ± 13 %, -4.0 ± 0.2); ML314, (745 ± 123 %, -6.5 ± 0.45); (N = 3). B. The competitive displacement of 125I-NT by cold NT from the NTR1 in the presence of different doses of ML314 was measured in U2OS cell membranes. Percent bound radioligand relative to vehicle (100%) was determined as in (A). Data were fit to a shared Log(IC50), -9.3 ± 0.09, and shared minimum of the sigmoid response curve, 37 ± 9. Computed curve maxima are: NT, 96 ± 22 %; ML314 (0.5 μM, 1 μM 2 μM), (271 ± 22 %, 433 ± 23 %, 651 ± 24 %); (N = 3). C-D. U2OS cells transfected with the FAP-NTR1 were simultaneously treated with NT, ML314, and/or vehicle at time 0, and remaining plasma membrane receptor was compared to untreated controls at 1 hour using the FAP-based assay (Methods). (C) Data were analyzed by 1 way ANOVA with Tukey's multiple comparison test and results are reported as mean ± sem from N =4 independent experiments done in triplicate except where noted. In order from left to right the bar heights are: (3.4 ± 1.8 %, N=2; 7.2 ± 1.0 %; 25.3 ± 1.7 %; 32.6 ± 2.0 %; 30.4 ± 1.0 %), *** p < 0.001 and # p < 0.05. (D) Data points represent mean ± sem were fit using nonlinear regression to a sigmoid curve with a constraint that the “bottom” values of the NT ( formula image) and NT + ML314-1 μM ( formula image) fitted curves are shared. Top, bottom, and Log(EC 50) values for each curve were NT (1.01 ±.04, 0.050 ±.045, -9.34±0.13), ML314-1 μM (1.03 ±.04, 0.050 ±.045, -9.64±0.13), and NT ML314-10μM (1.00 ±.07, 0.49 ±.07, -9.48±0.29). Data represent N=4 independent experiments performed in triplicate. E. β-arrestin2-GFP translocation to NTR1 in U2OS cells was determined in the absence and presence of 10-20 μM ML314 that was added simultaneously with NT. Data points represent mean ± sem from N=4 independent experiments in duplicate NT alone)/quadruplicate (NT and ML314) and were fit as in (D) with shared “top”. Top, bottom, and Log(EC 50) values for each curve are: NT (952 ± 37, -111 ± 105, -8.87 ± 0.17) and NT+ ML314 (952 ± 37, 206 ± 69, -8.68 ± 0.18). Data were analyzed and plotted using the software GraphPad Prism version 5.
Figure 5
Figure 5. Increase in Membrane Binding in the presence of ML314
A. U2OS cell membranes containing the NTR1 were incubated at room temperature in the presence of vehicle or 2 μM ML314, and increasing concentrations of 3H-NT peptide. Comparison of the nonspecific binding in the presence of 2 μM ML314 calculated with 1 μM cold NT peptide or 1 μM SR142948A. The (slopes per nM, intercepts) are: for cold NT, (44 ± 3, 10 ± 2) and for SR142948A, (39 ± 2, 10 ± 2); (mean ± sem, N=4). B. Relative specific binding for U2OS membranes calculated as total minus nonspecific binding where nonspecific binding was determined in the presence of 1 μM cold NT peptide. Calculated Bmax, Kd, and Hill slope are: Vehicle (0.40 ± 0.08, 8.1 ± 3.6 nM, 1); ML314 (1.12 ± 0.04, 1.7 ± 0.2 nM, 1), (mean ± sem, N = 5). C-D. These panels are representative of 125I-NT specific binding to striatal membranes of DAT-KO mice. Tissue extracts from mouse brains were incubated in the presence of 10 pM 125I-NT and with vehicle or ML314 to determine total binding. Non-specific (NS) binding was measured in the presence of cold NT peptide. Specific binding was then determined as Total minus NS. E. Brain membranes (100 μg/well) obtained from the striatum of DAT knockout mice were incubated in the presence of either 1 μM cold NT or the indicated concentrations of ML314 at room temperature for 10 min, at which time 10 pM of 125I-NT was added for 90 minutes. The ordinate axis in counts per minute (CPM) represents specifically bound 125I-NT. In each experiment the assays were conducted in quadruplicate and data are expressed as the mean ± sem (N = 4 separate experiments) and were analyzed using one-way ANOVA with Tukey's multiple comparison post-hoc test. Curve fitting and statistical analyses were performed using GraphPad Prism V5.04.
Figure 6
Figure 6. Symmetry modeling of ML314 induced increases in the efficacy of binding of NT to the NTR1
A. Effect on Receptor dimers – While receptor dimers should have three possible choices in binding an orthosteric ligand (brown), compounds may be limited to binding receptor dimer protomers with a 1:1 stoichiometry (1 ligand per 2 receptor monomers). The addition of an ML314 like compound (blue) would enhance ligand binding at the orthosteric site by shifting the receptor equilibrium to the dissociated monomer form. The allosteric ligand may or may not dissociate while each monomer now is free to bind NT ligand with a 1:1 stoichiometry. B. Construction of symmetric protomer arrays – The fundamental monomer building block of the array forms closed polygonal cells in which elements are connected repeatedly either tail-head-tail or tail-tail and head-head. For an odd number of elements only tail-head-tail assemblies are possible. Additionally, cells have the orientation illustrated by the arrow for the hexamer cell on the right. Examples of tail-tail, head-head lattices of cells with rotational symmetry are shown for tetramer and hexamer building blocks. C. An oligomer arrangement of NTR1 protomer dimers into a hexamer based lattice - Approximating the sides of adjacent cells creates a symmetric array of protomer dimers. Lattices of linear polarized G proteins (left, opposing arrows indicate monomer directionality) interact with and break the symmetry of a receptor hexamer array of receptor/protomer dimers (middle) to form a hexagonal lattice of receptors polarized along the direction of the G protein lattice (right). Only two of three potential receptor dimer binding regions, the ones that are aligned along the G protein axis, can be occupied by either one or two ligands. This model predicts that for a hexagonal lattice in the presence and absence of an ML314 like compound that dissociates the dimers, the occupancy ratio of bound orthosteric ligand, Bmax (with ML314 like compound)/Bmax (without ML314 like compound), is either 3 or 1.5 (bound ligand increases from either 4 of 12 or 8 of 12 to 12 of 12 sites occupied in the dissociated receptors).

References

    1. Frankel PS, Hoonakker AJ, Alburges ME, McDougall JW, McFadden LM, Fleckenstein AE, Hanson GR. Effect of methamphetamine self-administration on neurotensin systems of the basal ganglia. J Pharmacol Exp Ther. 2011;336:809–815. - PMC - PubMed
    1. Roehr B. Half a million Americans use methamphetamine every week. BMJ. 2005;331:476. - PMC - PubMed
    1. Hser YI, Huang D, Brecht ML, Li L, Evans E. Contrasting trajectories of heroin, cocaine, and methamphetamine use. Journal of addictive diseases. 2008;27:13–21. - PMC - PubMed
    1. Volkow ND. Methamphetamine, Letter from the Director. 2014 http://www.drugabuse.gov/publications/research-reports/methamphetamine/l....
    1. Carraway R, Leeman SE. The isolation of a new hypotensive peptide, neurotensin, from bovine hypothalami. J Biol Chem. 1973;248:6854–6861. - PubMed

Publication types