. 2016 Jun;12(7):2069-79.
doi: 10.1039/c6mb00168h.

Lipid dynamics in zebrafish embryonic development observed by DESI-MS imaging and nanoelectrospray-MS

Affiliations

Lipid dynamics in zebrafish embryonic development observed by DESI-MS imaging and nanoelectrospray-MS

V Pirro et al. Mol Biosyst. 2016 Jun.

Abstract

The zebrafish Danio rerio is a model vertebrate organism for understanding biological mechanisms. Recent studies have explored using zebrafish as a model for lipid-related diseases, for in vivo fish bioassays, and for embryonic toxicity experiments. Mass spectrometry (MS) and MS imaging are established tools for lipid profiling and spatial mapping of biomolecules and offer rapid, sensitive, and simple analytical protocols for zebrafish analysis. When ambient ionization techniques are used, ions are generated in native environmental conditions, requiring neither sample preparation nor separation of molecules prior to MS. We used two direct MS techniques to describe the dynamics of the lipid profile during zebrafish embryonic development from 0 to 96 hours post-fertilization and to explore these analytical approaches as molecular diagnostic assays. Desorption electrospray ionization (DESI) MS imaging followed by nanoelectrospray (nESI) MS and tandem MS (MS/MS) were used in positive and negative ion modes, allowing the detection of a large variety of phosphatidylglycerols, phosphatidylcholines, phosphatidylinositols, free fatty acids, triacylglycerols, ubiquinone, squalene, and other lipids, and revealed information on the spatial distributions of lipids within the embryo and on lipid molecular structure. Differences were observed in the relative ion abundances of free fatty acids, triacylglycerols, and ubiquinone - essentially localized to the yolk - across developmental stages, whereas no relevant differences were found in the distribution of complex membrane glycerophospholipids, indicating conserved lipid constitution. Embryos exposed to trichloroethylene for 72 hours exhibited an altered lipid profile, indicating the potential utility of this technique for testing the effects of environmental contaminants.


Conflict of interest statement

No conflicts of interest are declared.

Figures

Fig. 1
Fig. 1. Analysis workflow
1) For the DESI-MS imaging experiment, each paper array taped on an insulating surface (a glass microscope slide) was individually positioned on the custom DESI moving stage and analyzed. The DESI spray was positioned on top of the paper with optimized angle and distance from both sample surface and MS inlet. With the aid of an inert gas (nitrogen), a solvent stream charged to a high electrical potential is directed at the sample. Gas phase ions are produced in the small area that the solvent strikes via electrospray-like mechanisms. For a DESI image acquisition, the sample is moved under the DESI spray to a velocity that is synchronized with the time necessary for data acquisition. The acquired data are subsequently reassembled to display individual DESI ion images and for data analysis. 2) After completion of the DESI-MS image, the paper array was cut with scissors into strips to isolate individual embryos. Each strip was inserted into a borosilicate glass capillary pulled into sharp tip to perform nESI-MS and nESI-MS/MS experiments.
Fig. 2
Fig. 2
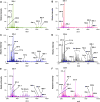
Averaged nESI-MS spectra in negative ion mode. A. 0 hpf (n=16 samples). B. 24 hpf (n=13 samples). C. 48 hpf (n=16 samples). D. 72 hpf, controls (n=10 samples). E. 72 hpf, exposed to TCE (n=15 samples). F. 96 hpf (n=11 samples).
Fig. 3
Fig. 3
DESI ion images in negative ion mode for paper array # 3 (embryos at 72 and 96 hpf). A. Ion of m/z 279. B. Ion of m/z 281. C. Ion of m/z 301. D. Ion of m/z 303. E. Ion of m/z 327. F. Picture of paper array # 3 displayed to check the position of the embryos.
Fig. 4
Fig. 4
A. Product ion scan for the precursor ions of m/z 883. B. Product ion scan for the precursor ion of m/z 885. Average product ion spectra were collected from a representative zebrafish embryo at 72 hdf by nESI-MS/MS in negative ion mode. Identity of the main fragments for PI(18:0_20:4) is reported as insight.
Fig. 5
Fig. 5. Averaged DESI-MS spectra in positive ion mode
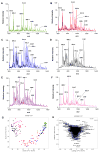
A. 0 hpf (n=24). B. 24 hpf (n=30). C. 48 hpf (n=36). D. 72 hpf, controls (n=25). E. 72 hpf, exposed to TCE (n=23). F. 96 hpf (n=21). Principal component analysis: G. PC1 and PC2 score plot. Samples are color-coded as follows: 0 hpf, green; 24 hpf, blue; 48 hpf, red; 72 hpf controls, black; 72 hpf exposed to TCE, purple; 96 hpf, magenta. H. PC1 and PC2 loading plot; variables are labeled in terms of their m/z ratio.
Figure 6
Figure 6
DESI images of slide # 1 (embryos at 0, 24, and 48 hpf). A. Ion of m/z 688 (squalene). B. Ion of m/z 803. C. Ion of m/z 913. D. Ion of m/z 1140 (ubiquinone). DESI images of slide # 3 (embryos at 72 and 96 hpf). E. Ion of m/z 688 (squalene). F. Ion of m/z 803. G. Ion of m/z 913. H. Ion of m/z 1140 (ubiquinone).

References

    1. Truong L, Harper SL, Tanguay RL. Methods Mol Biol. 2011;691:271–279. - PMC - PubMed
    1. MacRae CA, Peterson RT. Nat Rev Drug Discov. 2015;14:721–731. - PubMed
    1. Huang SM, Xu F, Lam SH, Gong Z, Ong CN. Mol Biosyst. 2013;9:1372–1380. - PubMed
    1. Anderson JL, Carten JD, Farber SA. Methods Cell Biol. 2011;101:111–141. - PMC - PubMed
    1. Lam SM, Shui G. J Genet Genomics. 2013;40:375–390. - PubMed

Publication types

LinkOut - more resources