. 2016 May 5;533(7601):52-7.
doi: 10.1038/nature17936. Epub 2016 Apr 27.

Principles underlying sensory map topography in primary visual cortex

Affiliations

Principles underlying sensory map topography in primary visual cortex

Jens Kremkow et al. Nature. .

Abstract

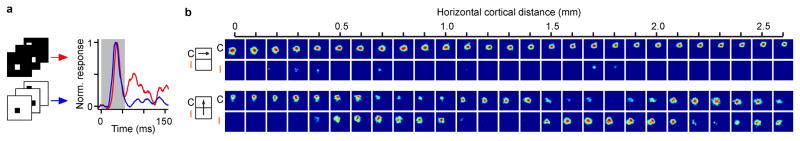
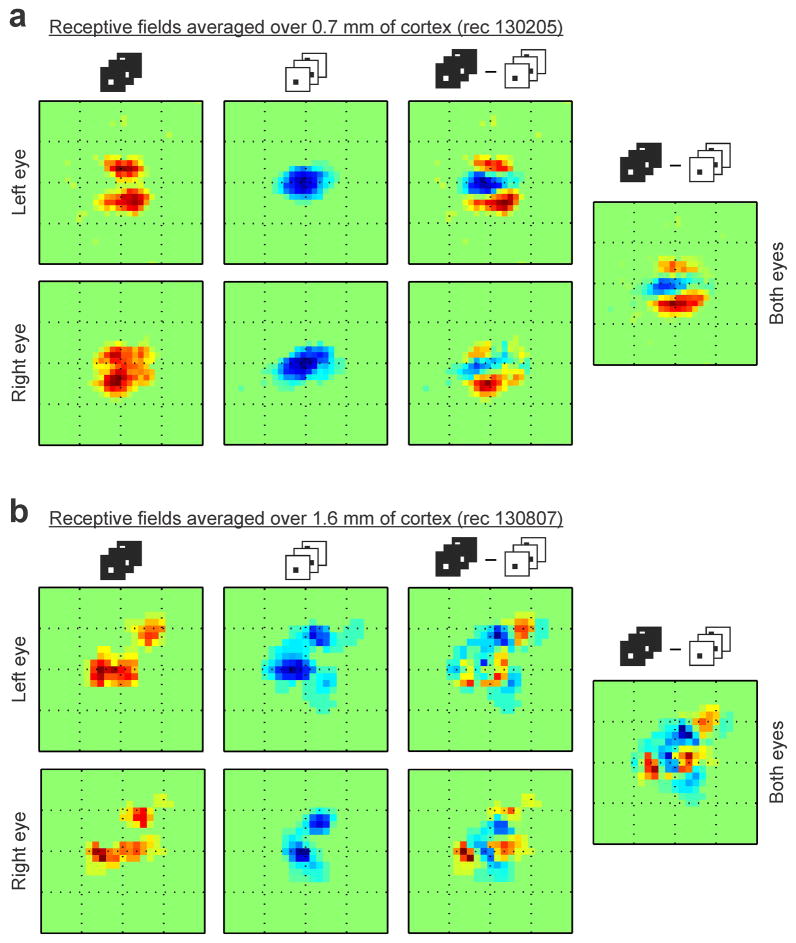
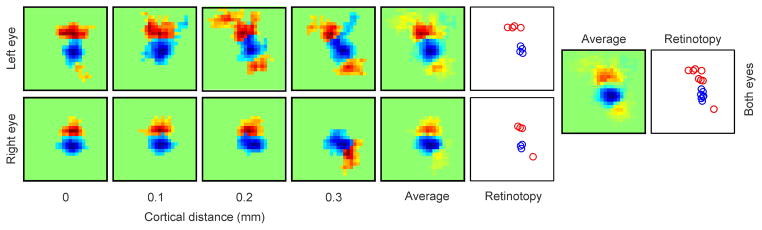
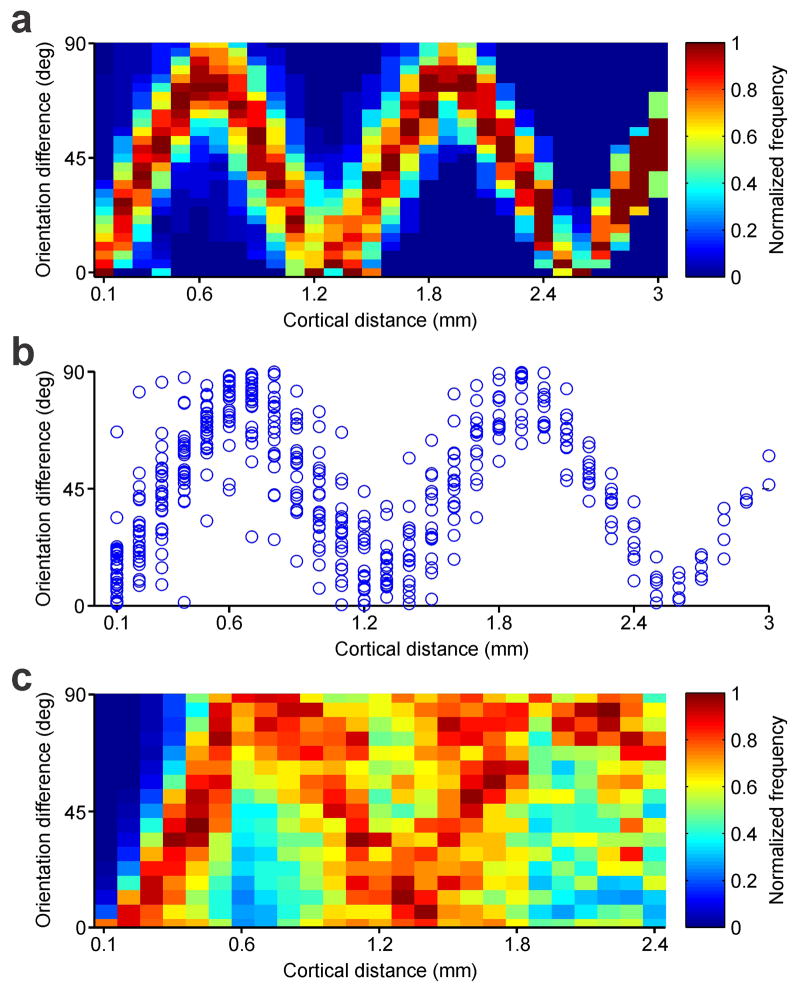
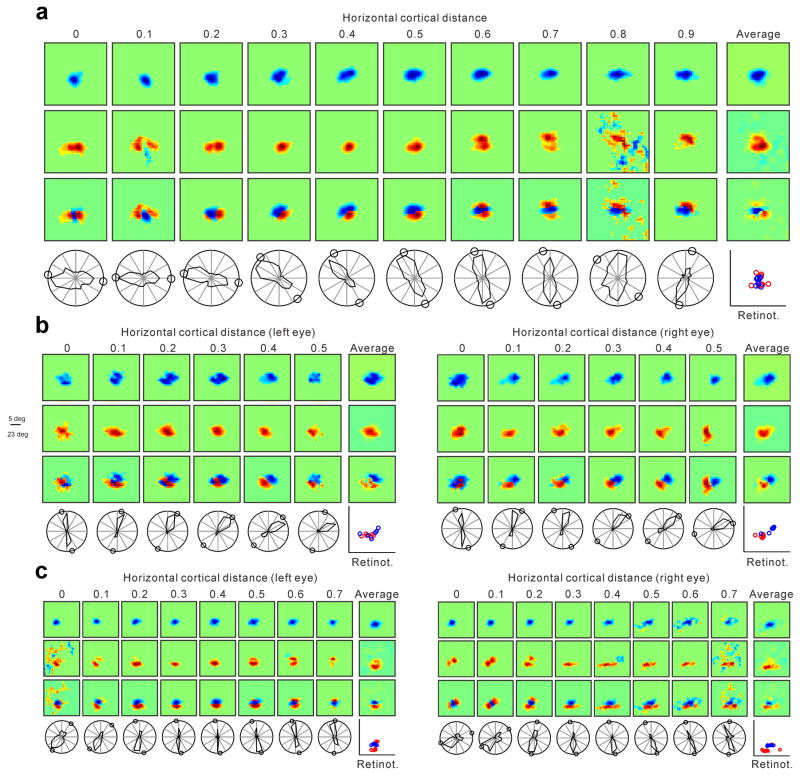
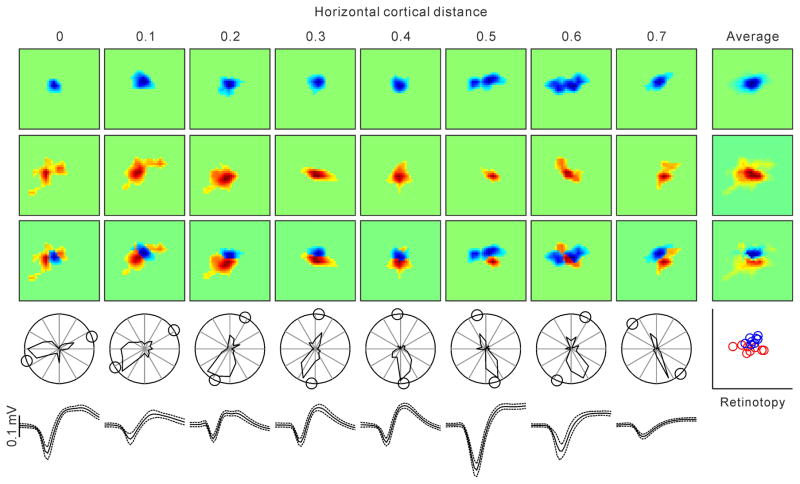
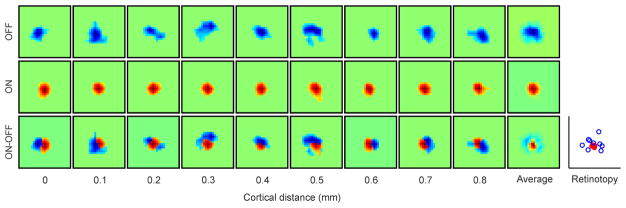
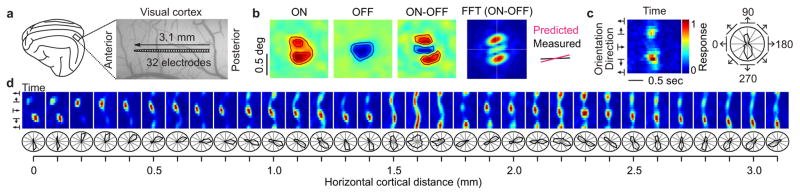
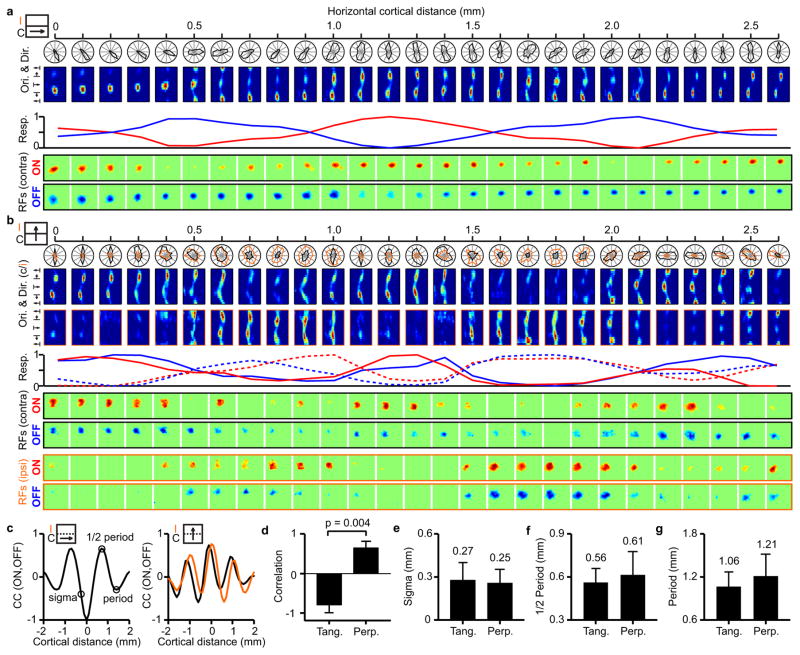
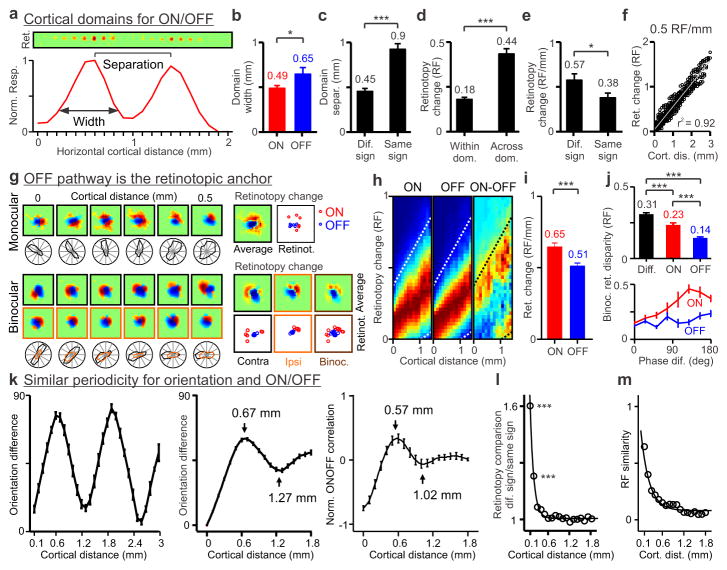
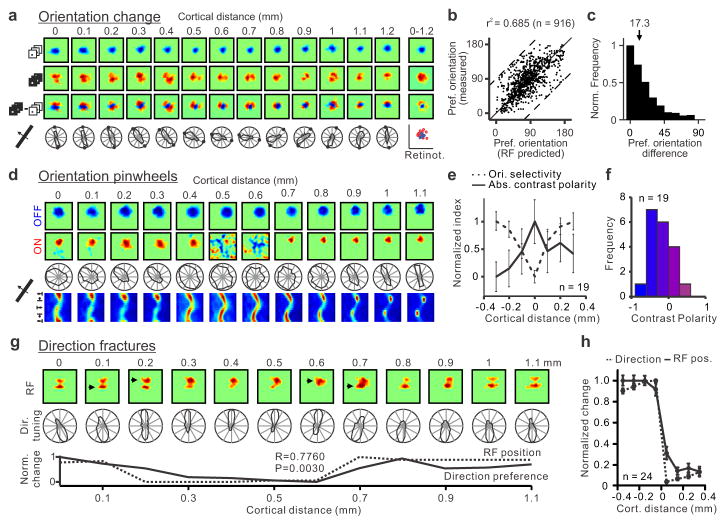
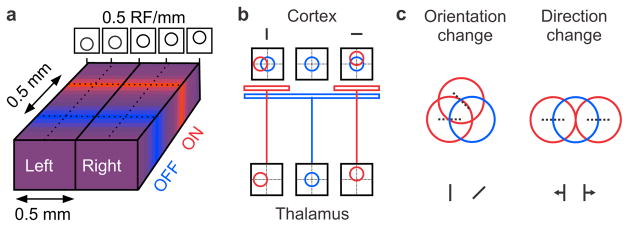
The primary visual cortex contains a detailed map of the visual scene, which is represented according to multiple stimulus dimensions including spatial location, ocular dominance and stimulus orientation. The maps for spatial location and ocular dominance arise from the spatial arrangement of thalamic afferent axons in the cortex. However, the origins of the other maps remain unclear. Here we show that the cortical maps for orientation, direction and retinal disparity in the cat (Felis catus) are all strongly related to the organization of the map for spatial location of light (ON) and dark (OFF) stimuli, an organization that we show is OFF-dominated, OFF-centric and runs orthogonal to ocular dominance columns. Because this ON-OFF organization originates from the clustering of ON and OFF thalamic afferents in the visual cortex, we conclude that all main features of visual cortical topography, including orientation, direction and retinal disparity, follow a common organizing principle that arranges thalamic axons with similar retinotopy and ON-OFF polarity in neighbouring cortical regions.


Figures

Extended Data Figure 1
Extended Data Figure 1. Measurements of ON/OFF responses and ocular dominance columns
a, ON and OFF receptive fields were mapped with light (ON) and dark (OFF) sparse noise and calculated from the response to the stimulus onset (gray shaded area). b, Horizontal penetrations that ran for more than 1.2 millimeters through a monocular band were assumed to be nearly parallel to ocular dominance columns (top) and those that alternated monocular responses for left and right eyes (bottom) were assumed to be nearly orthogonal to ocular dominance columns (bottom). Receptive fields normalized for ocular dominance. Icons on the left illustrate ocular dominance columns for contralateral (C) and ipsilateral (I) eyes (arrow illustrates horizontal penetration). Each receptive field box has a side of 27 degrees.
Extended Data Figure 2
Extended Data Figure 2. ON/OFF domains are matched across eyes
a, Integrating the ON/OFF receptive fields over 0.7 mm of horizontal cortical distance reveals ON and OFF receptive field subregions that are segregated in visual space and well matched between eyes. Notice the excellent binocular match of the receptive field subregions measured with light spots (left, two subregions displaced vertically in both eyes), and dark spots (middle left, one central subregion in both eyes). The ON-OFF receptive field difference also shows and excellent binocular match (middle right), therefore, the ON-OFF segregation can still be seen after combining the receptive fields of the two eyes (right). b, Integrating the ON/OFF receptive fields over a much longer distance (1.6 mm of cortex, different horizontal penetration) still reveals separate receptive field subregions with excellent binocular match. The 1.6-mm-average receptive-fields of the left and right eyes have both two ON subregions that are displaced diagonally and retinotopically matched (left). They also have two OFF subregions that are also displaced diagonally and retinotopically matched between the two eyes (middle left). A hint of the ON subregions can still be seen in the ON-OFF receptive field difference (middle right) and receptive field of both eyes combined (right), even if the receptive fields were averaged over 1.6 mm of cortex. Each square box framing a receptive field has a side of 16.2 degrees.
Extended Data Figure 3
Extended Data Figure 3. The OFF pathway may be the anchor of retinotopy also in the primary visual cortex of the macaque
ON/OFF retinotopy measured along 0.3 mm of horizontal cortical distance in macaque primary visual cortex (n=1 monkey). As in the cat, changes in OFF retinotopy are more restricted than changes in ON retinotopy in the receptive fields of both eyes. The panels labeled ‘average’ show the receptive fields averaged across cortical distance separately for each eye and both eyes. The plots labeled ‘retinotopy’ show the retinotopy of the receptive field pixel that generated the strongest ON (red) or OFF (blue) response, shown separately for each eye and both eyes. Each square box framing a receptive field has a side of 12 degrees.
Extended Data Figure 4
Extended Data Figure 4. Periodic changes in orientation preference
a, Color map showing normalized frequency of orientation difference between paired recordings measured at different cortical distances within a single horizontal penetration (same as figure 3k left). b, Difference in orientation preference between all possible paired recordings measured within the same horizontal penetration as in a (n = 496 paired comparisons, n=1 animal). c, Same as a but for multiple recording sites obtained from multiple penetrations (n = 20,672 paired comparisons, n=36 animals).
Extended Data Figure 5
Extended Data Figure 5. Additional examples of horizontal recordings showing a correlation between changes in ON-OFF retinotopy and orientation preference
a, Horizontal recording through 0.9 mm of cortex. From top to bottom, the first three panel rows show series of OFF, ON and ON-OFF receptive fields (left) and receptive fields averaged across horizontal cortical distance (right). The bottom row shows the orientation/direction tuning (left) and the retinotopy of the strongest response within each receptive field (right, ON: red, OFF, blue). The small circles in the orientation plots illustrate the preferred orientation predicted from the ON-OFF receptive field. b–c, Horizontal recordings through binocular regions of 0.5 mm (b) and 0.7 mm length (c). Notice the accurate binocular match in ON/OFF retinotopy between the two eyes and also the striking binocular similarity in orientation preference, direction preference and orientation/direction selectivity. Each receptive field box has a side of 27 (a), 23 (b) or 23.6 degrees (c).
Extended Data Figure 6
Extended Data Figure 6. Example of a horizontal penetration in which we recorded from several single neurons separated by 0.1 mm distances
Format is similar to Figure 4a and Extended Data Figure 5a. The only difference is that the receptive fields and orientation plots were obtained from single neurons instead of multiunit activity. The last row shows spike waveforms from each single neuron (average and standard deviation). Each square box framing a receptive field has a side of 23 degrees.
Extended Data Figure 7
Extended Data Figure 7. Example of a cortical region in which OFF retinotopy rotates around ON retinotopy
The figure shows a series of receptive fields mapped with dark (OFF) and light stimuli (ON) and the ON-OFF receptive field difference. The last receptive field on the right for each row shows the average of all receptive fields across 0.8 mm of cortical distance. The plot on the right shows the retinotopy of the ON (red) and OFF (blue) receptive fields. Cortical regions showing OFF retinotopy rotating around ON retinotopy were more difficult to find than regions where ON retinotopy rotated around OFF retinotopy. To estimate the relative frequency of ON and OFF retinotopy rotations, we measured the distance between the retinotopic center of mass of single horizontal penetrations for each ON or OFF receptive fields (81 penetrations with receptive field measurements from at least 5 recording sites per penetration). We then calculated a ratio of the average distances, as (ON-OFF)/(ON+OFF), and used a ratio of 0.5 as an arbitrary threshold to classify a penetration as OFF-anchored (ON rotates around OFF) or ON-anchored (OFF rotates around ON). Based on this criterion, there were 3.75 more penetrations OFF-anchored than ON-anchored (15 vs. 4 penetrations, n=17 animals). Each square box framing a receptive field has a side of 19.4 degrees.
Figure 1
Figure 1. Recording from the horizontal dimension of visual cortex
a, Recording configuration. b, Left, receptive fields mapped with light (ON) and dark (OFF) spots and ON-OFF receptive field difference. Right, orientation preference predicted with a two-dimensional Fast-Fourier-Transform (FFT) from the ON-OFF receptive field difference. c, Orientation/direction tuning shown as response plots (left) and polar plots (right). d, Changes in orientation and direction preference across horizontal cortical distance.
Figure 2
Figure 2. Topographic organization of ON and OFF cortical domains
a, Example of a recording running parallel to an ocular dominance band. Icon on the left illustrates the recording (arrow) relative to the contralateral (C) and ipsilateral (I) bands. From top to bottom, the figure shows orientation tuning (polar and response plots), maximum ON (red) and OFF (blue) responses at each cortical site (line plot) and changes in ON and OFF receptive field position with cortical distance. b, Recording running perpendicular to ocular dominance bands (icon on the left) for contralateral (black) and ipsilateral (orange) eyes (continuous and dashed traces in line plots). c, Cross-correlation between ON and OFF response-profiles (red and blue lines in a and b) in penetrations tangential (left) and perpendicular to ocular-dominance bands (right). d, Average correlation between ON and OFF response profiles in tangential penetrations (n=5 penetrations, n=5 animals) and perpendicular penetrations (n=6 penetrations, n=4 animals). e–g, Averages for spatial scale, 1/2 period and full period of ON/OFF correlation (average differences are not significant). All error bars are standard deviations. Statistical comparisons made with two-sided Wilcoxon tests.
Figure 3
Figure 3. Cortical topographic relationships between ON/OFF, retinotopy and orientation preference
a, Topography and retinotopy of two ON domains (receptive fields shown at the top). b, OFF domains (n=20 domains, n=12 animals) are wider than ON domains (n=24 domains, n=12 animals). c, Domains of same sign (n=16 domains, n=12 animals) are separated by twice the distance than domains of different sign (n=31 domains, n=12 animals). d, Retinotopy changes more across domains of same sign (n=65 domains, n=20 animals) than within domains (n=125 domains, n=20 animals). e, Retinotopy changes more between domains of different sign (n=31 pairs of domains, n=12 animals) than same sign (n=16 pairs of domains, n=12 animals). f, Example recording showing smooth changes in retinotopy with cortical distance at 0.5 RF/mm (n=496 paired comparisons, RF: receptive field). g, The OFF pathway anchors the cortical retinotopy of both monocular (top) and binocular receptive fields (bottom, contralateral: black: ipsilateral: orange). ON responses (red) rotate around OFF responses (blue), as illustrated by individual series of receptive fields (left), receptive fields averaged across cortical distance (Average) and retinotopy of strongest ON and OFF responses (Retinot.). h, Retinotopy changes with cortical distance for ON, OFF and ON-OFF responses (red: maximum, blue: minimum). Dotted lines show 20% of maximum ON responses (n=2,603 paired comparisons, n=8 animals). i, Retinotopy changes are more restricted for OFF than ON responses (n=962 ON and 962 OFF paired-comparisons, n=23 animals). j, Binocular retinal disparity is smallest when measured between OFF subregions (top, n=502 for ON-OFF, 251 for ON-ON and 251 for OFF-OFF subregions, n=28 animals). ON retinal disparity changes more with differences in spatial-phase than OFF (bottom). k, Periodicity in orientation preference across horizontal cortical distance within a single penetration (left) and across penetrations (middle, n=618 paired comparisons, n=37 animals). The orientation periodicity resembles the periodicity of the ON/OFF correlation (right, n=11 penetrations, n=8 animals). l, Retinotopy difference between subregions of different sign falls rapidly with cortical distance (n=13,416 paired comparisons, n=23 animals). m, Receptive field similarity also decays with cortical distance but at a slower rate (n=4,128 paired comparisons, n=23 animals). All error bars are standard errors. * p<0.05, *** p<0.0001 with two-sided Wilcoxon tests.
Figure 4
Figure 4. Changes in retinotopy explain changes in orientation and direction preference throughout the cortex
a, Horizontal penetration showing a strong relationship between changes in ON/OFF retinotopy and orientation preference. Responses to light stimuli (middle) rotate around responses to dark stimuli (top) as seen in the dark-light difference (bottom). The orientation/direction tuning and ON/OFF retinotopy are shown below the color panels (small circles in polar plots are orientation predictions based on dark-light receptive fields). b, Predicted/measured comparisons in 109 penetrations (916 recording sites, n=26 animals) that passed our selection criteria (see methods; dashed lines mark maximum possible mismatch). c, Normalized count of differences between measurements and predictions (median: 17.3 degrees). d, Horizontal penetration passing through a pinwheel (at 0.5–0.6 mm) that was completely OFF dominated. e, Pinwheel centers (aligned at cortical distance zero) tended to have higher absolute contrast polarity (either strong OFF or ON dominance) than their cortical neighborhood (n=19 penetrations, n=13 animals; p<0.0001 for difference in orientation selectivity and p=0.039 for difference in absolute contrast polarity when comparing 0 and ± 0.3 mm, one-sided Wilcoxon tests). f, Histogram showing the contrast polarity of the 19 pinwheels from e. g, Horizontal penetration passing through regions with abrupt changes in direction preference (between 0.1 to 0.3 mm and 0.6 to 0.7 mm). Abrupt changes in direction were associated with abrupt changes in retinotopy (arrows at the top and line plots at the bottom). h, Aligning direction reversals at cortical distance zero (n=24 penetration sections, n=10 animals) revealed a strong association between direction and retinotopy changes (RF pos). All error bars are standard errors.
Figure 5
Figure 5. Principles underlying sensory map topography in primary visual cortex
a, ON and OFF domains run perpendicular to ocular dominance columns and are separated by ~0.5 mm from each other. Retinotopy changes smoothly at ~0.5 RF/mm. b, Schematic of how the thalamo-cortical architecture could make ON receptive fields rotate around OFF receptive fields. c, Cartoon explaining how changes in ON/OFF retinotopy result in changes in orientation/direction preference.

References

    1. Blasdel GG, Salama G. Voltage-sensitive dyes reveal a modular organization in monkey striate cortex. Nature. 1986;321:579–585. doi: 10.1038/321579a0. - DOI - PubMed
    1. Bonhoeffer T, Grinvald A. Iso-orientation domains in cat visual cortex are arranged in pinwheel-like patterns. Nature. 1991;353:429–431. doi: 10.1038/353429a0. - DOI - PubMed
    1. Ohki K, et al. Highly ordered arrangement of single neurons in orientation pinwheels. Nature. 2006;442:925–928. doi: 10.1038/nature05019. - DOI - PubMed
    1. Kaschube M, et al. Universality in the evolution of orientation columns in the visual cortex. Science. 2010;330:1113–1116. doi: 10.1126/science.1194869. - DOI - PMC - PubMed
    1. Nauhaus I, Nielsen KJ. Building maps from maps in primary visual cortex. Current opinion in neurobiology. 2014;24:1–6. doi: 10.1016/j.conb.2013.08.007. - DOI - PubMed

Publication types

MeSH terms