Review
. 2017 Apr;30(4):10.1002/nbm.3540.
doi: 10.1002/nbm.3540. Epub 2016 Apr 27.

Susceptibility tensor imaging (STI) of the brain

Affiliations
Review

Susceptibility tensor imaging (STI) of the brain

Wei Li et al. NMR Biomed. 2017 Apr.

Abstract

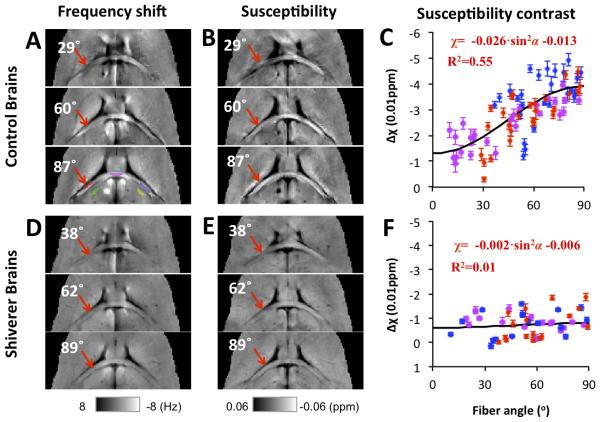
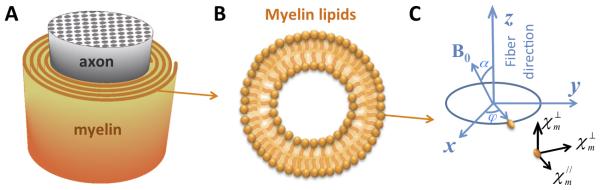
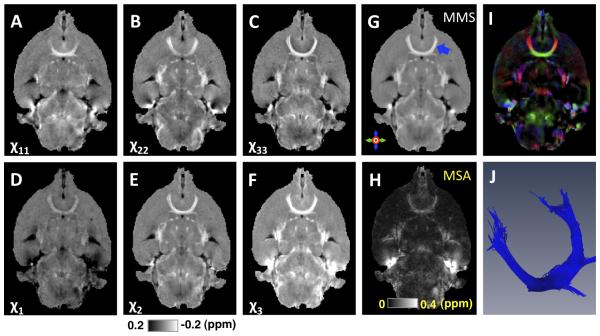
Susceptibility tensor imaging (STI) is a recently developed MRI technique that allows quantitative determination of orientation-independent magnetic susceptibility parameters from the dependence of gradient echo signal phase on the orientation of biological tissues with respect to the main magnetic field. By modeling the magnetic susceptibility of each voxel as a symmetric rank-2 tensor, individual magnetic susceptibility tensor elements as well as the mean magnetic susceptibility and magnetic susceptibility anisotropy can be determined for brain tissues that would still show orientation dependence after conventional scalar-based quantitative susceptibility mapping to remove such dependence. Similar to diffusion tensor imaging, STI allows mapping of brain white matter fiber orientations and reconstruction of 3D white matter pathways using the principal eigenvectors of the susceptibility tensor. In contrast to diffusion anisotropy, the main determinant factor of the susceptibility anisotropy in brain white matter is myelin. Another unique feature of the susceptibility anisotropy of white matter is its sensitivity to gadolinium-based contrast agents. Mechanistically, MRI-observed susceptibility anisotropy is mainly attributed to the highly ordered lipid molecules in the myelin sheath. STI provides a consistent interpretation of the dependence of phase and susceptibility on orientation at multiple scales. This article reviews the key experimental findings and physical theories that led to the development of STI, its practical implementations, and its applications for brain research. Copyright © 2016 John Wiley & Sons, Ltd.

Keywords: brain imaging; fiber tracking; gradient echo MRI; phase contrast; quantitative susceptibility mapping; susceptibility tensor imaging; white matter.


Figures

Figure 1
Figure 1. Orientation dependence of susceptibility in brains of normal and dysmyelinating shiverer mice
A and D: frequency maps from 3 selected brain orientations. A representative selection of ROIs is shown in the lower panel of A, with ROIs in white matter labeled red, magenta, and blue, and ROIs in adjacent gray matter green, cyan, and yellow. B and E: magnetic susceptibility maps calculated from the frequency shifts shown in A and D using QSM. C and F: susceptibility of white matter referenced to adjacent gray matter. All data points are shown as mean ± standard error over the voxels in each selected ROI. Susceptibility anisotropy is observed in those control mice but not in shiverer mice. The angles shown on the images are the angles between the direction of the white matter segment at the red ROI and the main field as determined by DTI, i.e., 0º means that the selected fiber segment is parallel to the main magnetic field. The ROI color in panel A corresponds to the data point color in panels C and F. Reprinted, with permission, from Figure 2, reference (39).
Figure 2
Figure 2. The axon and molecular coordinate systems
(A) Schematic representation of the spiraling myelin sheath around an axon. (B) Schematic representation of the radial alignment of myelin lipid molecules. (C) The axon coordinate system (x, y and z) and the molecular susceptibility tensor of a myelin lipid molecule in its molecular coordinate system.
Figure 3
Figure 3. STI of a mouse brain ex vivo
A-C: Maps of the diagonal terms of the susceptibility tensors in the subject frame. D-F: Maps of the eigenvalues of the susceptibility tensors, i.e. the susceptibilities in the local diagonal frame. G: Mean magnetic susceptibility (MMS, i.e.χ). H: magnetic susceptibility anisotropy (MSA, i.e. χχ). I: Color map of the principal eigenvector (PEV) corresponding to the most paramagnetic eigenvalue of the susceptibility tensor weighted by susceptibility index as in (37). J: Anterior commissure (corresponding to the blue arrow in G) reconstructed using STI. In panels A-G, higher intensity indicates more diamagnetic susceptibility (opposite from QSM). The mouse brain was perfused with a mixture of 0.9% saline and ProHance (10:1, v:v) (Bracco Diagnostics, Princeton, NJ), then followed by a mixture of 10% buffered formalin and ProHance (10:1, v:v). This figure was reproduced with permission from reference (37).
Figure 4
Figure 4. STI of the human brain
A-C: Maps of the diagonal terms of the susceptibility tensors in the subject frame. D-F: Maps of the eigenvalues of the susceptibility tensors, i.e. the susceptibilities in the local diagonal frame. G: MMS color coded using the PEV corresponding to the most paramagnetic eigenvalue of the susceptibility tensor. H: DTI fractional anisotropy (FA) map color coded using the largest diffusion eigenvector. This figure was reproduced with permission from reference (39). In panels A-F, higher intensity indicates more diamagnetic susceptibility (opposite from QSM).
Figure 5
Figure 5. Comparisons of STI, MMSR-STI and DTI in human brain
A-C: MMS, MSA and PEV obtained by STI in a healthy control subject using GRE phase data collected at 10 head orientations at 3T. D-F: corresponding MMS, MSA and PEV obtained by MMSR-STI method that uses image space constraints to regularize the STI inverse. G-I, mean diffusivity (MD), FA and PEV obtained by DTI. All the PEV maps were masked by a white matter mask generated by thresholding the DTI FA map (FA>0.25). In panels A and D higher intensity indicates more diamagnetic susceptibility (opposite from QSM). This figure was reproduced with permission from reference (42).
Figure 6
Figure 6. Susceptibility tensor mapping of human brain assuming cylindrical symmetry
A-D: different views of the MMS obtained in a healthy control subject using phase data at 4 head orientations at 7T. E-H: corresponding MSA map. I-L: DTI color maps, i.e. DTI FA map color coded using DTI PEV. This figure was reproduced with permission from reference (40).
Figure 7
Figure 7. Comparison of STI and DTI fiber tracts in selected pathways
(A) The anterior commissure; (B) the hippocampal commissure; (C) the posterior corpus callosum. In general, similar fiber tracts are reconstructed with both techniques while DTI tracts appear to be smoother at the edges of the fiber bundles. This figure was reprinted, with permission, from reference (37).

References

    1. Duyn JH, van Gelderen P, Li TQ, de Zwart JA, Koretsky AP, Fukunaga M. High-field MRI of brain cortical substructure based on signal phase. Proc Natl Acad Sci U S A. 2007;104(28):11796–11801. - PMC - PubMed
    1. Salomir R, De Senneville BD, Moonen CTW. A fast calculation method for magnetic field inhomogeneity due to an arbitrary distribution of bulk susceptibility. Concepts in Magnetic Resonance Part B-Magnetic Resonance Engineering. 2003;19B(1):26–34.
    1. Marques JP, Bowtell R. Application of a fourier-based method for rapid calculation of field inhomogeneity due to spatial variation of magnetic susceptibility. Concepts in Magnetic Resonance Part B-Magnetic Resonance Engineering. 2005;25B(1):65–78.
    1. Shmueli K, de Zwart JA, van Gelderen P, Li TQ, Dodd SJ, Duyn JH. Magnetic susceptibility mapping of brain tissue in vivo using MRI phase data. Magn Reson Med. 2009;62(6):1510–1522. - PMC - PubMed
    1. Liu T, Spincemaille P, de Rochefort L, Kressler B, Wang Y. Calculation of susceptibility through multiple orientation sampling (COSMOS): a method for conditioning the inverse problem from measured magnetic field map to susceptibility source image in MRI. Magnetic Resonance in Medicine. 2009;61(1):196–204. - PubMed

MeSH terms