. 2016 Apr 25;8(4):117.
doi: 10.3390/v8040117.

Glutamic Acid Residues in HIV-1 p6 Regulate Virus Budding and Membrane Association of Gag

Affiliations

Glutamic Acid Residues in HIV-1 p6 Regulate Virus Budding and Membrane Association of Gag

Melanie Friedrich et al. Viruses. .

Abstract

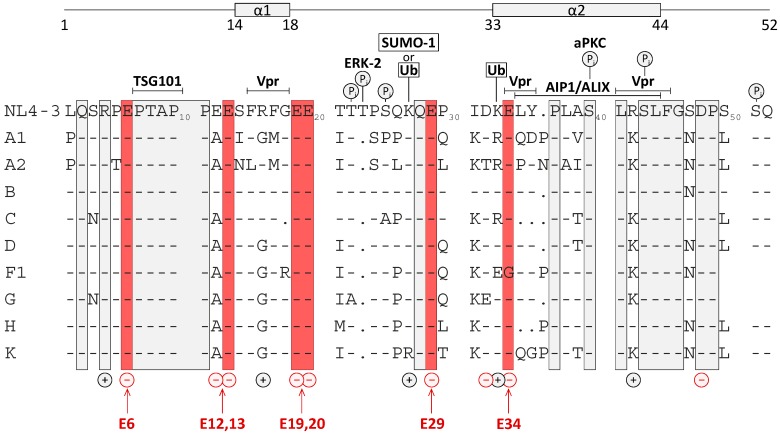
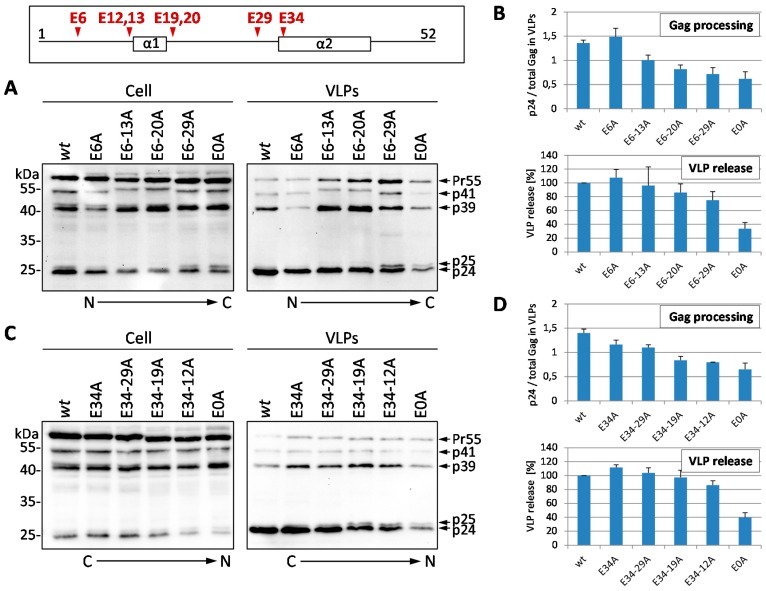
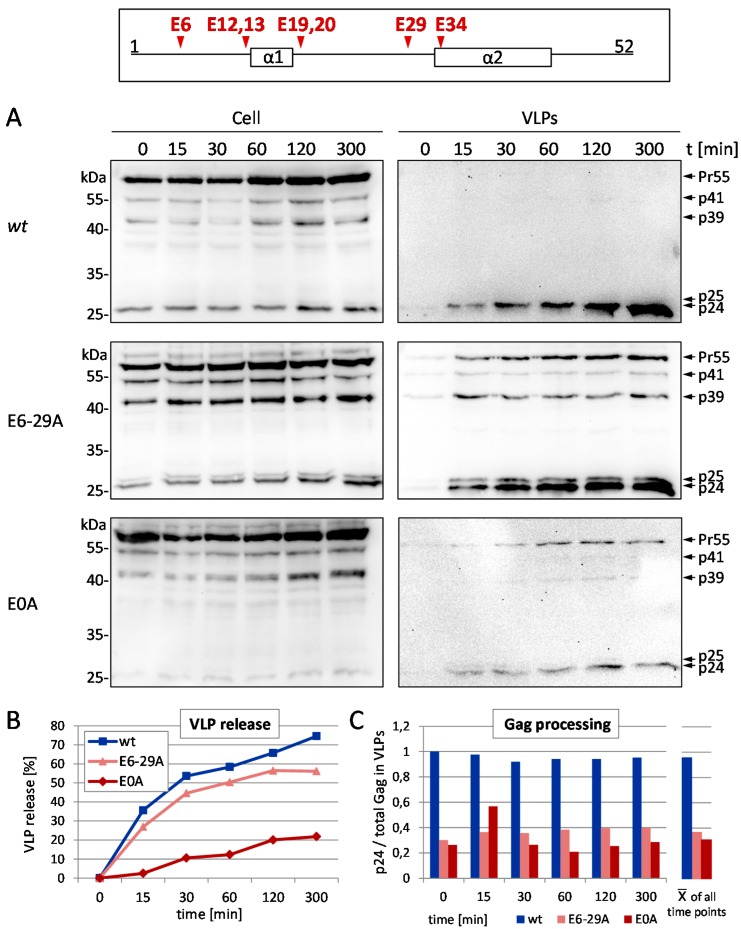
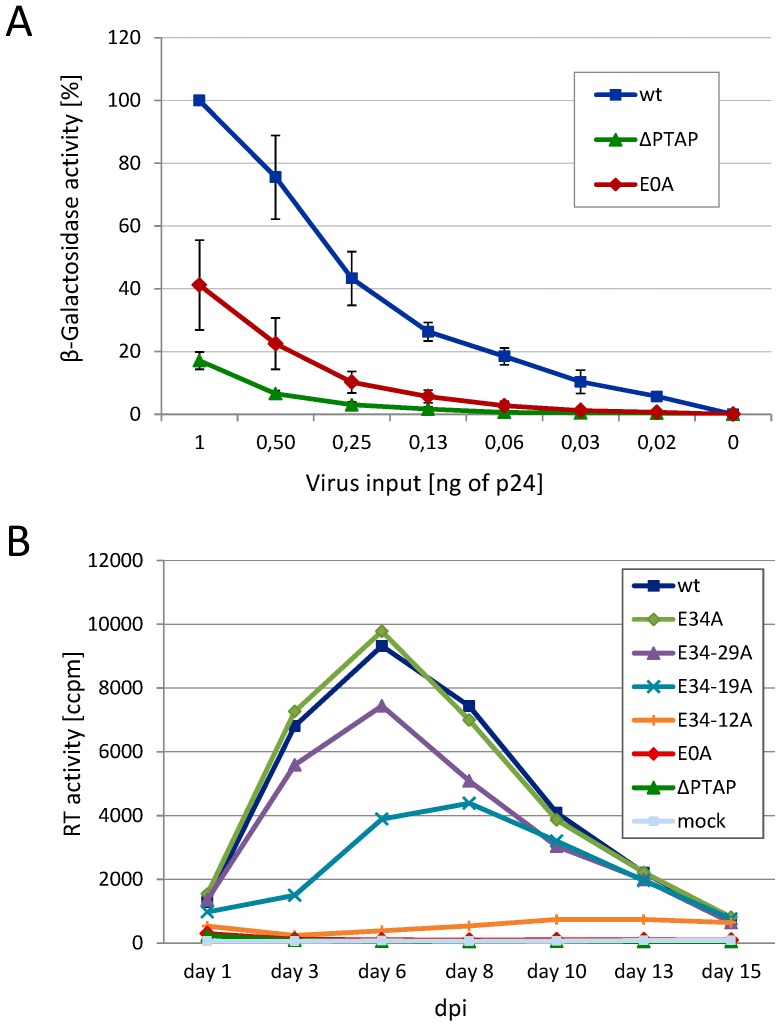
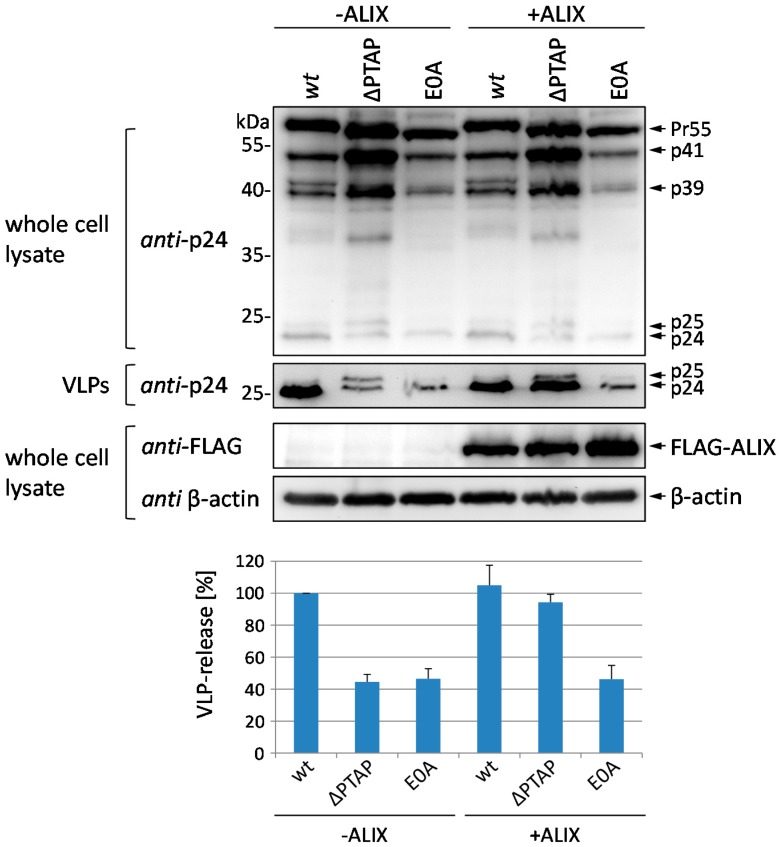
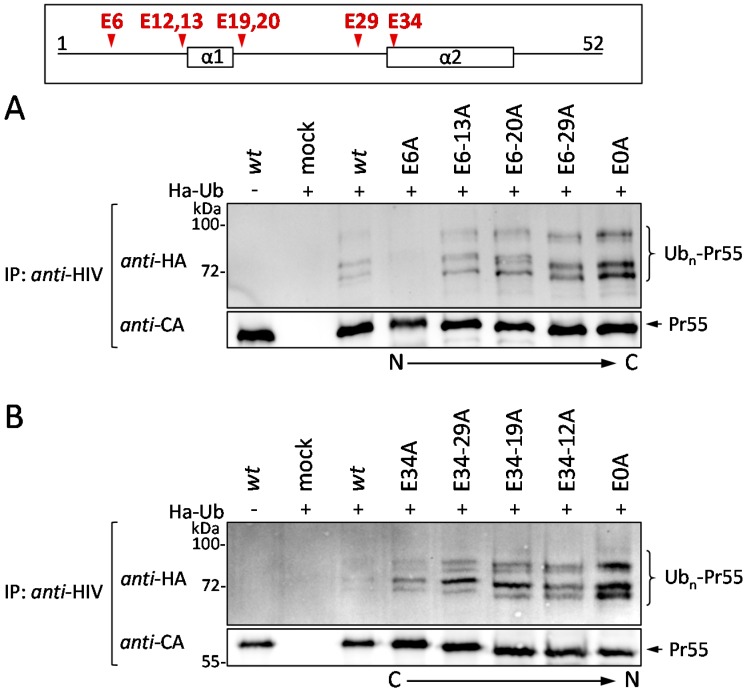
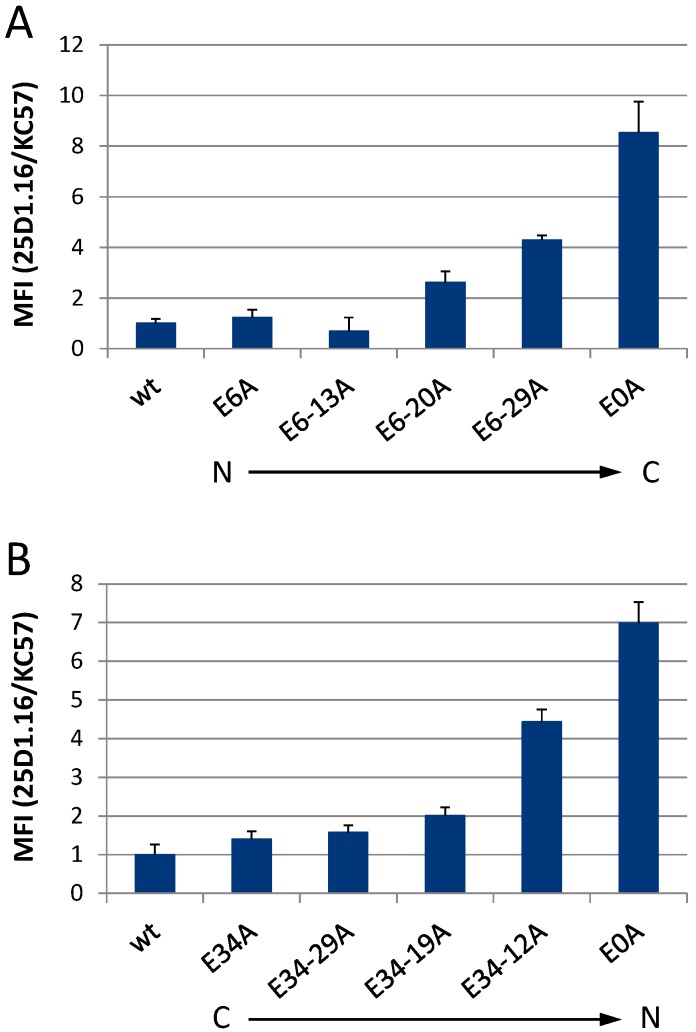
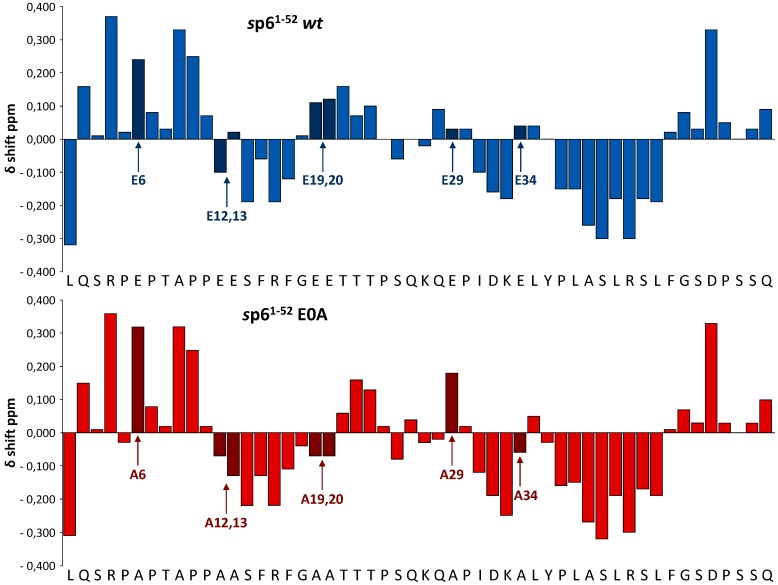
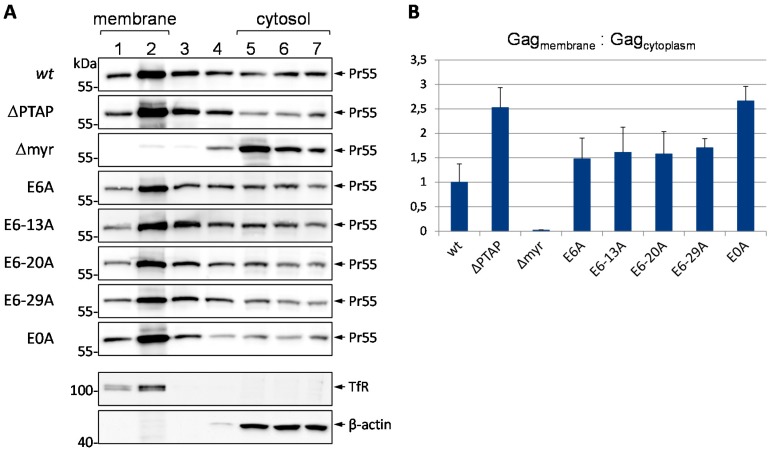
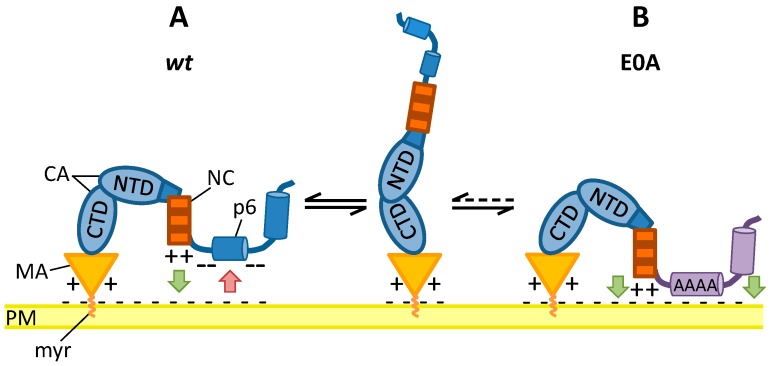
The HIV-1 Gag p6 protein regulates the final abscission step of nascent virions from the cell membrane by the action of its two late (L-) domains, which recruit Tsg101 and ALIX, components of the ESCRT system. Even though p6 consists of only 52 amino acids, it is encoded by one of the most polymorphic regions of the HIV-1 gag gene and undergoes various posttranslational modifications including sumoylation, ubiquitination, and phosphorylation. In addition, it mediates the incorporation of the HIV-1 accessory protein Vpr into budding virions. Despite its small size, p6 exhibits an unusually high charge density. In this study, we show that mutation of the conserved glutamic acids within p6 increases the membrane association of Pr55 Gag followed by enhanced polyubiquitination and MHC-I antigen presentation of Gag-derived epitopes, possibly due to prolonged exposure to membrane bound E3 ligases. The replication capacity of the total glutamic acid mutant E0A was almost completely impaired, which was accompanied by defective virus release that could not be rescued by ALIX overexpression. Altogether, our data indicate that the glutamic acids within p6 contribute to the late steps of viral replication and may contribute to the interaction of Gag with the plasma membrane.

Keywords: ">l-domains; ALIX; ESCRT; Gag p6; HIV-1; Tsg101; membrane association; ubiquitination; virus budding.


Figures

Figure 1
Figure 1
Amino acid sequence of p6 derived from the isolate HIV-1NL4-3 with previously identified structural and functional domains [50], charge distribution and sites of posttranslational modifications. Delineated in red are conserved Glu residues at positions 6, 13, 19, 20, 29, and 34. Positively and negatively charged residues, previously identified phosphorylation sites for ERK-2 and aPKC [35,36], attachment sites for ubiquitin [21] and SUMO-1 [22], binding domains for Tsg101 [8,9,10,34,51], ALIX [12], and Vpr [49] and structural domains identified by NMR [50] are indicated. Consensus sequences of p6 proteins derived from the M-group viruses [52] were aligned and conserved amino acids are boxed in grey.
Figure 2
Figure 2
Successive mutation of glutamic acids in p6 leads to a dose-dependent defect in Gag processing and impaired VLP release. (A,C) HeLa cells were transiently transfected with the HIV-1 expression plasmid pNLenv1, coding either for the wt or mutants carrying Glu to Ala mutations, either from the N- (A) or from the C-terminus (C) of p6. Whole cell lysates and VLP fractions were analyzed by western blotting using anti-CA antibodies (B,D). The VLP release was calculated as the amount of CA in the VLP fraction relative to the total amount of Gag detected in cell and VLP fractions. Values on the y-axis were adjusted to 100% for wt. Rate of Gag processing was calculated as the amount of CA relative to the total amount of Gag in each VLP fraction. Resulting ratios were normalized by mean of all values of each experiment (adapted from [53]). Values on the y-axis represent arbitrary units. Bars represent the mean values of 3 independent experiments ± SD.
Figure 3
Figure 3
Mutation of all glutamic acids within p6 inhibits VLP release and Gag maturation. (A) HeLa cells were transiently transfected with pNLenv1 wt or the Glu mutants E6-29A and E0A. VLP release was quantified by western blot time course analyses; (B) The percentage of VLPs released over time was calculated as the amount of CA detected in the VLP fraction versus the total amount of Gag recovered from cell and VLP fractions; (C) Gag processing was calculated as the amount of CA relative to the total amount of Gag in the VLP fraction. Values on the y-axis was adjusted to 1 for wt at t = 0.
Figure 4
Figure 4
Mutation of glutamic acids reduces the infectivity and replication capacity of HIV-1. (A) TZM-bl cells were infected with VSV-G pseudotyped pNLenv1 VLP stocks, standardized for p24. Infectious titers were determined by measuring the β-galactosidase activity. Bars represent the mean values of 3 independent experiments ± SD; (B) Infection of human lymphoid aggregate cultures (HLAC) with 1 ng virus standardized for p24 of HIV-1NL4-3 wt or the respective Glu mutants. Replication was assessed by quantification of the reverse transcriptase activity in cell culture supernatant collected every second or third day post infection (dpi) during 15 days of cultivation.
Figure 5
Figure 5
Defect in virus release of the E0A mutant cannot be rescued by ALIX overexpression. (A) HeLa cells were co-transfected with pNLenv1 expression plasmids coding for wt, ∆PTAP or E0A and with FLAG-ALIX or empty control plasmids, respectively. VLP fractions and whole cell lysates were analyzed by western blot using an anti-CA. ALIX expression was detected using anti-FLAG antibodies; (B) VLP release was calculated as the amount of CA in the VLP fraction relative to the total amount of Gag detected in cells and VLPs. Bars represent the mean values of 3 independent experiments ± SD. Values on the y-axis were adjusted to 100% for wt.
Figure 6
Figure 6
Successive mutation of the glutamic acids in p6 gradually increases HIV-1 Gag ubiquitination. (A,B) HeLa cells were co-transfected with HA-tagged ubiquitin and pNLenv1 expression plasmids as indicated. Gag was immunoprecipitated from whole cell lysates using anti-HIV antibodies and Gag ubiquitination was detected by western blot stained for HA. The amount of precipitated Gag was detected by anti-CA staining.
Figure 7
Figure 7
Successive mutation of the glutamic acids within p6 progressively increases the MHC-I antigen presentation of Gag-derived epitopes. HeLa-Kb cells were transiently transfected with pNLenv1-SL expression plasmids coding for wt or the sequential Glu mutants of p6 from (A) the N- to the C-terminus or (B) the C- to the N-terminus, respectively. H2-Kb-SL complexes presented on the surface of Gag-positive cells were quantified by flow cytometry using the mAb 25D1.16-APC [58]. After fixation and permeabilization, intracellular Gag was stained with anti-Gag Ab KC57-FITC. The mean fluorescence intensity (MFI) of the 25D1.16 staining, normalized to the MFI of the intracellular anti-Gag staining (see Figure S2) is shown. Bars represent mean values ± SD from three independent experiments.
Figure 8
Figure 8
Mutation of Glu residues to Ala extends the N-terminal α-helix of p6. Chemical shift differences (ppm) of the α-protons between the experimental values and those for residues in a random coil for p6 wt [50] compared with the E0A mutant in 50% aqueous TFE-D2 at pH 3 at 300 K. All positive values for N-terminal residues adjacent to proline residues arise from an inherent effect of proline and not out of a structural perturbation, as described in ref. [62].
Figure 9
Figure 9
The mutations of Glu residues increase the membrane association of Pr55 Gag. (A) HeLa cells were transfected with syngag expression constructs coding for wt Gag, the p6 mutants ∆PTAP, E6A, E6-13A, E6-20A, E6-29A, E0A or the MA G2A mutant (∆myr). The cells were lysed by sonication and membrane flotation was performed. The fractions were collected and analyzed by western blot stained for CA. The western blots were reprobed with antibodies specific for β-actin and the transferrin receptor (TfR) to determine the cytosolic or membrane fractions, respectively. One representative example of the β-actin and TfR staining is shown; (B) The ratio of Pr55 Gag in the membrane fractions (1 and 2) vs. the cytosolic fractions (5 to 7) was calculated. Values on the y-axis were adjusted to 1 for wt. Bars represent the mean values of at least 3 independent experiments ± SD.
Figure 10
Figure 10
Hypothetical model of regulation of Gag membrane interaction. Green arrows indicate attraction, red arrows indicate repulsion. CTD: C-terminal domain; NTD: N-terminal domain; PM: plasma membrane.

Similar articles

Cited by

References

    1. Sundquist W.I., Krausslich H.G. HIV-1 assembly, budding, and maturation. Cold Spring Harb. Perspect. Med. 2012;2 doi: 10.1101/cshperspect.a015420. - DOI - PMC - PubMed
    1. Freed E.O. HIV-1 assembly, release and maturation. Nat. Rev. Microbiol. 2015;13:484–496. doi: 10.1038/nrmicro3490. - DOI - PMC - PubMed
    1. Wills J.W., Craven R.C. Form, function, and use of retroviral Gag proteins. AIDS. 1991;5:639–654. doi: 10.1097/00002030-199106000-00002. - DOI - PubMed
    1. Gottlinger H.G., Sodroski J.G., Haseltine W.A. Role of capsid precursor processing and myristoylation in morphogenesis and infectivity of human immunodeficiency virus type 1. Proc. Natl. Acad. Sci. USA. 1989;86:5781–5785. doi: 10.1073/pnas.86.15.5781. - DOI - PMC - PubMed
    1. Zhou W., Parent L.J., Wills J.W., Resh M.D. Identification of a membrane-binding domain within the amino-terminal region of human immunodeficiency virus type 1 Gag protein which interacts with acidic phospholipids. J. Virol. 1994;68:2556–2569. - PMC - PubMed

Publication types

MeSH terms

Substances

LinkOut - more resources