. 2016 May 17;7(20):29548-62.
doi: 10.18632/oncotarget.8794.

Hypoxia promotes Rab5 activation, leading to tumor cell migration, invasion and metastasis

Affiliations

Hypoxia promotes Rab5 activation, leading to tumor cell migration, invasion and metastasis

Patricio Silva et al. Oncotarget. .

Abstract

Hypoxia, a common condition of the tumor microenvironment, is associated with poor patient prognosis, tumor cell migration, invasion and metastasis. Recent evidence suggests that hypoxia alters endosome dynamics in tumor cells, leading to augmented cell proliferation and migration and this is particularly relevant, because endosomal components have been shown to be deregulated in cancer. The early endosome protein Rab5 is a small GTPase that promotes integrin trafficking, focal adhesion turnover, Rac1 activation, tumor cell migration and invasion. However, the role of Rab5 and downstream events in hypoxia remain unknown. Here, we identify Rab5 as a critical player in hypoxia-driven tumor cell migration, invasion and metastasis. Exposure of A549 human lung carcinoma, ZR-75, MDA-MB-231 and MCF-7 human breast cancer and B16-F10 mouse melanoma cells to hypoxia increased Rab5 activation, followed by its re-localization to the leading edge and association with focal adhesions. Importantly, Rab5 was required for hypoxia-driven cell migration, FAK phosphorylation and Rac1 activation, as shown by shRNA-targeting and transfection assays with Rab5 mutants. Intriguingly, the effect of hypoxia on both Rab5 activity and migration was substantially higher in metastatic B16-F10 cells than in poorly invasive B16-F0 cells. Furthermore, exogenous expression of Rab5 in B16-F0 cells predisposed to hypoxia-induced migration, whereas expression of the inactive mutant Rab5/S34N prevented the migration of B16-F10 cells induced by hypoxia. Finally, using an in vivo syngenic C57BL/6 mouse model, Rab5 expression was shown to be required for hypoxia-induced metastasis. In summary, these findings identify Rab5 as a key mediator of hypoxia-induced tumor cell migration, invasion and metastasis.

Keywords: Rab5; hypoxia; metastasis; migration; tumor.


Conflict of interest statement

The authors declare no conflicts of interest.

Figures
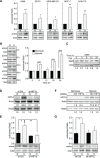
Figure 1
Figure 1. Hypoxia promotes Rab5-GTP loading in tumor cells
A. A549, ZR-75, MDA-MB-231, MCF-7 and B16-F10 cells were incubated in normoxia (N) or hypoxia (1% O2, H) for 24 hours and whole cell lysates were prepared. Rab5-GTP levels were determined by the R5BD pull-down assay. Lower panels, representative Western blot images from four independent experiments are shown. Upper graphs, relative Rab5-GTP levels normalized to total Rab5 by scanning densitometry are shown as the fold increase with respect to normoxia. Data represent the average of four independent experiments (mean ± s.e.m.). *P<0.05; **P<0.01. B. A549 cells were incubated in normoxia (N) or hypoxia (H) for different time periods as indicated, and Rab5-GTP levels were determined, as indicated in (A). Left panels, representative Western blot images from four independent experiments are shown. Right graph, relative Rab5-GTP levels were determined as indicated in (A). Data represent the average of four independent experiments (mean ± s.e.m.). **P<0.01. C. A549 cells were exposed to hypoxia (1% O2) for 0, 3, 6, 12 and 24 hours, and then, whole cell lysates were prepared and analyzed by Western blotting. Rab5 and actin were detected by immunoblotting. Representative images are shown. Numerical data below panel represent the scanning densitometry analysis of Rab5 levels normalized to actin from four independent measurements (mean ± s.e.m.) and are summarized as follows: normoxia (1.0 ± 0.04), hypoxia 3 hrs (0.7 ± 0.08), hypoxia 6 hours (1.0 ± 0.08), hypoxia 12 hours (0.9 ± 0.06), hypoxia 24 hours (1.0 ± 0.1). It should be noted that homogenization protocols were different in B and C (for details, see materials and methods), and hence the time course experiments cannot be combined in a single panel. (D, E) A549 cells were transfected with control or HIF-1α targeting siRNA constructs and exposed to normoxia or hypoxia for 24 hours. D. Whole cell lysates were prepared and analyzed by Western bloting with antibodies against HIF-1α, Rab5 and actin. Representative images are shown. Numerical data below each panel represent the average from three experiments evaluated by scanning densitometry analysis of HIF-1α and Rab5 levels, normalized to actin, and summarized as follows. HIF-1α: si-Ctrl normoxia (1.00 ± 0.01), si-Ctrl hypoxia (52.6 ± 4.7), si-HIF-1α normoxia (0.10 ± 0.05), si-HIF-1α hypoxia (0.75 ± 0.51). Rab5: si-Ctrl normoxia (1.00 ± 0.23), si-Ctrl hypoxia (1.19 ± 0.40), si-HIF-1α normoxia (1.04 ± 0.15), si-HIF-1α hypoxia (1.24 ± 0.07). *P<0.05, compared to si-Ctrl hypoxia. E. Rab5-GTP levels were measured by pull-down. Representative Western blot images are shown. The graph indicates the fold increase, obtained by scanning densitometry analysis and normalized to total Rab5. Data were averaged from three independent experiments (mean ± s.e.m.). *P<0.05; **P<0.01. (F, G). A549 cells were stably transfected with control or HIF-1α targeting shRNA constructs and exposed to normoxia or hypoxia for 24 hours. F. Whole cell lysates were prepared and analyzed by Western blotting with antibodies against HIF-1α, Rab5 and actin. Representative images are shown. Numerical data below each panel represent the average from three experiments evaluated by scanning densitometry analysis of HIF-1α and Rab5 levels, normalized to actin, and summarized as follows. HIF-1α: sh-Ctrl normoxia (1.00 ± 0.54), sh-Ctrl hypoxia (71.9 ± 0.2), sh-HIF-1α normoxia (0.38 ± 0.16), sh-HIF-1α hypoxia (41.1 ± 1.9). Rab5: sh-Ctrl normoxia (1.00 ± 0.16), sh-Ctrl hypoxia (1.20 ± 0.24), sh-HIF-1α normoxia (1.27 ± 0.08), sh-HIF-1α hypoxia (1.17 ± 0.13). *P<0.05, compared to sh-Ctrl hypoxia. G. Rab5-GTP levels were measured by pull-down assays. Representative Western blot images are shown. The graph indicates the fold of increase, obtained by scanning densitometry analysis and normalized to total Rab5. Data were averaged from three independent experiments (mean ± s.e.m.). *P<0.05.
Figure 2
Figure 2. Hypoxia increases the association of Rab5 with focal adhesion proteins
A. A549 cells were grown on glass coverslips, co-transfected with GFP-actin and the mCherry or mCherry-R5BD constructs previously described [20], and then incubated under normoxic or hypoxic conditions for 24 hours. Samples were fixed and analyzed by confocal microscopy. Left panels, representative images are shown. Bar represents 10 μm. Right panels are magnifications of boxed areas. Graph, the percentage of cells exhibiting peripheral accumulation of mCherry was determined as described in the materials and methods. At least 156 cells per condition were analyzed. Data represent the average of four independent experiments (mean ± s.e.m.). Statistically significant differences are indicated (*P<0.05; **P<0.01). B. A549 cells were grown on glass coverslips, co-transfected with mCherry-paxillin and GFP-Rab5, and then incubated in normoxia or hypoxia for 24 hours. Samples were fixed and analyzed by confocal microscopy. Representative images are shown. Bar represents 10 μm. Right panels are magnifications of boxed areas. Numbers inside images indicate the Mander's Coefficient, which was obtained from three independent experiments (mean ± s.e.m.). Note that at least 23 images were analyzed per condition. *P<0.05. C. A549 cells were grown on glass coverslips, transfected with GFP-Rab5 and then incubated in normoxia or hypoxia for 24 hours. Samples were fixed, incubated with a specific antibody against vinculin (monoclonal antibody) and analyzed by confocal microscopy. Representative images are shown. Bar represents 10 μm. Right panels are magnifications of boxed areas. Numbers inside images indicate the Mander's Coefficient, which was obtained from a representative experiment (mean ± s.d.). Note that at least 13 cells were analyzed per condition. D. A549 cells were incubated in normoxia or hypoxia for 24 hours and then cell extracts were prepared. Rab5 was immunoprecipitated with a polyclonal antibody and samples were analyzed by Western Blot. For comparison, 50 μg of whole cell lysates (WCL) were analyzed. Control immunoprecipitation experiments were performed with an irrelevant IgG. Relative levels of talin and vinculin were quantified in immunoprecipitates by scanning densitometry of Western Blots and normalized to Rab5 immunoprecipitated and total talin and vinculin (respectively) in WCL. Numerical data below each panel indicates the fold increase in talin (1.57 ± 0.26) and vinculin levels (1.93 ± 0.24) relative to normoxia, as calculated from three independent experiments (mean ± s.e.m.). *P<0.05.
Figure 3
Figure 3. Rab5 activation is required for hypoxia-induced cell migration
A. A549 cells were stably transduced with either control (sh-Ctrl) or Rab5-specific shRNA constructs (sequences #F10 and #B5) and then, exposed to hypoxia for 24 hours. Whole cell lysates were prepared and analyzed by Western blotting for HIF1α, Rab5 and actin. Numerical data below panel represent the scanning densitometry analysis of Rab5 levels normalized to actin from four independent measurements (mean ± s.e.m.) and are summarized as follows: parental normoxia (1.0 ± 0.05), sh-Ctrl normoxia (1.1 ± 0.03), sh-Rab5#F10 normoxia (0.6 ± 0.03), sh-Rab5#B5 (0.2 ± 0.02), parental hypoxia (1.0 ± 0.1), sh-Ctrl hypoxia (1.0 ± 0.03), sh-Rab5#F10 (0.6 ± 0.08), sh-Rab5#B5 (0.2 ± 0.04). ***P<0.001, compared to sh-Ctrl in normoxia; #P<0.05, ###P<0.01, compared to sh-Ctrl in hypoxia. B. A549 cells stably transduced with either control (sh-Ctrl) or Rab5-specific shRNA constructs (sequences #F10 and #B5) were homogenized and Rab5-GTP levels were determined by the R5BD pull-down assay. Representative Western blot images are shown. Graph indicates the fold of increase, obtained by scanning densitometry analysis and normalized to total Rab5. Data were averaged from three independent experiments (mean ± s.e.m.) ***P<0.001. C. Cells were grown to confluence, monolayers were wounded and cells were allowed to migrate for 24 hours in normoxia or hypoxia. Representative phase contrast images are shown and numbers within panels indicate the fold increase, which was averaged from four independent experiments (mean ± s.e.m) and is summarized as follows: normoxia/sh-Ctrl (1.00 ± 0.07), hypoxia/sh-Ctrl (1.40 ± 0.1), normoxia/sh-Rab5 F10 (0.76 ± 0.03), hypoxia/sh-Rab5 F10 (0.84 ± 0.05), normoxia/sh-Rab5 B5 (0.83 ± 0.07), hypoxia/sh-Rab5 B5 (0.82 ± 0.05). *P<0.05. Bar represents 200 μm. D. Cells were incubated in normoxia or hypoxia for 24 hours, harvested and then allowed to migrate for 2 hours in Transwell chambers coated with 2 μg/ml fibronectin, under normoxic conditions. Cells that migrated were visualized by crystal violet staining. Data represent the average from three independent experiments (mean ± s.e.m.). *P<0.05. E. Cells were transiently transfected with shRNA-resistant constructs, pEGFP-C1 (GFP), pEGFP-Rab5 (WT) or pEGFP-Rab5/S34N (S/N), incubated in normoxia or hypoxia for 24 hours, harvested and then allowed to migrate for 2 hours in Transwell chambers coated with 2 μg/ml fibronectin, under normoxic conditions. Transfection efficiency was roughly 40-50%, as determined by flow cytometry (data not shown). Also, whole cell lysates were prepared and analyzed by Western blotting with antibodies against Rab5 (upper panel) and actin (lower panel). Data represents the quantification of four independent experiments (mean ± s.e.m.). *P<0.05.
Figure 4
Figure 4. Silencing of Rab5 decreases FAK and Rac1 activation induced by hypoxia, without alterations in endocytosis
A, B. A549 cells were incubated in normoxia or hypoxia for 24 hours, harvested and incubated with LDL (A) and TFN (B) for internalization assays. Analysis was performed by flow cytometry (for details, see materials and methods). Graphs represent the average of four independent experiments (mean ± s.e.m.). C. A549 cells were exposed to normoxia or hypoxia for 24 hours and then, whole cell lysates were prepared and analyzed by Western blotting with antibodies against β1 integrin and actin. Representative images are shown. Numerical data below each panel represent the average from two experiments by scanning densitometry analysis of β1 integrin levels normalized to actin. D, E. A549 cells were incubated in normoxia or hypoxia for 24 hours, harvested, fixed and incubated with antibodies against total (D) or active (E) β1 integrin, followed by AlexaFluor488-conjugated secondary antibodies, and surface staining was analyzed by flow cytometry (for details, see materials and methods). Graphs represent the average of values from four independent experiments (mean ± s.e.m.). F. A549 cells were exposed to normoxia or hypoxia for 24 hours and then, whole cell lysates were prepared and analyzed by Western blotting with antibodies against FAK, actin and phospho-Y397-FAK (FAK phosphorylated on Y397, pFAK). Representative images are shown. Relative levels of phospho-Y397-FAK were quantified by scanning densitometry and normalized to total FAK. Data represent the average of results from three independent experiments (mean ± s.e.m.). *P<0.05. G. A549 cells were exposed to normoxia or hypoxia for 24 hours and Rac1-GTP levels were measured in the GST-PBD pull-down assay. Representative Western blot images are shown. Graph indicates the fold of increase, obtained by scanning densitometry analysis and normalized to total Rac1. Data were averaged from five independent experiments (mean ± s.e.m.) *P<0.05. H. Sub-confluent cultures were exposed to normoxia or hypoxia for 24 hours and phase contrast images were recorded by microscopy. Representative images are shown. Bar represents 20 μm. Numbers in panels indicate the percentage of cells depicting a leading lamellipodium and a trailing edge (characteristics defined as locomotion structures, arrowhead). Data were obtained from three independent experiments (mean ± s.e.m.). *P<0.05. Note that at least 245 cells were analyzed per experiment.
Figure 5
Figure 5. The aggressiveness of tumor cells determines the magnitude of Rab5 activation and migratory capacity induced by hypoxia
A. B16-F0 and B16-F10 mouse melanoma cells were incubated in normoxia (N) or hypoxia (1% O2, H) for 24 hours and whole cell lysates were prepared. Rab5-GTP levels were determined by the R5BD pull-down assay. Lower panel, representative Western blot images from four independent experiments are shown. Upper graph, relative Rab5-GTP levels were normalized to total Rab5 by scanning densitometry and are shown as the fold increase with respect to normoxia in B16-F0 cells. Data represent the average of four independent experiments (mean ± s.e.m.). *P<0.05. B. B16-F0 and B16-F10 cells were incubated in normoxia or hypoxia for 24 hours, harvested and then allowed to migrate for 2 hours in Transwell chambers coated with 2 μg/ml fibronectin, under normoxic conditions. Cells that migrated were visualized by crystal violet staining. Data represent the average from three independent experiments (mean ± s.e.m.). *P<0.05, ***P<0.001. C. B16-F0 cells were transfected with pEGFP-C1 (GFP) or pEGFP-Rab5 (WT), and B16-F10 cells were transfected with pEGFP-C1 (GFP) or pEGFP-Rab5/S34N (S/N). Then, cells were incubated in normoxia or hypoxia for 24 hours, harvested and allowed to migrate for 2 hours in Transwell chambers coated with 2 μg/ml fibronectin, under normoxic conditions. Also, whole cell lysates were prepared and analyzed by Western blotting with antibodies against Rab5 (upper panel) and actin (lower panel). Data represent the quantification of three independent experiments (mean ± s.e.m.). *P<0.05.
Figure 6
Figure 6. Hypoxia promotes tumor cell invasion and metastasis in a Rab5 dependent manner
A. B16-F10 cells were stably transduced with either control (sh-Ctrl) or a Rab5-specific shRNA construct (sequence #F8, sh-Rab5). Whole cell lysates were prepared and analyzed by Western blotting. Representative images are shown. Rab5 levels were quantified by scanning densitometry analysis and normalized to actin (numerical data below panel). Residual Rab5 levels in shRNA Rab5 cells (0.44 ± 0.06) were calculated from three independent experiments (mean ± s.e.m.). *P<0.05. B, C. B16-F10 cells stably transduced with shRNA constructs were allowed to invade in Matrigel chambers for 24 hours in normoxia or hypoxia. (B) Representative images are shown. (C) Graph represents the quantification of four independent experiments (mean ± s.e.m.). *P<0.05; **P<0.01. D, E. B16-F10 cells stably transduced with shRNA constructs were incubated in normoxia or hypoxia for 24 hours. Cells were harvested, re-suspended in physiological saline (2×10⁵ cells) and injected intravenously into the tail vein of C57BL/6 mice. Black lung tumor mass due to metastasis was monitored after sacrificing the animals at 21 days. Representative images are shown in (D). (E) Results are shown for at least 7 mice per group: sh-Ctrl/normoxia, black circles; sh-Rab5/normoxia, black squares; sh-Ctrl/hypoxia, white circles; sh-Rab5/hypoxia, white squares. Statistically significant differences are indicated (*P<0.05; **P<0.01; ***P<0.001).

Similar articles

Cited by

References

    1. van Zijl F, Krupitza G, Mikulits W. Initial steps of metastasis: cell invasion and endothelial transmigration. Mutat Res. 2011;728:23–34. - PMC - PubMed
    1. Brahimi-Horn MC, Chiche J, Pouyssegur J. Hypoxia and cancer. Journal of molecular medicine. 2007;85:1301–1307. - PubMed
    1. Gilkes DM, Semenza GL, Wirtz D. Hypoxia and the extracellular matrix: drivers of tumour metastasis. Nature reviews Cancer. 2014;14:430–439. - PMC - PubMed
    1. Vaupel P. Hypoxia and aggressive tumor phenotype: implications for therapy and prognosis. The oncologist. 2008;13(Suppl 3):21–26. - PubMed
    1. Vaupel P, Mayer A. Hypoxia in cancer: significance and impact on clinical outcome. Cancer metastasis reviews. 2007;26:225–239. - PubMed

Substances