. 2016 May 24;7(21):31226-42.
doi: 10.18632/oncotarget.8886.

Triterpenoid herbal saponins enhance beneficial bacteria, decrease sulfate-reducing bacteria, modulate inflammatory intestinal microenvironment and exert cancer preventive effects in ApcMin/+ mice

Affiliations

Triterpenoid herbal saponins enhance beneficial bacteria, decrease sulfate-reducing bacteria, modulate inflammatory intestinal microenvironment and exert cancer preventive effects in ApcMin/+ mice

Lei Chen et al. Oncotarget. .

Abstract

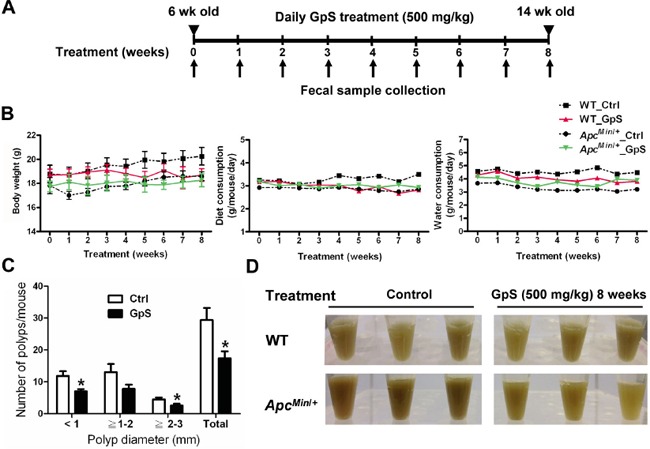
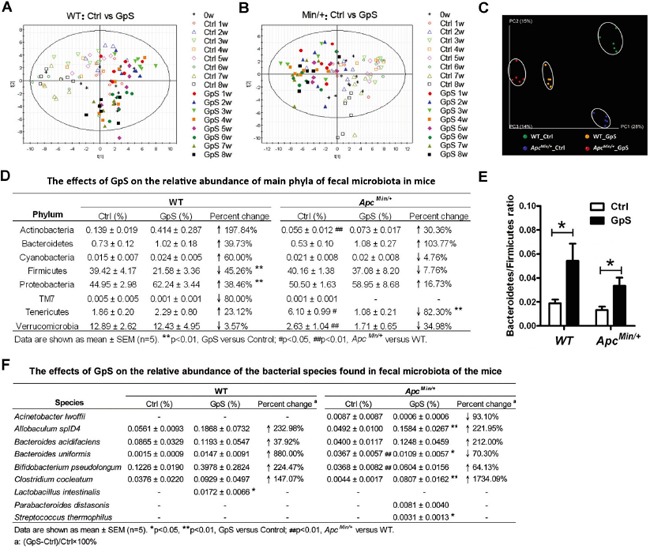
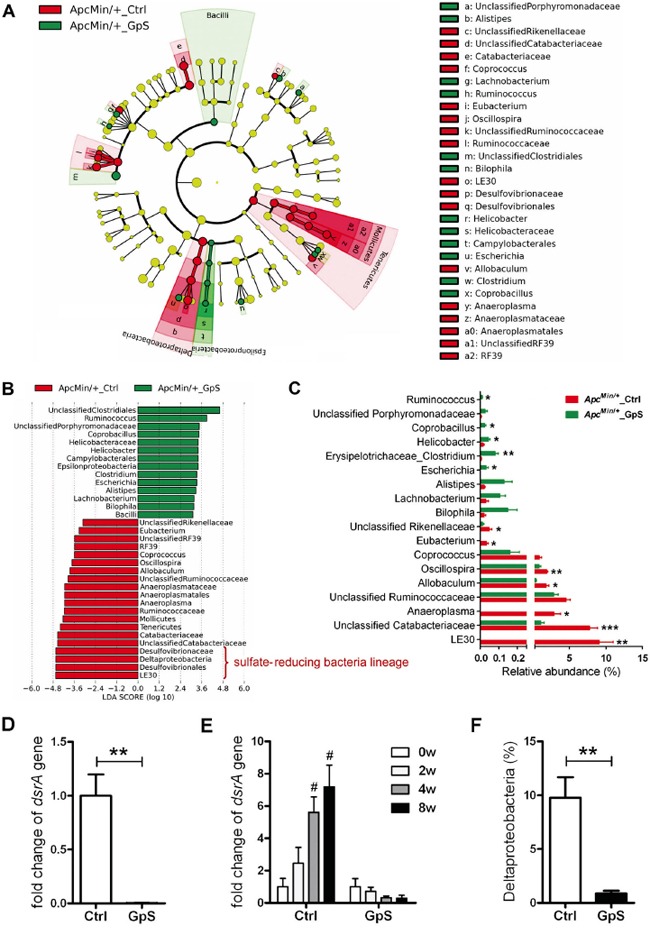
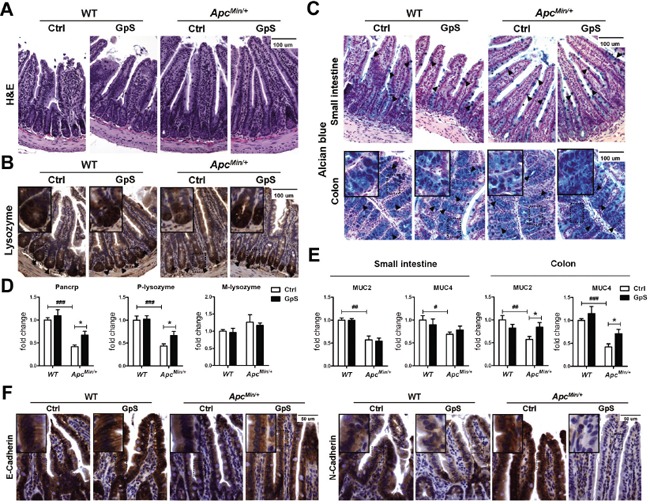
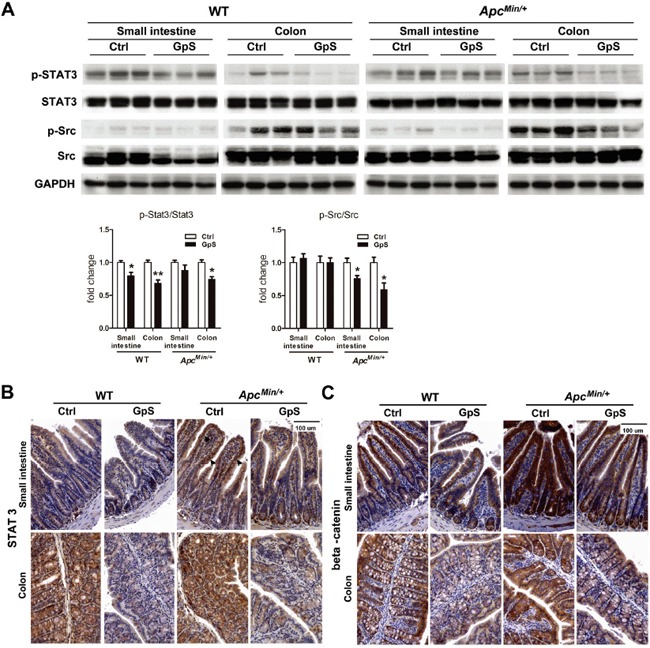
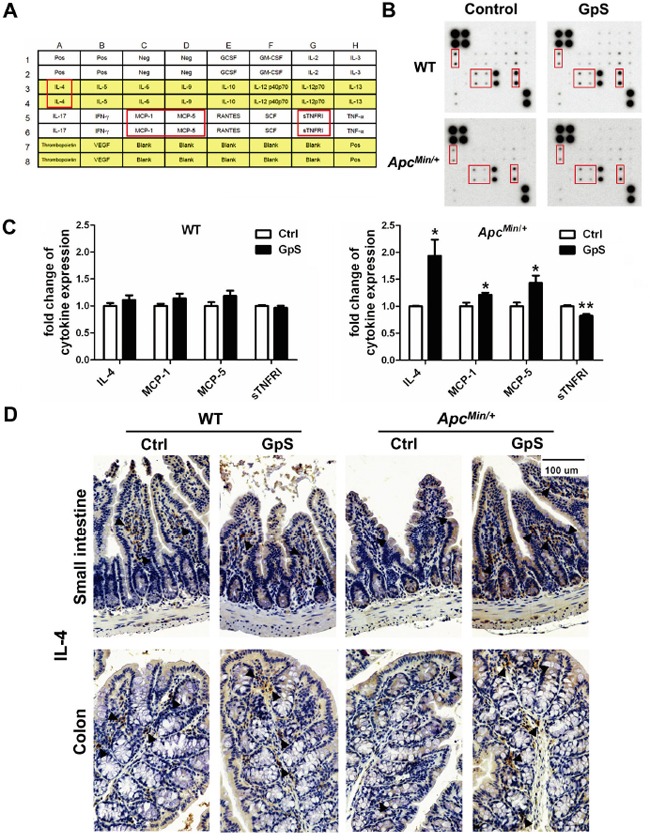
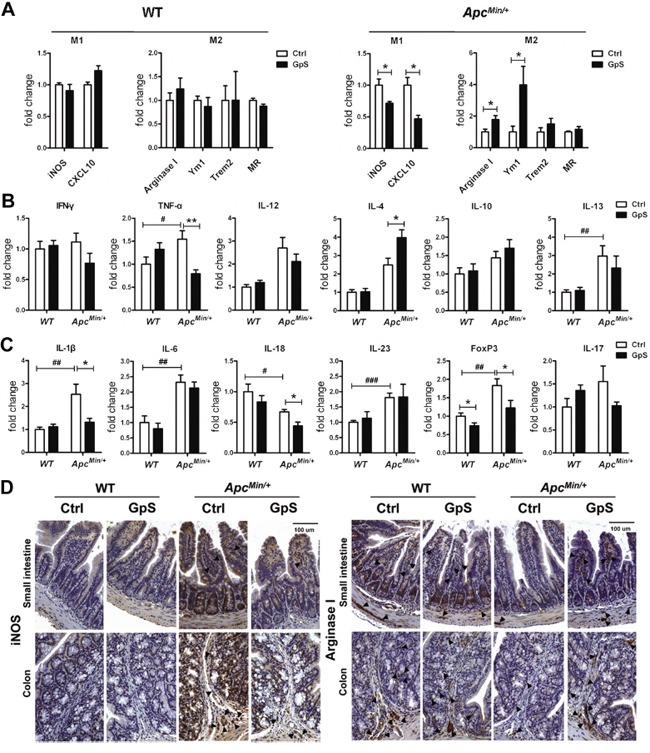
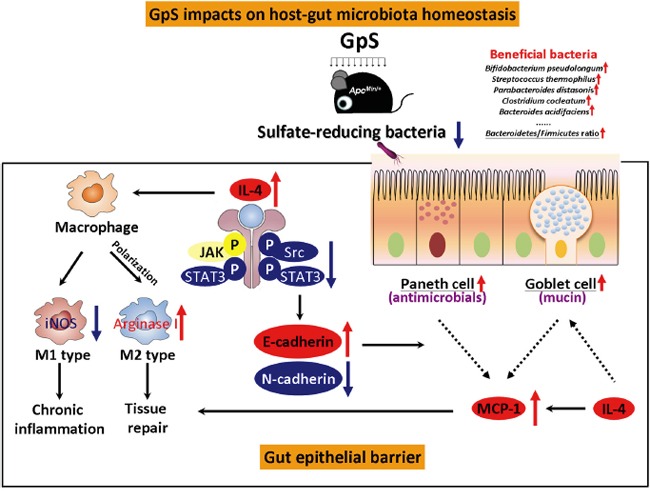
Saponins derived from medicinal plants have raised considerable interest for their preventive roles in various diseases. Here, we investigated the impacts of triterpenoid saponins isolated from Gynostemma pentaphyllum (GpS) on gut microbiome, mucosal environment, and the preventive effect on tumor growth. Six-week old ApcMin/+ mice and their wild-type littermates were fed either with vehicle or GpS daily for the duration of 8 weeks. The fecal microbiome was analyzed by enterobacterial repetitive intergenic consensus (ERIC)-PCR and 16S rRNA gene pyrosequencing. Study showed that GpS treatment significantly reduced the number of intestinal polyps in a preventive mode. More importantly, GpS feeding strikingly reduced the sulfate-reducing bacteria lineage, which are known to produce hydrogen sulfide and contribute to damage the intestinal epithelium or even promote cancer progression. Meanwhile, GpS also boosted the beneficial microbes. In the gut barrier of the ApcMin/+ mice, GpS treatment increased Paneth and goblet cells, up-regulated E-cadherin and down-regulated N-cadherin. In addition, GpS decreased the pro-oncogenic β-catenin, p-Src and the p-STAT3. Furthermore, GpS might also improve the inflamed gut epithelium of the ApcMin/+ mice by upregulating the anti-inflammatory cytokine IL-4, while downregulating pro-inflammatory cytokines TNF-α, IL-1β and IL-18. Intriguingly, GpS markedly stimulated M2 and suppressed M1 macrophage markers, indicating that GpS altered mucosal cytokine profile in favor of the M1 to M2 macrophages switching, facilitating intestinal tissue repair. In conclusion, GpS might reverse the host's inflammatory phenotype by increasing beneficial bacteria, decreasing sulfate-reducing bacteria, and alleviating intestinal inflammatory gut environment, which might contribute to its cancer preventive effects.

Keywords: gut microbiota; gut mucosal environment; gynostemma pentaphyllum; herbal saponins; pyrosequencing.


Conflict of interest statement

The authors declare no conflicts of interest.

Figures

Figure 1
Figure 1. Effect of GpS on the intestinal polyp formation in the ApcMin/+ mice
A. Schematic diagram of experimental design. B. The profiles of body weight, diet and water consumption. C. Effect of GpS on the size distribution of polyps. Data is presented as the mean ± SEM (* P < 0.05 versus control); n=6/group. D. Display of the fecal extracts of the WT and ApcMin/+ mice with or without GpS treatment for 8 weeks.
Figure 2
Figure 2. Comparison of microbial composition between the control and GpS-treated WT and ApcMin/+ mice
A & B. The time course PLS-DA plots of ERIC-PCR DNA profile of WT (see A) and ApcMin/+ (see B) mice treated and untreated with GpS. Open symbols: control mice; Solid symbols: GpS-treated mice (n=6/group). Fecal genomic DNA was subjected to ERIC-PCR, and the gel pictures were digitized by Image Lab 3.0 system (Bio-Rad). Based on the distance and the intensity of each DNA bands, SIMCA-P 12.0 tool was applied to obtain the PLS-DA score plots. C-E. 16S pyrosequencing analysis on the fecal genomic DNA samples from the WT and ApcMin/+ mice with or without GpS treatment for 8 weeks (n=5/group). C. PCoA plots of all samples from different treatment groups. The data were analyzed using QIIME software with the workflow script. PCoA plots were then generated using the unweighted UniFrac distance metric. D. The effects of GpS on the relative abundance of main phyla of fecal microbiota in mice. Beta diversity was calculated by QIIME software. E. Bacteroidetes/Firmicutes ratio. Data is presented as the mean ± SEM (* P < 0.05, GpS versus control). F. The effects of GpS on the relative abundance of the bacterial species found in fecal microbiota of the mice.
Figure 3
Figure 3. Identification of the key phylotypes in the fecal microbiome of GpS-treated and untreated ApcMin/+ mice
A. Taxonomic representations of the fecal microbiome. The differentially abundant taxa are presented with different colors using LEfSe method. The taxa from the untreated and GpS-treated ApcMin/+ mice are colored in red and green, respectively. The taxa with non-significant changes are colored in yellow. Each circle's diameter represents the taxon abundance. B. Histogram of the LDA scores of fecal 16S rRNA gene sequences of the untreated controls (red color) and GpS-treated ApcMin/+ mice (green color). LDA scores characterized the magnitude of differential abundance in the microbial taxa between compared samples. C. The relative abundance of differentially abundant genera. Data is presented as the mean ± SEM (* P < 0.05, ** P < 0.01, *** P < 0.001, GpS versus control); n=5/group. D. Fold change of dissimilatory (bi)sulfite reductase (dsrA) gene in fecal genomic DNA samples obtained from mice treated with GpS for 8 weeks. The DNA subjected to qRT-PCR here was the same as the one applied to pyrosequencing. The same amount of DNA was used as template, and the level of dsrA gene was normalized to 16S rRNA gene. 16S rRNA gene is a segment of prokaryotic DNA found in all bacteria, and a universal primer set was used to detect the 16S rRNA gene of total bacteria. E. Time course of relative expression of dsrA gene. qRT-PCR was used to determine the level of dsrA gene and normalized to that of the total fecal bacteria, and expressed as fold change of the WT control group (see D) or fold change over the 0w sample (before treatment) of each mouse (see E). F. Relative abundance of Deltaproteobacteria. Data is presented as the mean ± SEM (** P < 0.01 GpS versus control samples; # P < 0.05 versus 0w samples); n=6/group.
Figure 4
Figure 4. Effects of GpS on the intestinal epithelium
Intestinal tissues were collected after 8 weeks of treatment with or without GpS from the WT and ApcMin/+ mice. A. H&E staining. B. IHC staining of Paneth cells. C. Alcian blue staining of goblet cells. Hematoxylin and eosin (H&E) staining was used to visualize the formalin-fixed sections of small intestine. IHC staining of lysozyme was applied to identify the Paneth cells in the small intestine, and the dark brown at the bottom of the intestinal crypts indicates the presence of Paneth cells. Alcian blue staining was used to identify the goblet cells, and the blue staining indicates the presence of the goblet cells. D & E. The relative mRNA expression of Paneth cells related antimicrobial peptide (see D) and goblet cells related mucins (see E) was evaluated by qRT-PCR in the intestinal mucosal samples. Data was normalized to the expression of reference gene, and expressed as fold change of the WT control group. Data is presented as the mean ± SEM (* P < 0.05, GpS versus control samples; ## P < 0.01, ### P < 0.001, ApcMin/+ versus WT control samples); n=6/group. F. IHC staining of E-cadherin and N-cadherin. Positive expression is indicated by the brown color staining. Nuclear is stained and appeared in blue color that was done by hematoxylin staining.
Figure 5
Figure 5. Effects of GpS on the protein expression of STAT3 and beta-catenin
A. Western blot analysis: mucosa from the small intestine and colon were collected after 8 weeks of treatment. Mucosal protein lysates were analyzed by western blotting with specified indicated antibody. GAPDH was used as a loading control. Each lane represents sample obtained from individual mouse (n=3/group). B & C. IHC staining of STAT3 (see B) and beta-catenin (see C) in the small intestine and colon. Arrows indicate the STAT3 nuclear translocation.
Figure 6
Figure 6. Effects of GpS on the mucosal cytokine profiles
Mucosal lysates from five selected mice per group were pooled together, and analyzed using the cytokine array kit. A. The location of detected cytokines in the membrane. B. Representative cytokine array blots showing differential expressed cytokines. C. Densitometric analysis of the altered cytokines upon GpS treatment. Data was normalized to the positive control and presented as fold changes relative to the controls. Results were representative of two independent experiments with duplicate in each membrane. Data is presented as the mean ± SEM (* P < 0.05, ** P < 0.01, GpS versus control group). MCP: monocyte chemoattractant protein; sTNFRI: soluble tumor necrosis factor receptor I. D. IHC staining of IL-4 in the small intestine and colon. Arrows indicate the representative staining of the positive cells.
Figure 7
Figure 7. Effects of GpS on the macrophage phenotypic polarization
A. The relative mRNA expression of M1 and M2 macrophage markers. qRT-PCR analysis of mRNA extracted from the mucosal lysates of experimental mice were performed with specific primers. Data was normalized to the expression of reference gene, and expressed as fold change of the untreated group. B & C. The relative mRNA expression of (see B) macrophage polarization related cytokines and (see C) inflammation related molecules. Data was normalized to the expression of reference gene, and expressed as fold change relative to the WT control group. Data is presented as the mean ± SEM (* P < 0.05, ** P < 0.01 GpS versus control samples; # P < 0.05, ## P < 0.01, ### P < 0.001, ApcMin/+ versus WT control samples); n=6/group. D. IHC staining of iNOS and Arginase I. Arrows indicate the representative staining of the positive cells.
Figure 8
Figure 8. Summary of the impacts of GpS on host-gut-microbiota in ApcMin/+ mice
GpS impacts on host-gut-microbiota homeostasis through various means. GpS treatment increases beneficial bacteria, decreases sulfate-reducing bacteria, and improves gut epithelial barrier, which might contribute to its cancer preventive effects. The protective effects of GpS on the gut epithelial barrier (box in solid lines) might be partially through the induction of IL-4 secretion. On one hand, the elevation of IL-4 stimulates the M1 to M2 macrophages switching and facilitates intestinal tissue repair. On the other hand, IL-4 expression can also suppress the M1 induced marker, iNOS and reduce the chronic inflammation in the gut epithelial barrier. The elevated IL-4 cytokine might account for downregulation of p-Src and p-STAT3. As a result, it positively regulates E-cadherin and negatively modulates N-cadherin, presenting a reversion of disease to health status of gut epithelium upon GpS treatment. GpS also seems to improve of the intestinal epithelium by increasing Paneth and goblet cells. E-cadherin is required for Paneth cell maturation, while IL-4 can induce mucin secretion in goblet cells. The enrichment of goblet and Paneth cells facilitates the MCP-1 production and contributes to the tissue repair. Black arrows: pathways; red arrows: up-regulation; blue arrows: down-regulation; dashed lines: increase production.

References

    1. Wang T, Cai G, Qiu Y, Fei N, Zhang M, Pang X, Jia W, Cai S, Zhao L. Structural segregation of gut microbiota between colorectal cancer patients and healthy volunteers. ISME J. 2012;6:320–329. - PMC - PubMed
    1. Sobhani I, Tap J, Roudot-Thoraval F, Roperch JP, Letulle S, Langella P, Corthier G, Tran Van Nhieu J, Furet JP. Microbial dysbiosis in colorectal cancer (CRC) patients. PloS one. 2011;6:e16393. - PMC - PubMed
    1. Chen HM, Yu YN, Wang JL, Lin YW, Kong X, Yang CQ, Yang L, Liu ZJ, Yuan YZ, Liu F, Wu JX, Zhong L, Fang DC, Zou W, Fang JY. Decreased dietary fiber intake and structural alteration of gut microbiota in patients with advanced colorectal adenoma. Am J Clin Nutr. 2013;97:1044–1052. - PubMed
    1. Li Y, Kundu P, Seow SW, de Matos CT, Aronsson L, Chin KC, Karre K, Pettersson S, Greicius G. Gut microbiota accelerate tumor growth via c-jun and STAT3 phosphorylation in APCMin/+ mice. Carcinogenesis. 2012;33:1231–1238. - PubMed
    1. Uronis JM, Muhlbauer M, Herfarth HH, Rubinas TC, Jones GS, Jobin C. Modulation of the intestinal microbiota alters colitis-associated colorectal cancer susceptibility. PloS one. 2009;4:e6026. - PMC - PubMed

MeSH terms