. 2016 Apr 28;532(7600):453-8.
doi: 10.1038/nature17637.

Natural speech reveals the semantic maps that tile human cerebral cortex

Affiliations

Natural speech reveals the semantic maps that tile human cerebral cortex

Alexander G Huth et al. Nature. .

Abstract

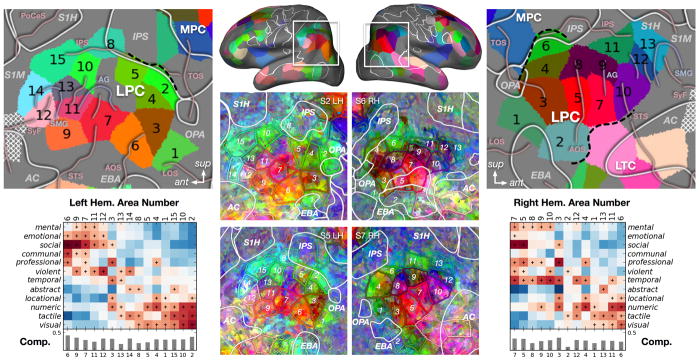
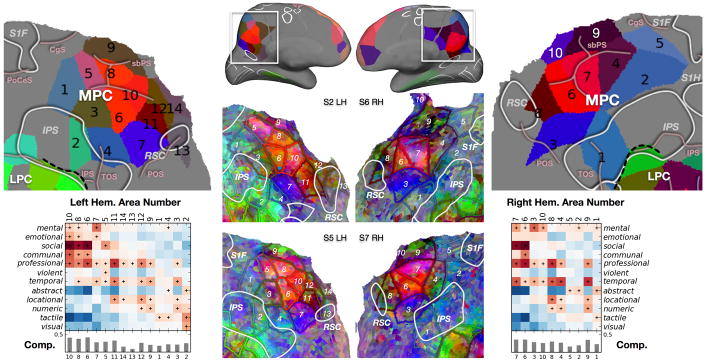
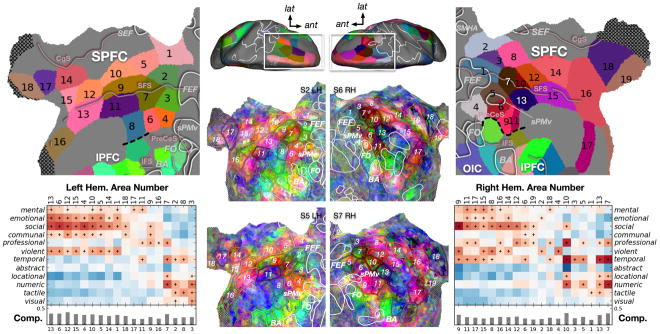
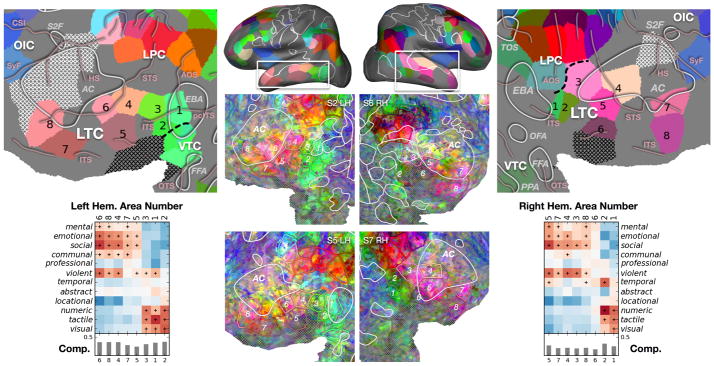
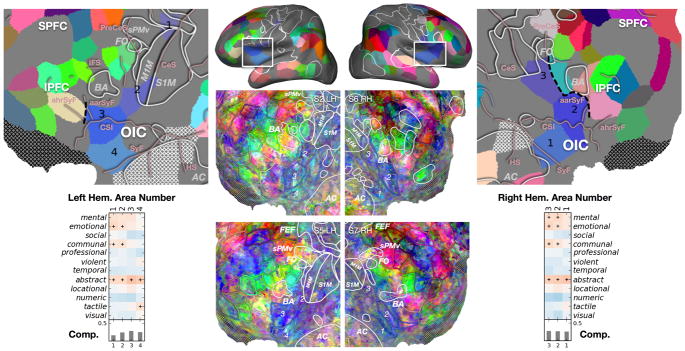
The meaning of language is represented in regions of the cerebral cortex collectively known as the 'semantic system'. However, little of the semantic system has been mapped comprehensively, and the semantic selectivity of most regions is unknown. Here we systematically map semantic selectivity across the cortex using voxel-wise modelling of functional MRI (fMRI) data collected while subjects listened to hours of narrative stories. We show that the semantic system is organized into intricate patterns that seem to be consistent across individuals. We then use a novel generative model to create a detailed semantic atlas. Our results suggest that most areas within the semantic system represent information about specific semantic domains, or groups of related concepts, and our atlas shows which domains are represented in each area. This study demonstrates that data-driven methods--commonplace in studies of human neuroanatomy and functional connectivity--provide a powerful and efficient means for mapping functional representations in the brain.


Conflict of interest statement

The authors declare no competing financial interests.

Figures

Extended Data Figure 1
Extended Data Figure 1. Voxel-wise model prediction performance
Cortical flatmaps showing prediction performance of voxel-wise semantic models for all seven subjects, formatted similarly to Figure 1C in the main text. Models were tested using one 10-minute story that was not included during model estimation. Prediction performance was then computed as the correlation between predicted and measured BOLD responses. (Left column) Raw prediction performance. Note that the colormap here is scaled 0–1 rather than 0–0.6 as in the main text in order to match the scale of the adjusted prediction performance maps. (Right column) Prediction performance corrected to account for different amounts of noise in the BOLD responses (see Supplemental Methods for details). The voxel-wise semantic models predict BOLD responses in many brain areas, including superior and inferior prefrontal cortex (SPFC, IPFC), lateral and ventral temporal cortex (LTC, VTC), and lateral and medial parietal cortex (LPC, MPC). As explained in the main text, these same regions have been previously identified as the “semantic system” in the human brain.
Extended Data Figure 2
Extended Data Figure 2. Amount of variance explained by individual subject and group semantic dimensions
Principal components analysis (PCA) was used to discover the most important semantic dimensions from voxel-wise semantic model weights in each subject. To reduce noise, we used only the 10,000 best voxels in each subject, determined by cross-validation within the model estimation dataset. Here we show the amount of variance explained in the semantic model weights by each of the 20 most important PCs. Orange lines show the amount of variance explained each subject’s own PCs, blue lines show the variance explained by the PCs of combined data from the other six subjects, and gray lines show the variance explained by the PCs of the stories. (The Gale-Shapley stable marriage algorithm was used to re-order the group and stimulus PCs to maximize their correlation with the subject’s PCs.) Error bars indicate 99% confidence intervals. Confidence intervals for the subjects’ own PCs and group PCs are very small. Hollow markers indicate subject or group PCs that explain significantly more variance than the corresponding stimulus PCs (p<0.001, bootstrap test). Six PCs explain significantly more variance in one out of seven subjects, five PCs in two subjects, four PCs in three subjects, and three PCs in one subject. Thus, four PCs seem to comprise a semantic space that is common across most individuals.
Extended Data Figure 3
Extended Data Figure 3. Separate cortical projections of semantic dimensions 1-4 on subject S2 and combined cortical projections of dimensions 1-3 for subjects S1, S3, and S4
(a) Voxel-wise semantic model weights for subject S2 were projected onto each of the common semantic dimensions defined by PCs 1-4. Voxels for which model generalization performance was not significantly greater than zero (q(FDR)>0.05) are shown in gray. Positive projections are shown in red, negative projections in blue and near-zero projections in white. Voxels with fMRI signal dropout due to field inhomogeneity are shaded with black hatched lines. (b) Like Figures 2B and 2C in the main text, this figure shows the result of projecting voxel-wise models onto the first three common semantic dimensions, and then coloring each voxel using an RGB colormap. The red color component corresponds to the projection on the first PC, the green component to the second, and the blue component to the third. Semantic information seems to be represented in complex patterns distributed across the semantic system and the patterns seem to be largely conserved across individuals.
Extended Data Figure 4
Extended Data Figure 4. PrAGMATiC atlas likelihood maps
Comparison of actual semantic maps (Figure 2, Extended Data Figure 3) to the maps generated from the PrAGMATiC atlas (Figure 3). PrAGMATiC atlases for the left and right hemispheres were fit using data from all seven subjects. The left hemisphere atlas has 192 total areas and the right hemisphere has 128 (including non-semantic areas). Here we show (first column) the actual semantic maps for four subjects, (second column) the PrAGMATiC atlas on each subject’s cortical surface, (third column) the log likelihood ratio of the actual semantic map under the PrAGMATiC atlas versus a null model, and (fourth column) the fraction of variance in the semantic map that the PrAGMATiC atlas explains for each location on the cortical surface. The likelihood ratio maps show that most areas where there are large semantic model weights (i.e. the semantic system) are much better explained by PrAGMATiC than by a null model and thus appear red, while areas where the weights are small (i.e. somatomotor cortex, visual cortex, etc.) are about equally well explained by both PrAGMATiC and the null model and thus appear white. Variance explained was computed by subtracting the PrAGMATiC atlas from the actual semantic map (in the space of the four group semantic dimensions), squaring and summing the residuals and then dividing by the sum of squares in the actual map. The variance explained maps show that the PrAGMATiC atlas captures a large fraction of the variance in the semantic maps (37–47% in total).
Extended Data Figure 5
Extended Data Figure 5. Comparison of PrAGMATiC models fit with different initial conditions
As with many clustering algorithms, PrAGMATiC optimizes a non-convex objective function and so can find many potential locally optimal solutions. To reduce the effect of non-convexity on our results, we re-fit the model 10 times (each time with a different random initialization), and then selected the model fit that yielded the best likelihood (i.e. performance on the training set) as the PrAGMATiC atlas (Figure 3). Here we show (top) the PrAGMATiC atlas and (bottom) the second best model out of the 10 that were estimated. The parcellations given by these two models are very similar. However, there are a few differences, which illustrate uncertainty in the model. Some of these differences are due to statistical thresholding: a few areas that were found to be significantly semantically selective in the best model are missing in the alternate model (see left medial prefrontal cortex), and some significant areas in the alternate model are missing from the best model (left ventral occipital cortex). Other differences suggest alternative parcellations for a few regions, where, for example, the same region of cortex is parcellated into 3 areas in the best model and 4 areas in the alternate model. Yet it is clear that none of the differences between these two models are sufficient to change any of the interpretations given in the main text.
Extended Data Figure 6
Extended Data Figure 6. Semantic atlas for lateral parietal cortex (LPC)
The PrAGMATiC atlas divides LPC into 15 areas in the left hemisphere and 13 areas in the right. Here we show (top left and right) the atlas for each hemisphere, (top middle) 3-D brains indicating the location of LPC, (bottom middle) individual maps for two subjects in each hemisphere, and (bottom left and right) the average predicted response of each area to the 12 semantic categories identified earlier (responses consistently greater than zero across subjects are marked with “+”). Bars show how completely this 12 category interpretation captures the average semantic model in each area. LPC appears to be organized around the angular gyrus (AG), with a core that is selective for social, emotional, and mental concepts (L6, 7, 9, 11; R5, 7) and a periphery that is selective for visual, tactile, and numeric concepts (L2, 4, 5, 8, 10, 15; R6, 11).
Extended Data Figure 7
Extended Data Figure 7. Semantic atlas for medial parietal cortex (MPC)
The PrAGMATiC atlas divides MPC into 14 areas in the left hemisphere and 10 areas in the right. Here we show (top left and right) the atlas for each hemisphere, (top middle) 3-D brains indicating the location of MPC, (bottom middle) individual maps for two subjects in each hemisphere, and (bottom left and right) the average predicted response of each area to the 12 semantic categories identified earlier (responses consistently greater than zero across subjects are marked with “+”). Bars show how completely the 12 category interpretation captures the average semantic model in each area. Like LPC, MPC appears to be organized around a core group of areas that are selective for social and mental concepts (L6, 8, 10; R6, 7). Dorsolateral MPC areas (L2, 4; R1) are selective for visual and tactile concepts. Anterior dorsal areas (L5, 9; R4, 9) are selective for temporal concepts. Ventral areas (L11, 12, 14; R8) are selective for professional, temporal, and locational concepts. Just above retrosplenial cortex one distinct area in each hemisphere is selective for mental, professional and temporal concepts (L7; R3). Overall, right MPC responds more than left MPC to mental concepts.
Extended Data Figure 8
Extended Data Figure 8. Semantic atlas for superior prefrontal cortex (SPFC)
The PrAGMATiC atlas divides SPFC into 18 areas in the left hemisphere and 19 areas in the right. Here we show (top left and right) the atlas for each hemisphere, (top middle) 3-D brains indicating the location of SPFC, (bottom middle) individual maps for two subjects in each hemisphere, and (bottom left and right) the average response of each area in the atlas to the 12 semantic categories identified earlier (responses consistently greater than zero across subjects are marked with “+”). Bars show how completely the 12 category interpretation captures the average semantic model in each area. The organization in SPFC seems to follow the long rostro-caudal sulci and gyri of the dorsal frontal lobe. Posterior-lateral SPFC areas (L4, 6; R6, 9, 11) are selective for social, emotional, communal, and violent concepts. Posterior superior frontal sulcus areas (L2, 3, 7, 8; R1, 5, 7) are selective for visual, tactile, and numeric concepts. Superior frontal gyrus contains a long strip of areas (L1, 5, 10, 12–15; R8, 12, 14–16) selective for social, emotional, communal, and violent concepts.
Extended Data Figure 9
Extended Data Figure 9. Semantic atlas for lateral temporal cortex (LTC)
The PrAGMATiC atlas divides LTC into 8 areas in both the left and right hemispheres. Here we show (top left and right) the atlas for each hemisphere, (top middle) 3-D brains indicating the location of LTC, (bottom middle) individual maps for two subjects in each hemisphere, and (bottom left and right) the average response of each area in the atlas to the 12 semantic categories identified earlier (responses consistently greater than zero across subjects are marked with “+”). Bars show how completely the 12 category interpretation captures the average semantic model in each area. Anterior LTC areas (L4-8; R3-8) are selective for social, emotional, mental, and violent concepts. Posterior LTC areas (L1-3; R1-2) are selective for numeric, tactile, and visual concepts.
Extended Data Figure 10
Extended Data Figure 10. Semantic atlas for ventral temporal cortex (VTC)
The PrAGMATiC atlas divides VTC into 6 areas in the left hemisphere and 1 area in the right. Here we show (top left and right) the atlas for each hemisphere, (top middle) 3-D brains indicating the location of VTC, (bottom middle) individual maps for two subjects in each hemisphere, and (bottom left and right) the average response of each area in the atlas to the 12 semantic categories identified earlier (responses consistently greater than zero across subjects are marked with “+”). Bars show how completely the 12 category interpretation captures the average semantic model in each area. VTC is relatively homogeneous: all areas are selective for numeric, tactile, and visual concepts. In left VTC areas close to the parahippocampal place area (PPA) are also selective for locational concepts (L5-6).
Extended Data Figure 11
Extended Data Figure 11. Semantic atlas for inferior prefrontal cortex (IPFC)
The PrAGMATiC atlas divides IPFC into 12 areas in the left hemisphere and 9 areas in the right. Here we show (top left and right) the atlas for each hemisphere, (top middle) 3-D brains indicating the location of IPFC, (bottom middle) individual maps for two subjects in each hemisphere, and (bottom left and right) the average response of each area in the atlas to the 12 semantic categories identified earlier (responses consistently greater than zero across subjects are marked with “+”). Bars show how completely the 12 category interpretation captures the average semantic model in each area. Posterior IPFC areas in the precentral sulcus (L1-3; R1, 2) are selective for visual, tactile, and numeric concepts. Areas on the inferior frontal gyrus (L8; R4, 7) are selective for social and violent concepts. Areas in the inferior frontal sulcus and anterior middle frontal gyrus (L4-7; R5-6) are selective for visual, tactile, and numeric concepts. Areas in the orbitofrontal sulci (L10; R9) are also selective for visual, tactile, numeric, and locational concepts.
Extended Data Figure 12
Extended Data Figure 12. Semantic atlas for opercular and insular cortex (OIC)
The PrAGMATiC atlas divides OIC into 4 areas in the left hemisphere and 3 areas in the right. Here we show (top left and right) the atlas for each hemisphere, (top middle) 3-D brains indicating the location of OIC, (bottom middle) individual maps for two subjects in each hemisphere, and (bottom left and right) the average response of each area in the atlas to the 12 semantic categories identified earlier (responses consistently greater than zero across subjects are marked with “+”). Bars show how completely the 12 category interpretation captures the average semantic model in each area. These areas are homogeneously selective for abstract concepts, with more posterior and superior areas also responding to emotional, communal, and mental concepts.
Figure 1
Figure 1. Voxel-wise modeling
(a) Seven subjects listened to over two hours of naturally spoken narrative stories while BOLD responses were measured using fMRI. Each word in the stories was projected into a 985-dimensional word embedding space constructed using word co-occurrence statistics from a large corpus of text. A finite impulse response (FIR) regression model was estimated individually for every voxel. The voxel-wise model weights describe how words appearing in the stories influence BOLD signals. (b) Models were tested using one 10-minute story that was not included during model estimation. Model prediction performance was computed as the correlation between predicted responses to this story and actual BOLD responses. (c) Prediction performance of voxel-wise models for one subject. Semantic models accurately predict BOLD responses in many brain areas, including the lateral and ventral temporal cortex (LTC, VTC), lateral and medial parietal cortex (LPC, MPC), and superior and inferior prefrontal cortex (SPFC, IPFC). These regions have previously been identified as the “semantic system” in the human brain.
Figure 2
Figure 2. Principal components of voxel-wise semantic models
Principal components analysis (PCA) of voxel-wise model weights reveals four important semantic dimensions in the brain (Extended Data Fig. 2). (a) An RGB colormap was used to color both words and voxels based on the first three dimensions of the semantic space. Words that best match the four semantic dimensions were found and then collapsed into 12 categories using k-means clustering. Each category (Supplementary Table 2) was manually assigned a label. The 12 category labels (large words) and a selection of the 458 best words (small words) are plotted here along four pairs of semantic dimensions. The largest axis of variation lies roughly along the first dimension, and separates perceptual and physical categories (tactile, locational) from human-related categories (social, emotional, violent). (b) Voxel-wise model weights were projected onto the semantic dimensions and then colored using the same RGB colormap (see Extended Data Fig. 3 for separate dimensions). Projections for one subject (S2) are shown on that subject’s cortical surface. Semantic information seems to be represented in intricate patterns across much of the semantic system. (c) Semantic PC flatmaps for three other subjects. Comparing these flatmaps, many patterns appear to be shared across individuals. (See Extended Data Fig. 3 for other subjects.)
Figure 3
Figure 3. PrAGMATiC: a generative model for cortical maps
To create an atlas that describes the distribution of semantically selective functional areas in the human cerebral cortex we developed PrAGMATiC, a probabilistic and generative model of areas tiling the cortex. (a) PrAGMATiC has two parts: an arrangement model and an emission model. The arrangement model is analogous to a physical system of springs joining neighboring area centroids. To enforce similarity across subjects, springs also join areas to 19 regions-of-interest that were localized separately. The emission model assigns the functional mean of the closest area centroid to each point on the cortex, forming a Voronoi tessellation. Spring lengths and area means are shared across subjects while exact area locations are unique to each subject. These parameters are fit using maximum likelihood estimation. (b) A leave-one-out procedure was used to choose the number of areas in each hemisphere. PrAGMATiC models were estimated on six subjects and then used to predict BOLD responses for the seventh. Prediction performance improved significantly up to 192 total areas in the left hemisphere and 128 areas in the right. (c) A semantic atlas was estimated using data from all seven subjects. Areas where the semantic model did not predict better than models based on low-level features (i.e. word rate, phonemes) were removed. The remaining areas were plotted on one subject’s cortical surface using the same RGB colormap as Figure 2. Areas dominated by signal dropout are shown in black hatching, and areas where the low-level models performed well are shown in white hatching. This atlas shows the functional organization of the semantic system that is common across subjects.

Comment in

References

    1. Binder JR, Desai RH, Graves WW, Conant LL. Where is the semantic system? A critical review and meta-analysis of 120 functional neuroimaging studies. Cereb Cortex. 2009;19:2767–96. - PMC - PubMed
    1. Lerner Y, Honey CJ, Silbert LJ, Hasson U. Topographic mapping of a hierarchy of temporal receptive windows using a narrated story. J Neurosci. 2011;31:2906–15. - PMC - PubMed
    1. Friederici AD, Opitz B, von Cramon DY. Segregating semantic and syntactic aspects of processing in the human brain: an fMRI investigation of different word types. Cereb Cortex. 2000;10:698–705. - PubMed
    1. Noppeney U, Price CJ. Retrieval of abstract semantics. Neuroimage. 2004;22:164–70. - PubMed
    1. Binder JR, Westbury CF, McKiernan KA, Possing ET, Medler DA. Distinct brain systems for processing concrete and abstract concepts. J Cogn Neurosci. 2005;17:905–917. - PubMed

Publication types