

doi: 10.1186/s13059-016-0938-8.
CEL-Seq2: sensitive highly-multiplexed single-cell RNA-Seq
Affiliations
- PMID: 27121950
- PMCID: PMC4848782
- DOI: 10.1186/s13059-016-0938-8
Item in Clipboard
CEL-Seq2: sensitive highly-multiplexed single-cell RNA-Seq
Genome Biol.
.
Abstract
Single-cell transcriptomics requires a method that is sensitive, accurate, and reproducible. Here, we present CEL-Seq2, a modified version of our CEL-Seq method, with threefold higher sensitivity, lower costs, and less hands-on time. We implemented CEL-Seq2 on Fluidigm's C1 system, providing its first single-cell, on-chip barcoding method, and we detected gene expression changes accompanying the progression through the cell cycle in mouse fibroblast cells. We also compare with Smart-Seq to demonstrate CEL-Seq2's increased sensitivity relative to other available methods. Collectively, the improvements make CEL-Seq2 uniquely suited to single-cell RNA-Seq analysis in terms of economics, resolution, and ease of use.
Figures
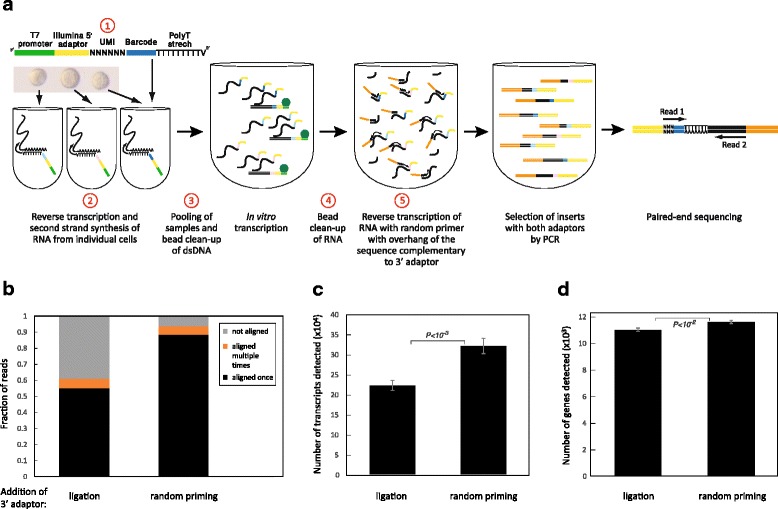
Changes introduced to the protocol. a An outline of the CEL-Seq2 method is shown with the steps modified from the original CEL-Seq indicated in red. b Distribution of the reads in two libraries prepared with or without ligation from the same amplified RNA of ten replicates of 100 pg clean RNA. c, d Number of transcripts (c) and genes (d) detected. Error bars indicate standard error
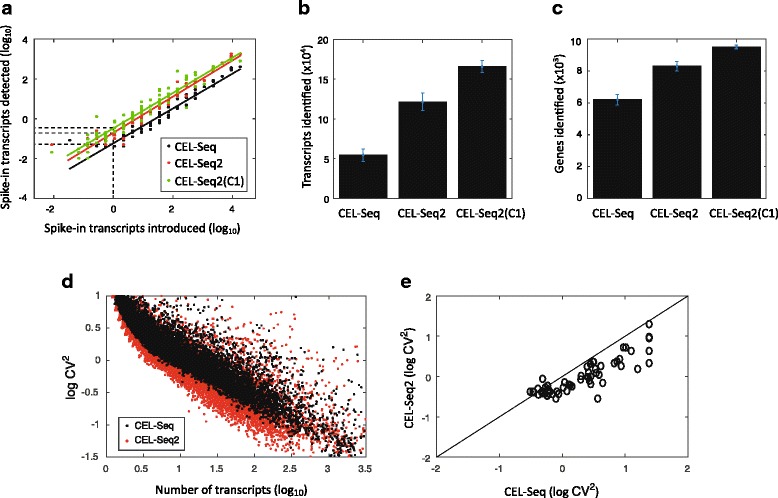
Performance of CEL-Seq2 compared to the original CEL-Seq. In total, 24, 20, and 72 single fibroblasts were analyzed by CEL-Seq, CEL-Seq2, and CEL-Seq2(C1), respectively. a For each of the 92 ERCC spike-ins the average observed and expected molecules across the examined cells is plotted. The lines were fitted using a linear model and the efficiency was computed as the y-intercept. b Comparing the mean number of transcripts identified per cell between the methods. c Comparing the mean number of genes identified per cell between the methods. d Coefficient of variation for the original CEL-Seq and CEL-Seq2. Each dot indicates a gene’s squared coefficient of variation. e A comparison between the squared coefficients of variation for the detected ERCC spike-ins. Error bars indicate standard error
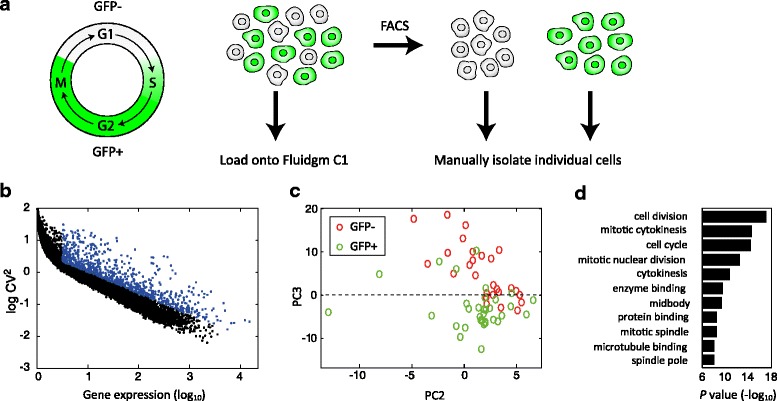
Cell-cycle associated differences in the transcriptome. a Experimental system. GFP+ cells are in the S, G2, and M phases of the cell cycle and a growing culture is composed of roughly equal numbers of GFP+ and GFP– cells. Trypsinized cells are either loaded directly onto the Fluidigm C1 with GFP signal observed in the chip, or sorted according to the GFP signal and manually frozen. b Coefficient of variation on the C1. Each dot indicates a gene’s squared coefficient of variation. c PCA of the genes with high coefficient of variation (labeled blue in (b)). d Gene Ontology (GO) terms of differentially expressed genes – PC3 > 0 vs. PC3 < 0 in (c)
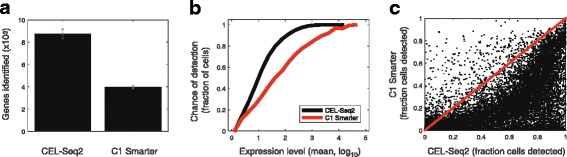
Performance of CEL-Seq2 compared to other methods. a Number of genes detected in mouse dendritic cells using CEL-Seq2 and C1 Smarter, as previously described [13]. b Chance of detection of transcripts from a particular gene across the two methods. For each gene we computed the average expression across all cells and the fraction of cells in which the expression was detected. For each expression level bin, the average fraction detected was computed. c Comparison at the gene-level between the fraction of cells in which expression was detected using the two methods. Dots indicate genes
References
-
- Tang F, Barbacioru C, Wang Y, Nordman E, Lee C, Xu N, Wang X, Bodeau J, Tuch BB, Siddiqui A, Lao K, Surani MA. mRNA-Seq whole-transcriptome analysis of a single cell. Nat Methods. 2009;6:377–82. - PubMed
-
- Zhu YY, Machleder EM, Chenchik A, Li R, Siebert PD. Reverse transcriptase template switching: a SMART approach for full-length cDNA library construction. Biotechniques. 2001;30:892–7. - PubMed
Publication types
MeSH terms
LinkOut - more resources
Full Text Sources
Other Literature Sources
Molecular Biology Databases
