. 2016 Apr 27;36(17):4698-707.
doi: 10.1523/JNEUROSCI.4077-15.2016.

Oligodendrogliopathy in Multiple Sclerosis: Low Glycolytic Metabolic Rate Promotes Oligodendrocyte Survival

Affiliations

Oligodendrogliopathy in Multiple Sclerosis: Low Glycolytic Metabolic Rate Promotes Oligodendrocyte Survival

Malena B Rone et al. J Neurosci. .

Abstract

Multiple sclerosis (MS) lesions feature demyelination with limited remyelination. A distinct injury phenotype of MS lesions features dying back of oligodendrocyte (OL) terminal processes, a response that destabilizes myelin/axon interactions. This oligodendrogliopathy has been linked with local metabolic stress, similar to the penumbra of ischemic/hypoxic states. Here, we developed an in vitro oligodendrogliopathy model using human CNS-derived OLs and related this injury response to their distinct bioenergetic properties. We determined the energy utilization properties of adult human surgically derived OLs cultured under either optimal or metabolic stress conditions, deprivation of growth factors, and glucose and/or hypoxia using a Seahorse extracellular flux analyzer. Baseline studies were also performed on OL progenitor cells derived from the same tissue and postnatal rat-derived cells. Under basal conditions, adult human OLs were less metabolically active than their progenitors and both were less active than the rat cells. Human OLs and progenitors both used aerobic glycolysis for the majority of ATP production, a process that contributes to protein and lipid production necessary for myelin biosynthesis. Under stress conditions that induce significant process retraction with only marginal cell death, human OLs exhibited a significant reduction in overall energy utilization, particularly in glycolytic ATP production. The stress-induced reduction of glycolytic ATP production by the human OLs would exacerbate myelin process withdrawal while favoring cell survival, providing a potential basis for the oligodendrogliopathy observed in MS. The glycolytic pathway is a potential therapeutic target to promote myelin maintenance and enhance repair in MS.

Significance statement: The neurologic deficits that characterize multiple sclerosis (MS) reflect disruption of myelin (demyelination) within the CNS and failure of repair (remyelination). We define distinct energy utilization properties of human adult brain-derived oligodendrocytes and oligodendrocyte progenitor cells under conditions of metabolic stress that model the initial relapsing and subsequent progressive phases of MS. The observed changes in energy utilization affect both cell survival and myelination capacity. These processes may be amenable to therapeutic interventions to limit the extent of cumulative tissue injury and to promote repair in MS.

Keywords: aerobic glycolysis; metabolic stress; multiple sclerosis; oligodendrocytes; oligodendrogliopathy.


Figures

Figure 1.
Figure 1.
Distinct oxidative phosphorylation properties of human OLs and OPCs. A, Pathway depicting glucose metabolism in OLs. Glucose metabolism via the glycolytic pathway results in two molecules of ATP produced and pyruvate. Pyruvate can be converted into lactate and exported out of the cell. Continued metabolism of pyruvate into acetyl-CoA can be used either in ATP production via OXPHOS, generating 34 molecules of ATP, or in fatty acid biosynthesis to be used in myelin production. B, Cellular OCRs of rodent and human OLs and OPCs were measured using an XF96 extracellular flux analyzer. C, Scheme demonstrating breakdown of oxygen consumption after the addition of the stated inhibitors. The addition of Oligo identifies ATP-linked oxygen consumption (gray bar), whereas the addition of mitochondrial ETC inhibitors R and AA allowed for the identification of nonmitochondrial (blue bar) OCR with the difference between the two identifying mitochondrial proton leak (yellow bar). The addition of FCCP identifies mitochondrial spare capacity. D, Human and rodent OPCs had significantly higher basal oxygen consumption, nonmitochondrial oxygen, and ATP-linked OCR than their OL counterparts. E, There was a significant increase in rodent proton leak in OPCs compared with OLs (p < 0.05), with no differences observed in human proton leak ATP produced via OXPHOS was significantly greater in rodent cells than in their human counterparts (OPCs, *p < 0.01; OLs, **p < 0.001) and in OPCs compared with OLs. F, Normalization of OCR demonstrates that human OLs and OPCs consume a significantly higher quantity of oxygen for nonmitochondrial activities (*p < 0.05), with resulting lower ATP-linked OCR compared with rodent OL/OPCs.
Figure 2.
Figure 2.
Human and rodent OPCs are more glycolytic than their OL counterparts. A, ECAR as measured concurrently with OCR. B, Scheme demonstrating the breakdown of ECAR after the addition of the stated inhibitors. The addition of 2DG identifies acidification due to nonglycolytic activities (gray) and glycolytic activities (purple). C, Basal rate of glycolysis showing a significant difference rodent and human OL and OPC ECAR, with no significant differences observed between glycolytic or nonglycolytic ECAR. D, Calculated glycolytic ATP production revealing no significant difference seen between OLs and OPCs. E, Normalization of ECAR revealing no changes in sources of acidification, demonstrating similar pathway rates.
Figure 3.
Figure 3.
Human OLs and OPCs produce less ATP than rodent OLs and OPCs. A, OLs produce significant less ATP than OPCs, with human OPCs and OLs producing less total ATP compared with rodent cells (p < 0.05). B, Percentage normalization of ATP production determined that human OLs and OPCs both use the glycolytic pathways significantly more to produce ATP compared with rodent cells (p < 0.05).
Figure 4.
Figure 4.
Increased cell death and process retraction in human OLs and OPCs under stress conditions. OLs and OPCs were grown in DFM, DMEM, or DMEM/LG for 2–6 d. AC, Total cell number (A), percentage PI+ (B), and percentage TUNEL+ (C) OLs and OPCs were determined. Significant increases in cell death measures under suboptimal conditions are noted at day 6. For the comparison of OLs in DMEM or DMEM/LG with the OLs in DFM: *p < 0.05; **p < 0.01; for the comparison of OPCs in DMEM or DMEM/LG with the OPCs in DFM: #p < 0.05, ##p < 0.01, ###p < 0.001; for the comparison between OLs and OPCs: &p < 0.05 (paired t test between groups) (n = 3). Human adult OLs and OPCs were grown in DMEM or DMEM/LG ± hypoxia (1% O2) for 2 d. D, The percentage of TUNEL+ cells was marginally increased for both OLs and OPCs under DMEM/LG conditions compared with DMEM. E, Relative area per cell was significantly decreased under DMEM/LG and DMEM/LG/1%O2 conditions compared with DMEM (*p < 0.05, **p < 0.01, paired t test between groups, n = 6). F, Immunostaining of human OLs and OPCs with O4 antibody and Hoechst 33258 showing the morphological changes (reduced process outgrowth) of cells treated with DMEM/LG versus DMEM for both OLs and OPCs. The costaining with O4 antibody and Hoechst 33258 indicates that the purity of these cell cultures is >90% O4+ cells. Scale bar, 20 μm.
Figure 5.
Figure 5.
Reduced process outgrowth, mitochondria depolarization, and autophagy activation are induced in human OLs and OPCs under suboptimal conditions. A, B, Long-term (8 h) time-lapse imaging of sustained OL process outgrowth under optimal conditions (DFM; A) and retraction of processes under suboptimal conditions (DMEM/LG; B) using a VivaView Incubator/fluorescence microscope. Scale bar, 20 μm. C, D, Reduced ratio of red/green fluorescence intensity of JC-1 dye staining of mitochondria of adult OLs and OPCs grown in DMEM/LG for 48 h compared with corresponding cells grown in DFM, indicating depolarization of mitochondrial membrane potential. *p < 0.05 for comparison with corresponding DFM (n = 3). Scale bar, 20 μm. Human OLs and OPCs were grown in DFM or DMEM/LG for 48 h. E, Percentage of total cells with LC3B aggregation was increased in DMEM/LG conditions compared with corresponding cells grown in DFM for both OLs and OPCs. F, Illustration of cells immunostained with O4 (red) and LC3B (green) antibodies. Scale bar, 20 μm. p < 0.05 (n = 3).
Figure 6.
Figure 6.
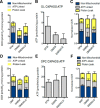
Human OLs decrease OXPHOS ATP production under metabolic stress conditions. A, OCR in human OLs under the stated conditions demonstrates no significant changes in total OCR. B, ATP production was decreased by human OLs under low-glucose conditions. C, Normalized mitochondrial oxygen consumption shows significant increases in proton leak with a significant decrease in ATP-linked OCR in low-glucose conditions compared with DFM medium. D, Human OPCs demonstrated no change in total OCR under optimal and nutrient-deprived conditions. E, No significant changes in ATP production were detected under the stated conditions. F, No significant changes were detected in normalized OCR to nonmitochondrial, proton leak or ATP-linked oxygen consumption in optimal or stress conditions. *p < 0.05.
Figure 7.
Figure 7.
Human OLs significantly decrease glycolysis under metabolic stress conditions. A, ECAR rates for human OL decrease under DMEM and low-glucose conditions compared with DFM. B, This decrease resulted in a significant decrease in ATP production under low-glucose conditions. C, Human OPCs demonstrated no significant decrease in ECAR under low-glucose conditions. D, There was no significant change in ATP production under low-glucose conditions compared with DFM.
Figure 8.
Figure 8.
Human OLs decrease energetic requirements when stressed but OPCs do not adapt. A, Significant decrease in total ATP production seen with the decrease in nutrients with human OLs. B, No significant decrease in total ATP production was detected with nutrient reduction in human OPCs. C, Under normal conditions, human OLs undergo a low rate of OXPHOS ATP production with increased rates of glycolytic ATP production, a process that has demonstrated to be beneficial for myelin biosynthesis and also for lactic acid transfer to neurons. Under metabolic stress conditions, OLs decrease glycolytic and OXPHOS ATP production, resulting in process retraction and decreased lactic acid production. (Figure adapted from Fünfschilling et al., 2012.)

References

    1. Aboul-Enein F, Rauschka H, Kornek B, Stadelmann C, Stefferl A, Brück W, Lucchinetti C, Schmidbauer M, Jellinger K, Lassmann H. Preferential loss of myelin-associated glycoprotein reflects hypoxia-like white matter damage in stroke and inflammatory brain diseases. J Neuropathol Exp Neurol. 2003;62:25–33. doi: 10.1093/jnen/62.1.25. - DOI - PubMed
    1. Almazan G, Afar DE, Bell JC. Phosphorylation and disruption of intermediate filament proteins in oligodendrocyte precursor cultures treated with calyculin A. J Neurosci Res. 1993;36:163–172. doi: 10.1002/jnr.490360206. - DOI - PubMed
    1. Amaral AI, Meisingset TW, Kotter MR, Sonnewald U. Metabolic aspects of neuron-oligodendrocyte-astrocyte interactions. Front Endocrinol (Lausanne) 2013;4:54. doi: 10.3389/fendo.2013.00054. - DOI - PMC - PubMed
    1. Bauernfeind AL, Barks SK, Duka T, Grossman LI, Hof PR, Sherwood CC. Aerobic glycolysis in the primate brain: reconsidering the implications for growth and maintenance. Brain Struct Funct. 2014;219:1149–1167. doi: 10.1007/s00429-013-0662-z. - DOI - PubMed
    1. Bongarzone ER, Pasquini JM, Soto EF. Oxidative damage to proteins and lipids of CNS myelin produced by in vitro generated reactive oxygen species. J Neurosci Res. 1995;41:213–221. doi: 10.1002/jnr.490410209. - DOI - PubMed

Publication types

LinkOut - more resources