

Interaction of HIF1α and β-catenin inhibits matrix metalloproteinase 13 expression and prevents cartilage damage in mice
- PMID: 27122313
- PMCID: PMC4868441
- DOI: 10.1073/pnas.1514854113
Interaction of HIF1α and β-catenin inhibits matrix metalloproteinase 13 expression and prevents cartilage damage in mice
Abstract
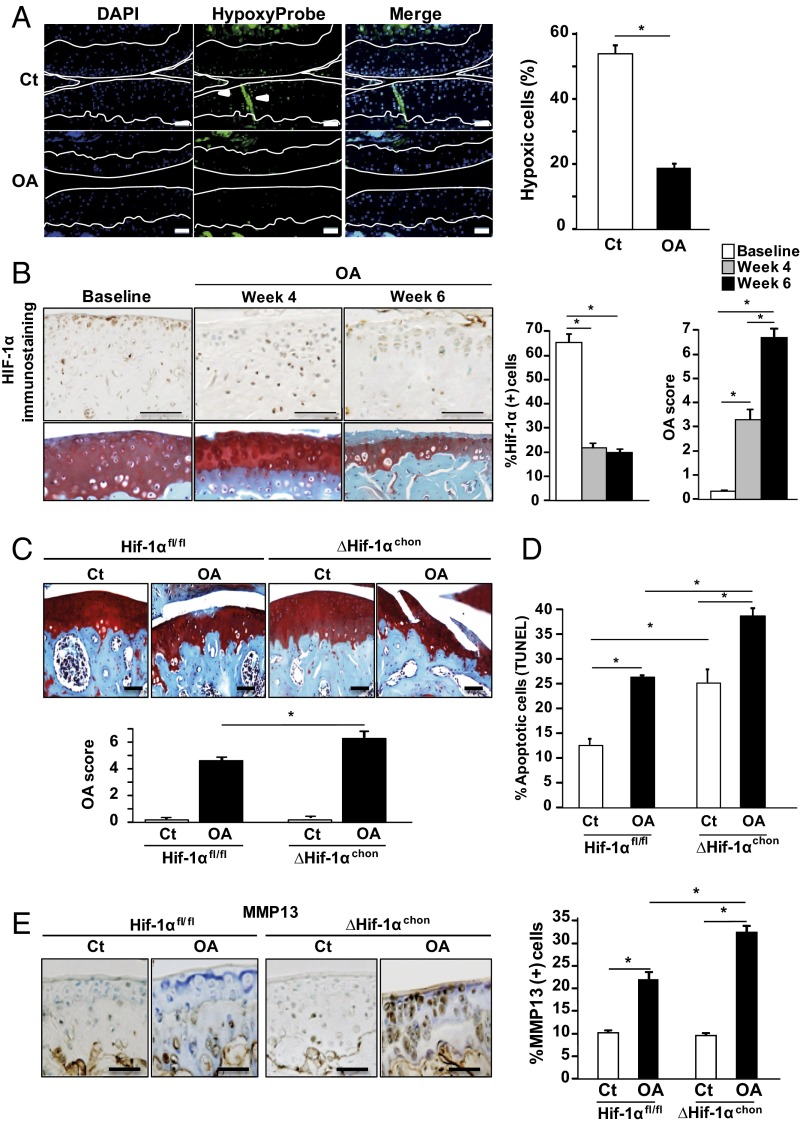
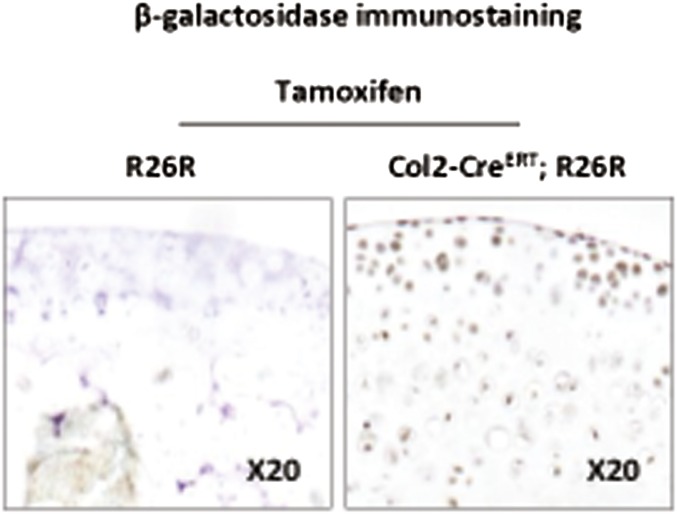
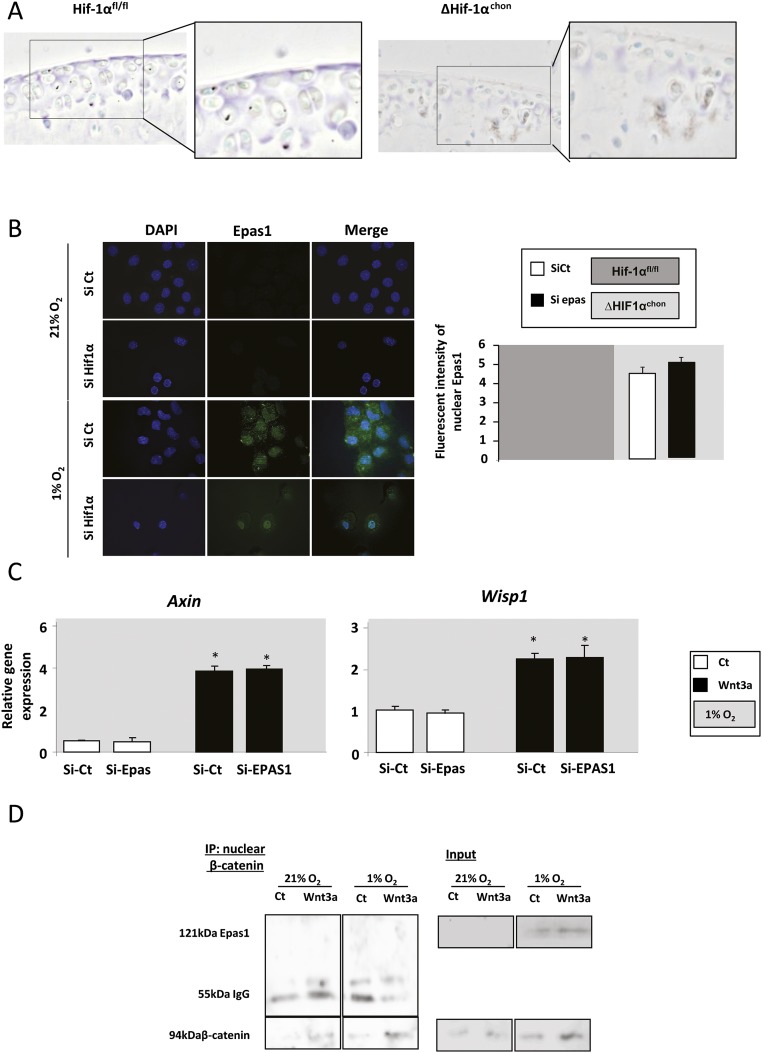
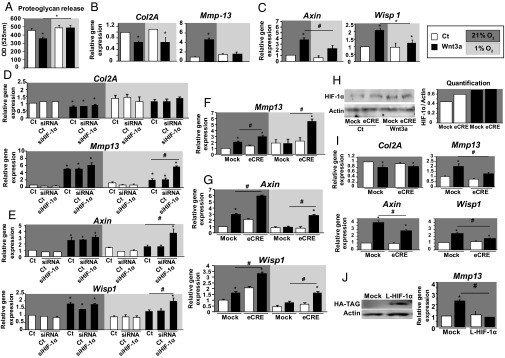
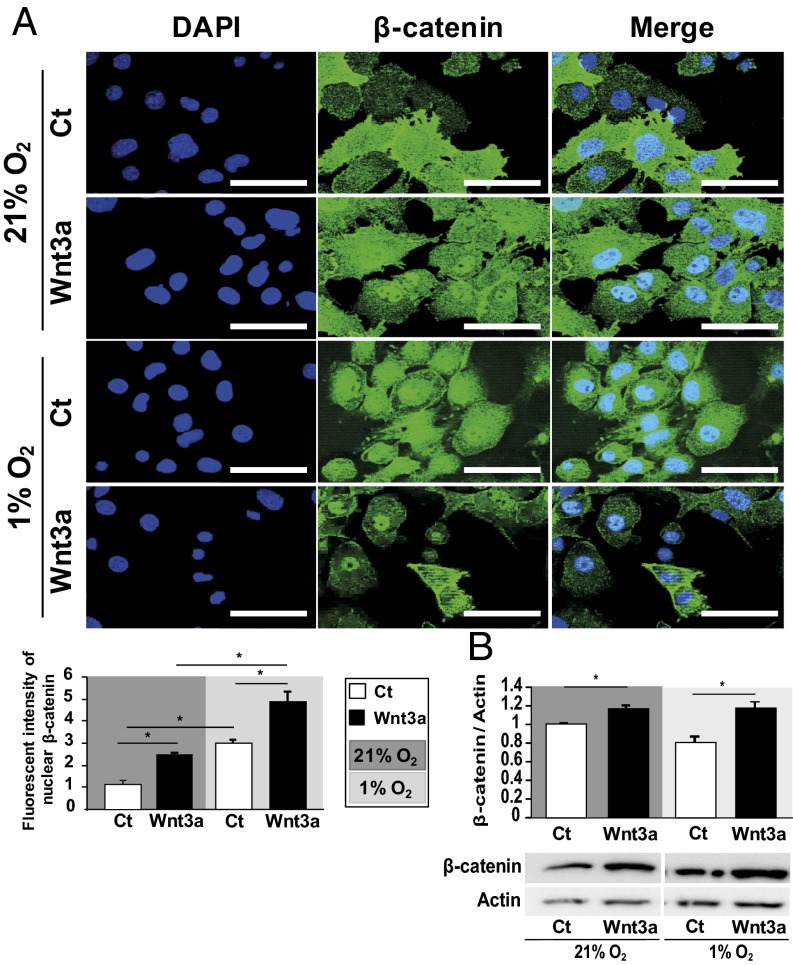
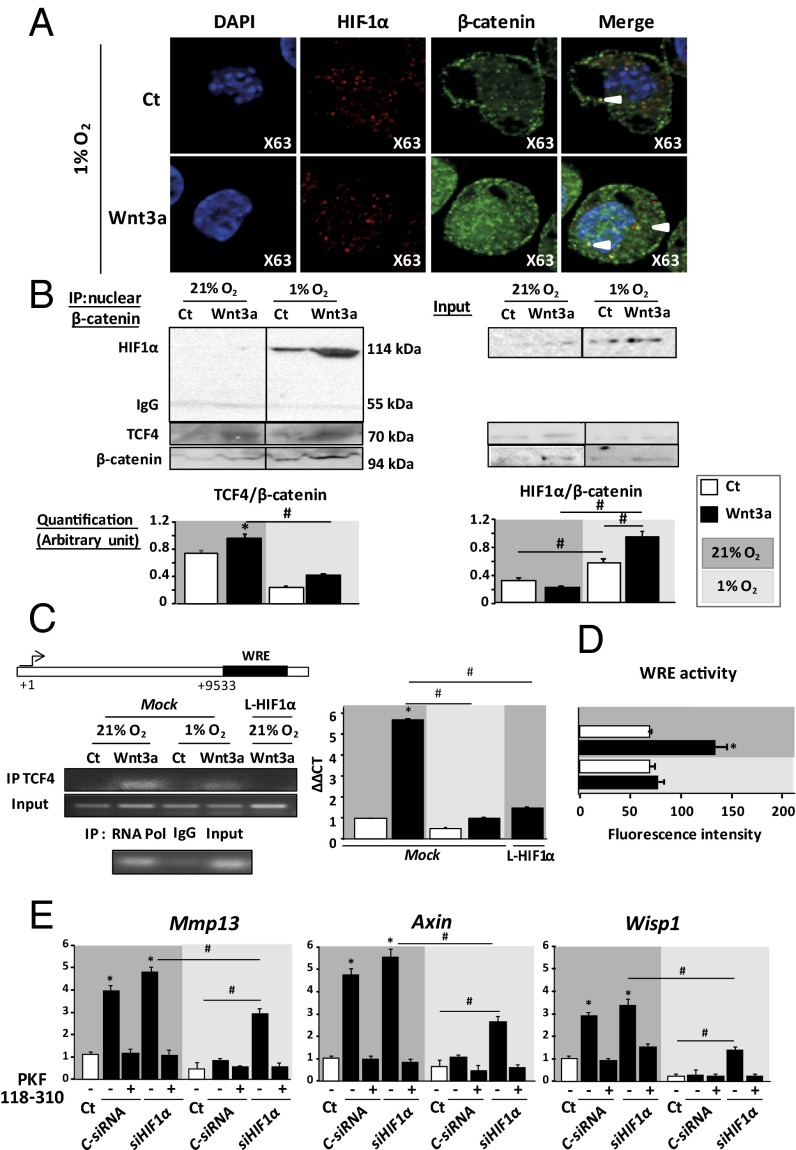
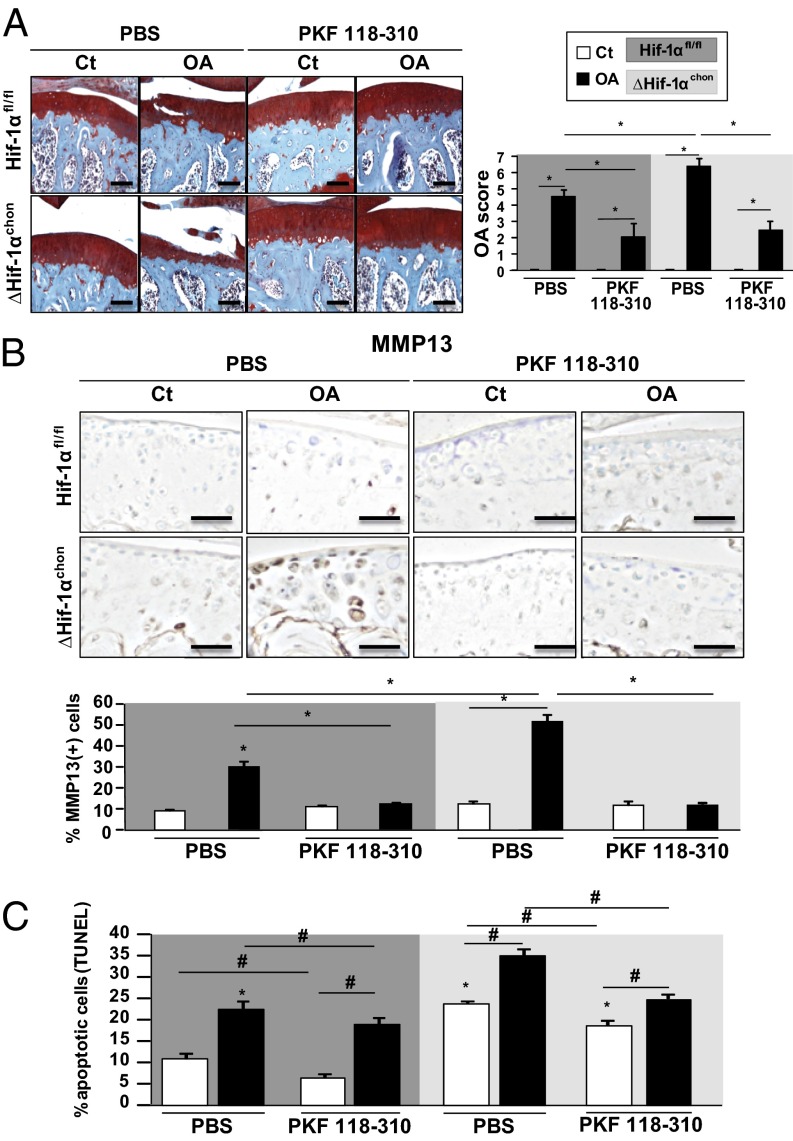
Low oxygen tension (hypoxia) regulates chondrocyte differentiation and metabolism. Hypoxia-inducible factor 1α (HIF1α) is a crucial hypoxic factor for chondrocyte growth and survival during development. The major metalloproteinase matrix metalloproteinase 13 (MMP13) is also associated with chondrocyte hypertrophy in adult articular cartilage, the lack of which protects from cartilage degradation and osteoarthritis (OA) in mice. MMP13 is up-regulated by the Wnt/β-catenin signaling, a pathway involved in chondrocyte catabolism and OA. We studied the role of HIF1α in regulating Wnt signaling in cartilage and OA. We used mice with conditional knockout of Hif1α (∆Hif1α(chon)) with joint instability. Specific loss of HIF1α exacerbated MMP13 expression and cartilage destruction. Analysis of Wnt signaling in hypoxic chondrocytes showed that HIF1α lowered transcription factor 4 (TCF4)-β-catenin transcriptional activity and inhibited MMP13 expression. Indeed, HIF1α interacting with β-catenin displaced TCF4 from MMP13 regulatory sequences. Finally, ΔHif1α(chon) mice with OA that were injected intraarticularly with PKF118-310, an inhibitor of TCF4-β-catenin interaction, showed less cartilage degradation and reduced MMP13 expression in cartilage. Therefore, HIF1α-β-catenin interaction is a negative regulator of Wnt signaling and MMP13 transcription, thus reducing catabolism in OA. Our study contributes to the understanding of the role of HIF1α in OA and highlights the HIF1α-β-catenin interaction, thus providing new insights into the impact of hypoxia in articular cartilage.
Keywords: Wnt signaling; chondrocyte; hypoxia-inducible factor 1α; matrix metalloprotease 13; osteoarthritis.
Conflict of interest statement
The authors declare no conflict of interest.
Figures
Comment in
-
Osteoarthritis: Hypoxia protects against cartilage loss by regulating Wnt signalling.Nat Rev Rheumatol. 2016 Jun;12(6):315. doi: 10.1038/nrrheum.2016.66. Epub 2016 May 12. Nat Rev Rheumatol. 2016. PMID: 27170507 No abstract available.
Similar articles
-
GDF5 reduces MMP13 expression in human chondrocytes via DKK1 mediated canonical Wnt signaling inhibition.Osteoarthritis Cartilage. 2014 Apr;22(4):566-77. doi: 10.1016/j.joca.2014.02.004. Epub 2014 Feb 19. Osteoarthritis Cartilage. 2014. PMID: 24561281
-
Velvet antler polypeptide partially rescue facet joint osteoarthritis-like phenotype in adult β-catenin conditional activation mice.BMC Complement Altern Med. 2019 Jul 30;19(1):191. doi: 10.1186/s12906-019-2607-4. BMC Complement Altern Med. 2019. PMID: 31362725 Free PMC article.
-
Bushenhuoxue formula attenuates cartilage degeneration in an osteoarthritic mouse model through TGF-β/MMP13 signaling.J Transl Med. 2018 Mar 20;16(1):72. doi: 10.1186/s12967-018-1437-3. J Transl Med. 2018. PMID: 29554973 Free PMC article.
-
Molecular regulation of articular chondrocyte function and its significance in osteoarthritis.Histol Histopathol. 2011 Mar;26(3):377-94. doi: 10.14670/HH-26.377. Histol Histopathol. 2011. PMID: 21210351 Review.
-
Insights on biology and pathology of HIF-1α/-2α, TGFβ/BMP, Wnt/β-catenin, and NF-κB pathways in osteoarthritis.Curr Pharm Des. 2012;18(22):3293-312. doi: 10.2174/1381612811209023293. Curr Pharm Des. 2012. PMID: 22646092 Review.
Cited by
-
Osteoarthritis: Hypoxia protects against cartilage loss by regulating Wnt signalling.Nat Rev Rheumatol. 2016 Jun;12(6):315. doi: 10.1038/nrrheum.2016.66. Epub 2016 May 12. Nat Rev Rheumatol. 2016. PMID: 27170507 No abstract available.
-
Bioinformatics identification of ferroptosis-related genes and therapeutic drugs in rheumatoid arthritis.Front Med (Lausanne). 2023 Jul 13;10:1192153. doi: 10.3389/fmed.2023.1192153. eCollection 2023. Front Med (Lausanne). 2023. PMID: 37521346 Free PMC article.
-
Hypoxia-induced Wnt/β-catenin signaling activation in subchondral bone osteoblasts leads to an osteoarthritis-like phenotype of chondrocytes in articular cartilage.Front Mol Biosci. 2023 Apr 21;10:1057154. doi: 10.3389/fmolb.2023.1057154. eCollection 2023. Front Mol Biosci. 2023. PMID: 37152900 Free PMC article.
-
SIRT3-PINK1-PKM2 axis prevents osteoarthritis via mitochondrial renewal and metabolic switch.Bone Res. 2025 Mar 14;13(1):36. doi: 10.1038/s41413-025-00413-4. Bone Res. 2025. PMID: 40087281 Free PMC article.
-
Identification and verification of ferroptosis-related genes in the synovial tissue of osteoarthritis using bioinformatics analysis.Front Mol Biosci. 2022 Aug 29;9:992044. doi: 10.3389/fmolb.2022.992044. eCollection 2022. Front Mol Biosci. 2022. PMID: 36106017 Free PMC article.
References
-
- Maes C, Carmeliet G, Schipani E. Hypoxia-driven pathways in bone development, regeneration and disease. Nat Rev Rheumatol. 2012;8(6):358–366. - PubMed
-
- Maes C, et al. VEGF-independent cell-autonomous functions of HIF-1α regulating oxygen consumption in fetal cartilage are critical for chondrocyte survival. J Bone Miner Res. 2012;27(3):596–609. - PubMed
-
- Gezer D, Vukovic M, Soga T, Pollard PJ, Kranc KR. Concise review: Genetic dissection of hypoxia signaling pathways in normal and leukemic stem cells. Stem Cells. 2014;32(6):1390–1397. - PubMed
Publication types
MeSH terms
Substances
LinkOut - more resources
Full Text Sources
Other Literature Sources
Medical
Molecular Biology Databases
