. 2016 May 10;113(19):E2675-84.
doi: 10.1073/pnas.1520759113. Epub 2016 Apr 27.

Astrocytes regulate cortical state switching in vivo

Affiliations

Astrocytes regulate cortical state switching in vivo

Kira E Poskanzer et al. Proc Natl Acad Sci U S A. .

Abstract

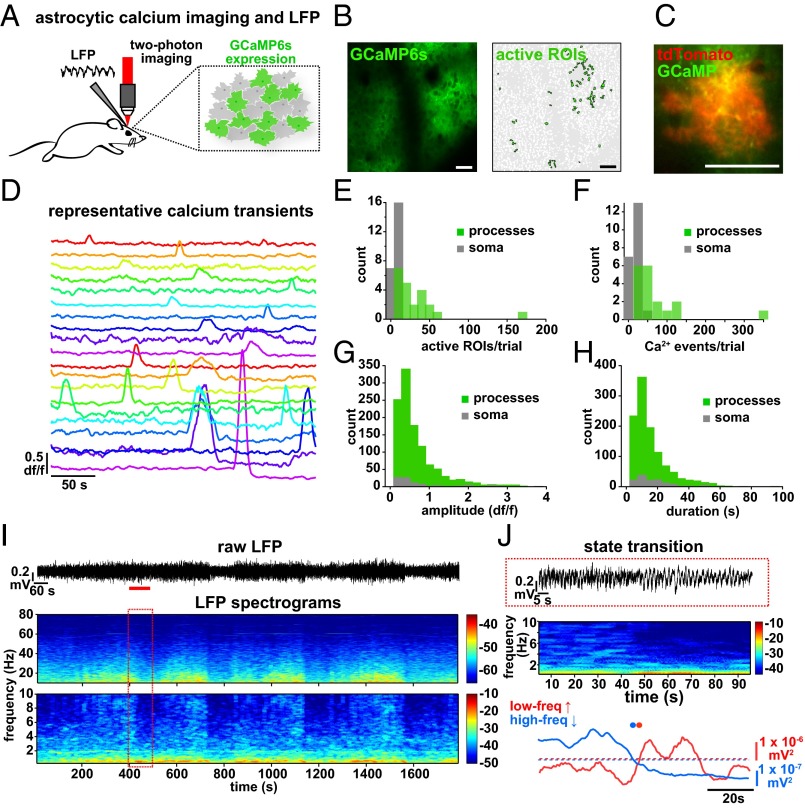
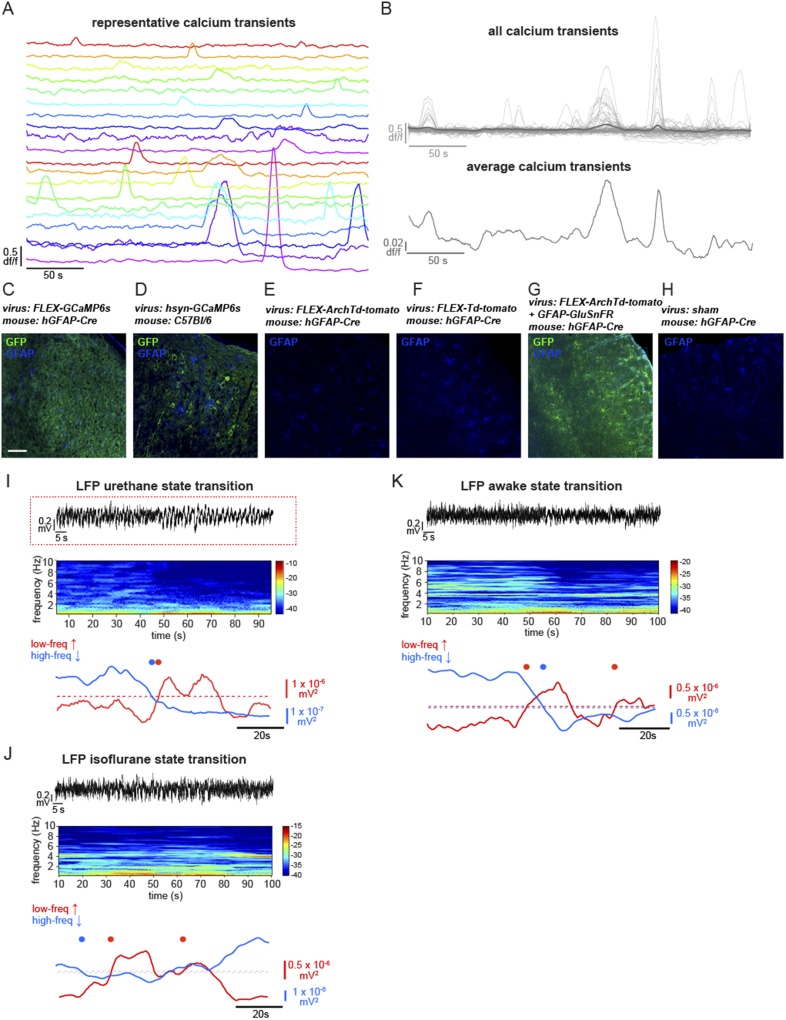
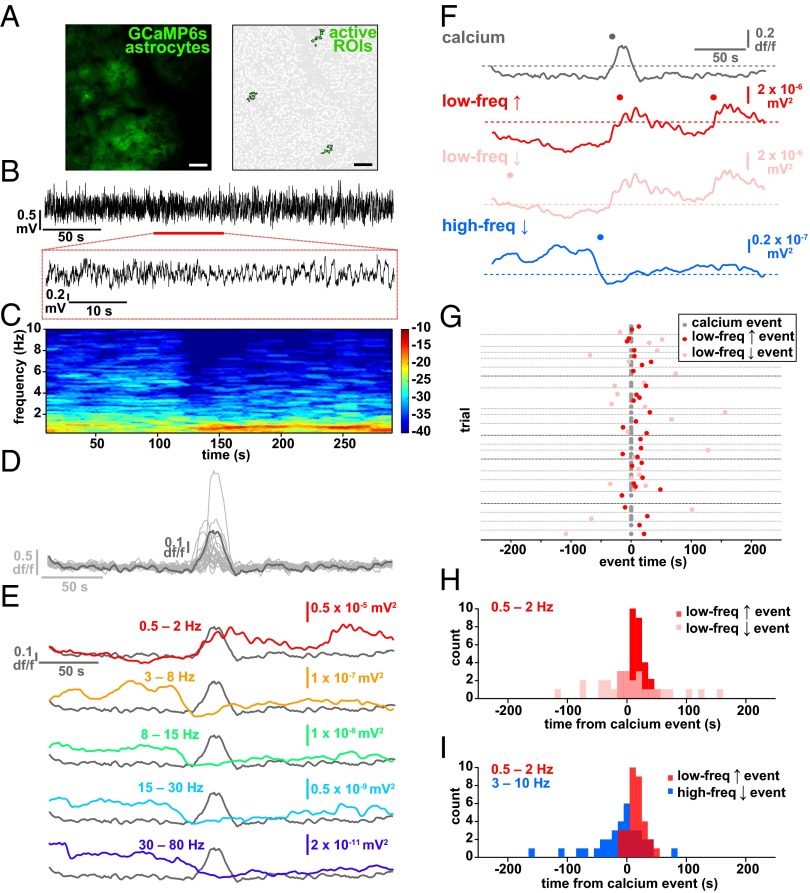
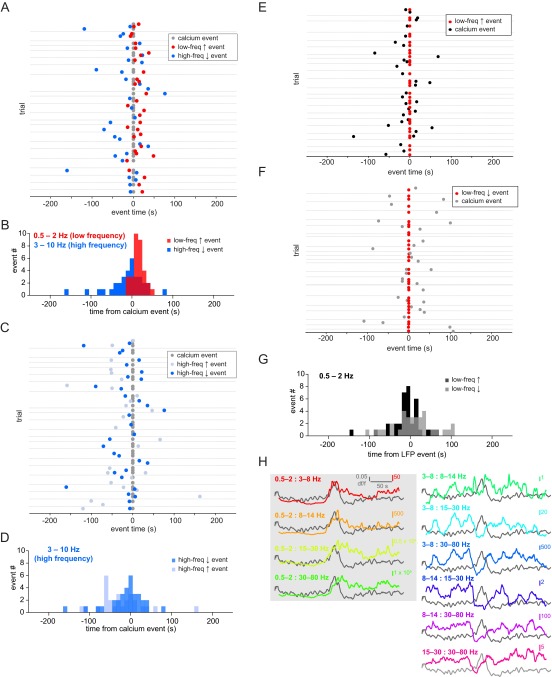
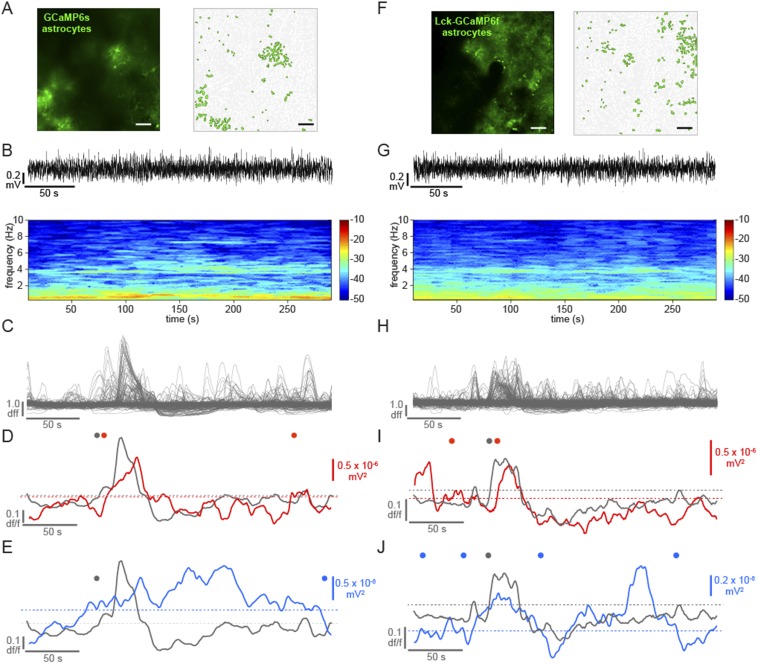
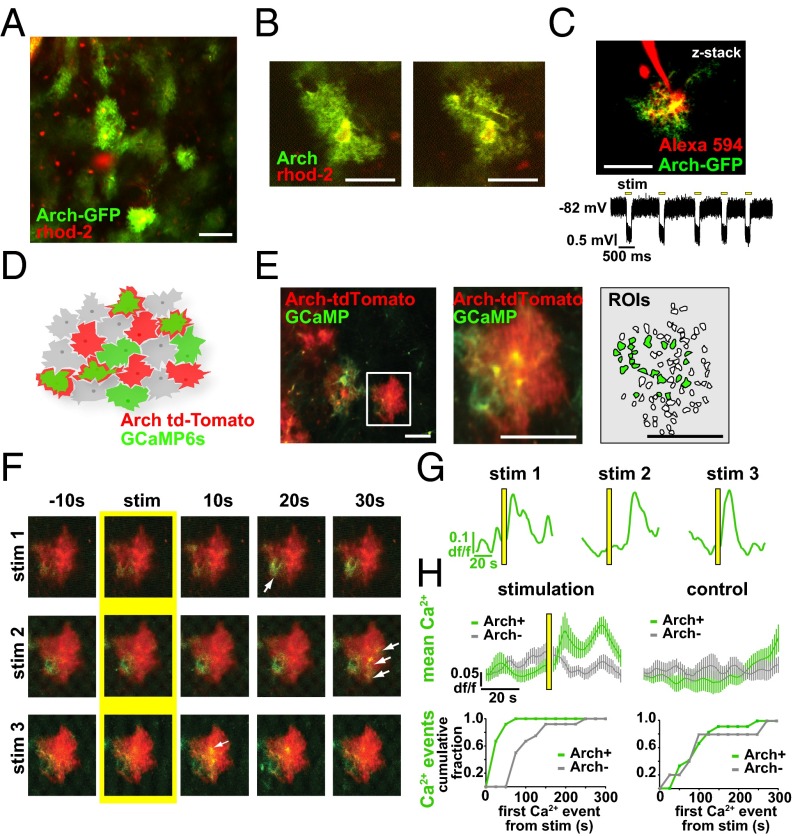
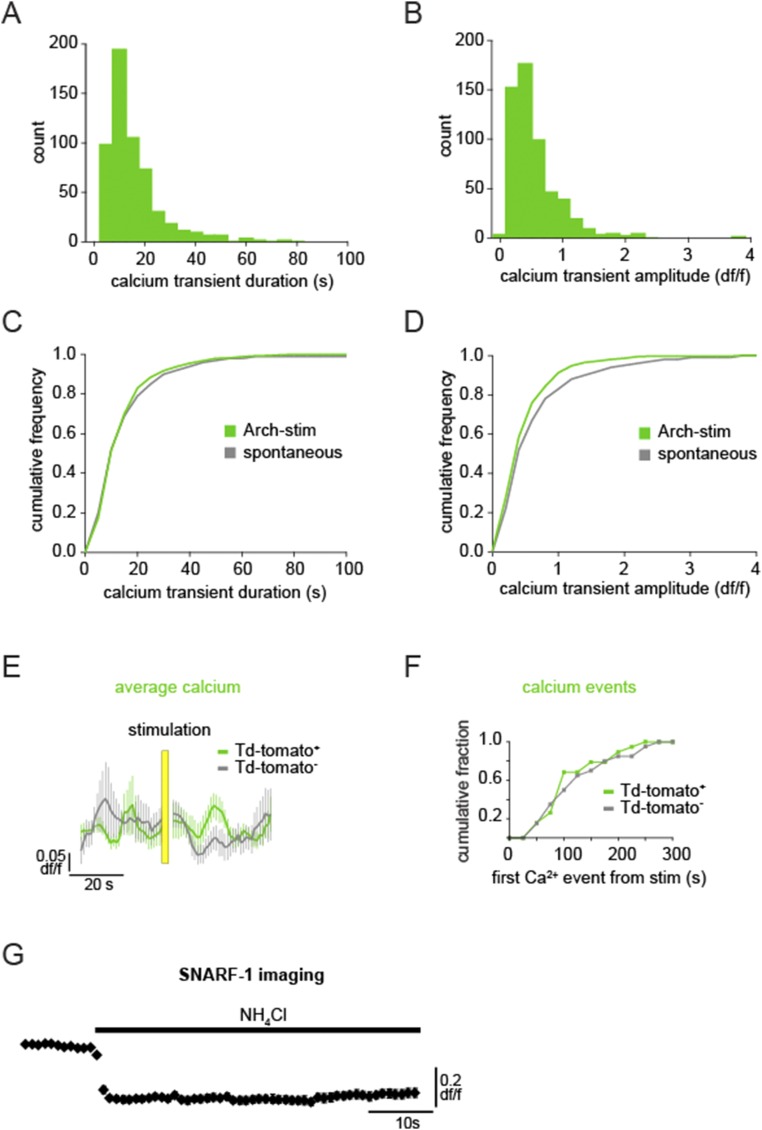
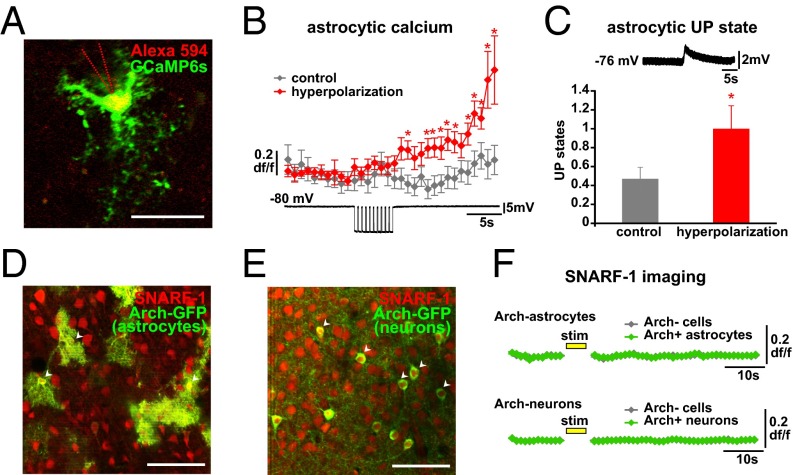
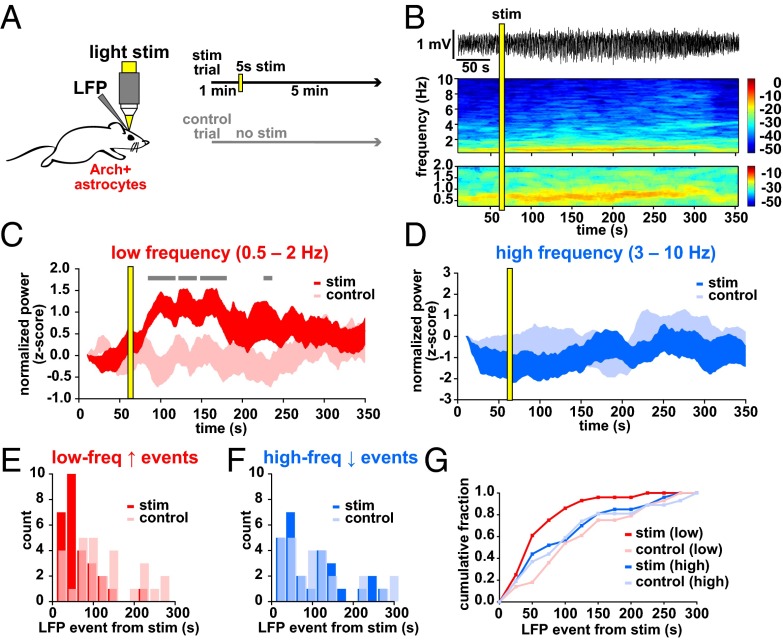
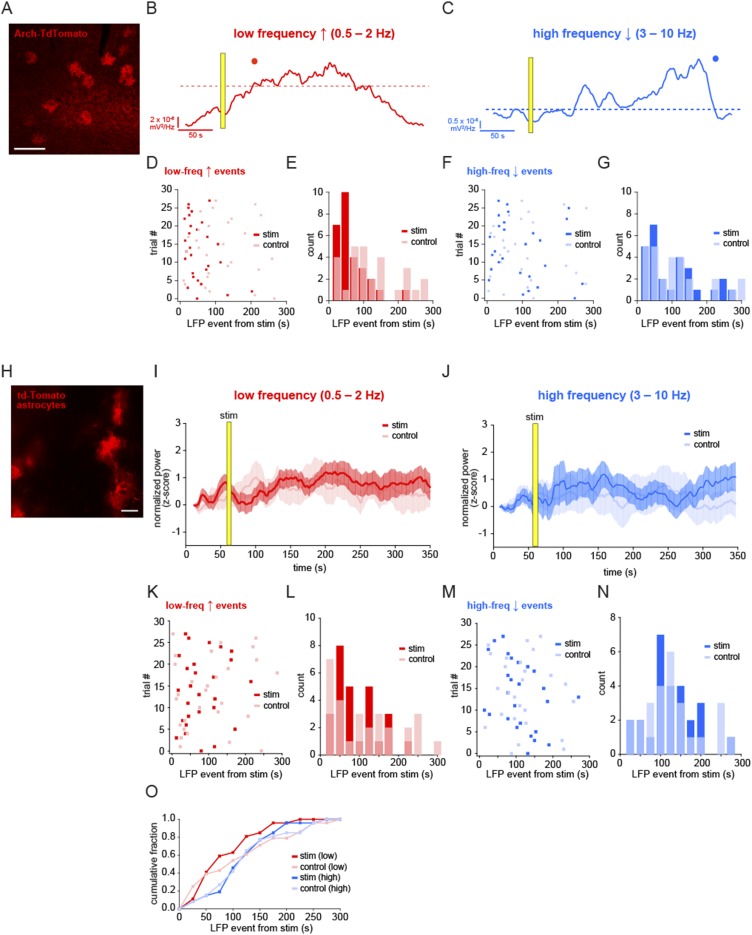
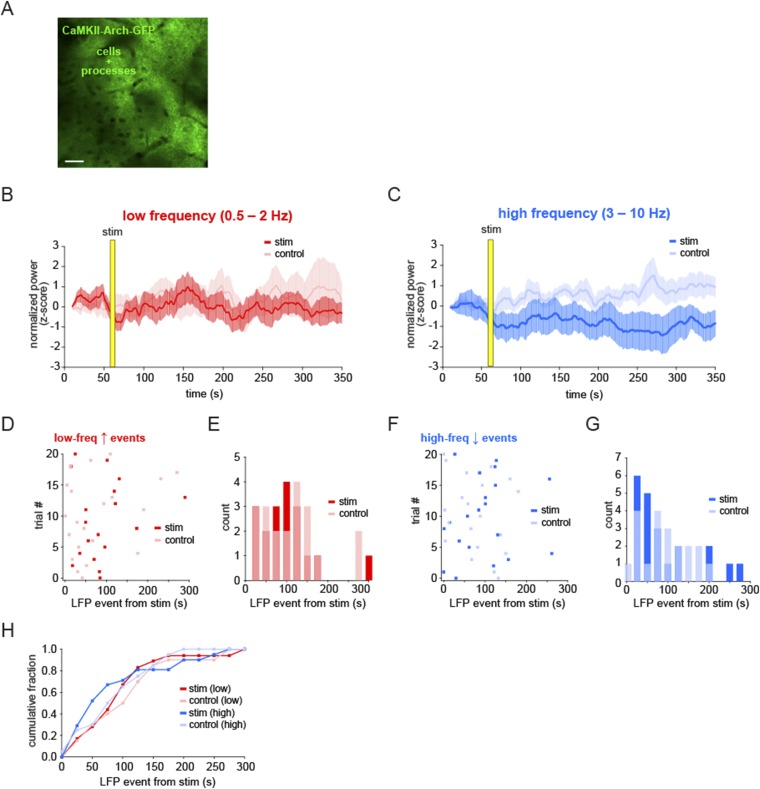
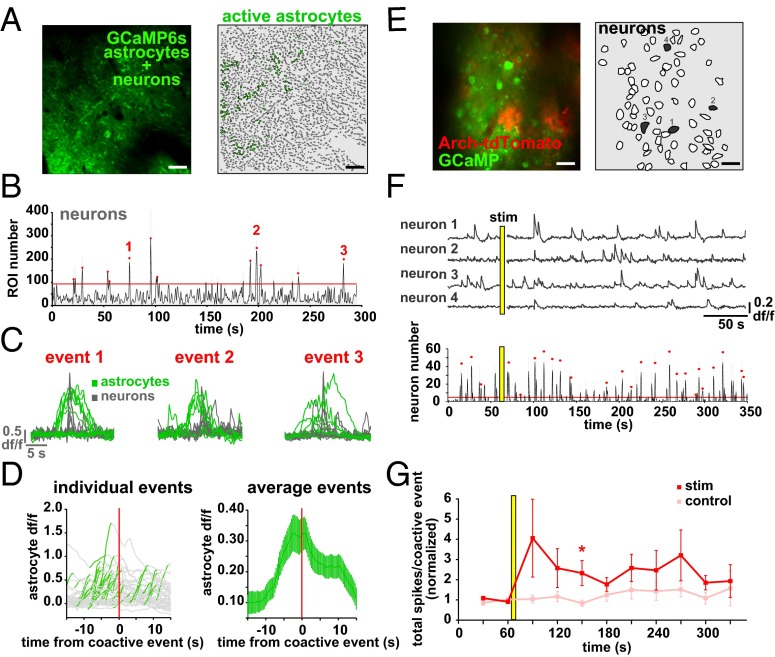
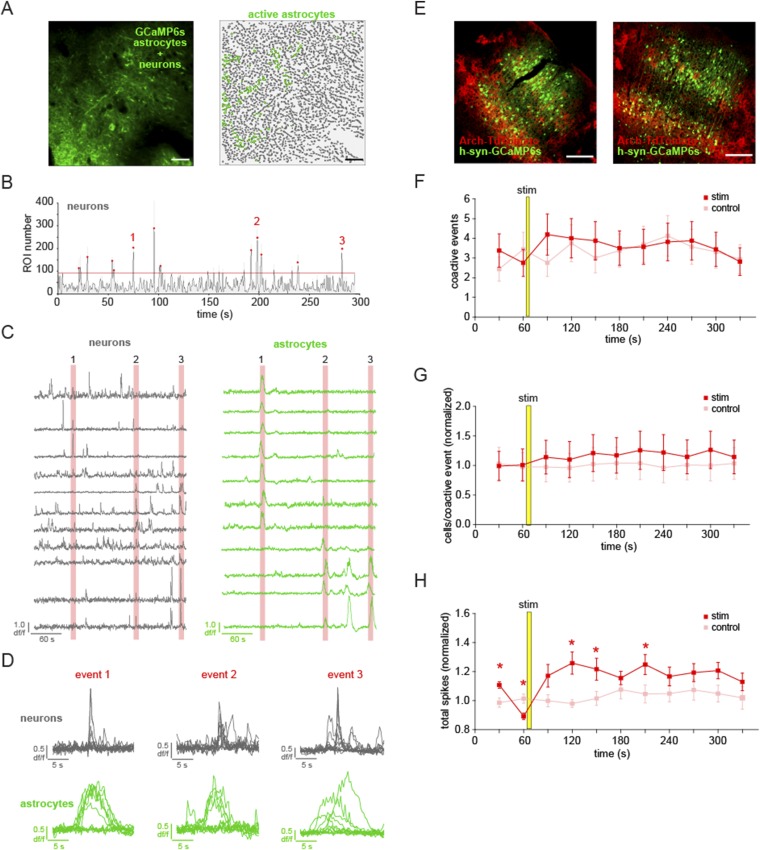
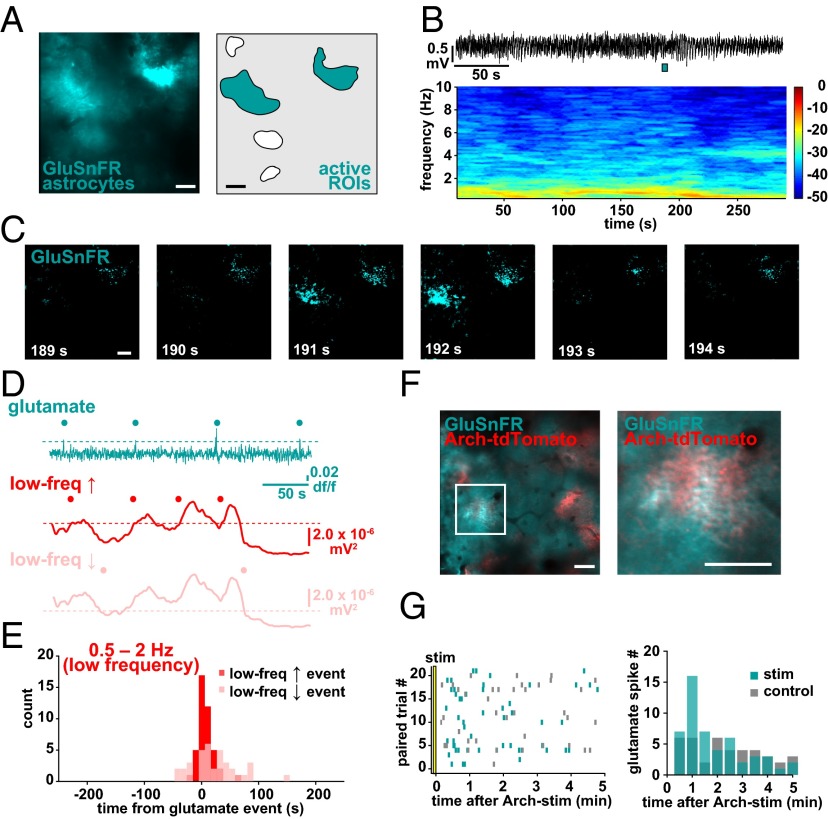
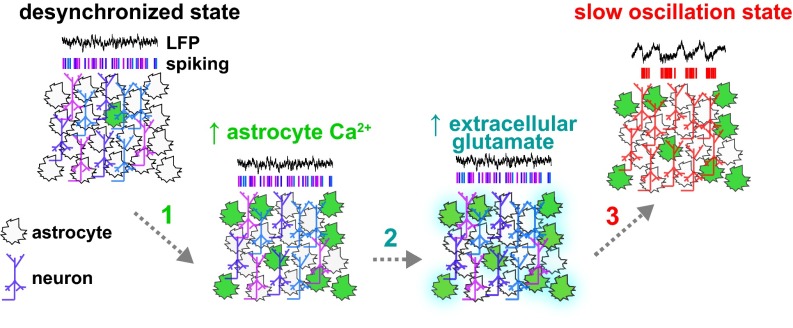
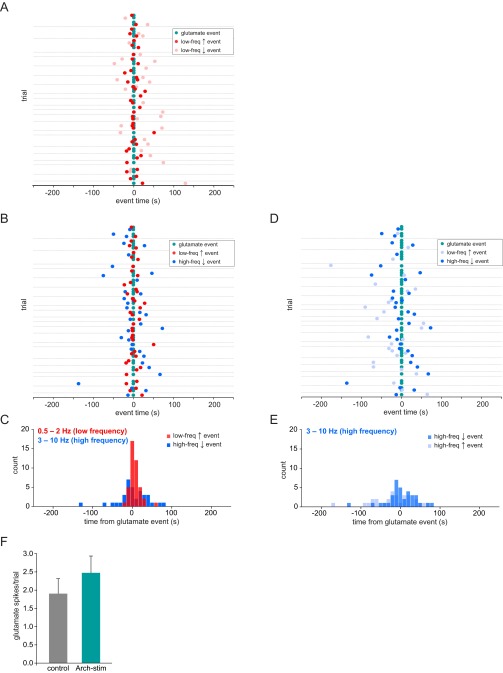
The role of astrocytes in neuronal function has received increasing recognition, but disagreement remains about their function at the circuit level. Here we use in vivo two-photon calcium imaging of neocortical astrocytes while monitoring the activity state of the local neuronal circuit electrophysiologically and optically. We find that astrocytic calcium activity precedes spontaneous circuit shifts to the slow-oscillation-dominated state, a neocortical rhythm characterized by synchronized neuronal firing and important for sleep and memory. Further, we show that optogenetic activation of astrocytes switches the local neuronal circuit to this slow-oscillation state. Finally, using two-photon imaging of extracellular glutamate, we find that astrocytic transients in glutamate co-occur with shifts to the synchronized state and that optogenetically activated astrocytes can generate these glutamate transients. We conclude that astrocytes can indeed trigger the low-frequency state of a cortical circuit by altering extracellular glutamate, and therefore play a causal role in the control of cortical synchronizations.

Keywords: astrocyte; calcium imaging; cortex; glutamate; slow oscillation.


Conflict of interest statement

The authors declare no conflict of interest.

Figures

Fig. 1.
Fig. 1.
Simultaneous in vivo Ca2+ imaging of cortical astrocytes with GCaMP6s and LFP recording of the local cortical state. (A) Experimental setup. Injection of AAV1-CAG.FLEX-GCaMP6s into GFAP-Cre mice results in GCaMP6s expression in a subset of cortical astrocytes and allows two-photon imaging and LFP recording. (B, Left) Expression of GCaMP6s in L2/3 of V1. Note the low baseline fluorescence, as is typical for GCaMP6s (31). (B, Right) Active ROIs from a 5-min movie of an imaging field (Movie S1). (C) Coexpression of GCaMP6s and tdTomato in a single astrocyte demonstrates expression of both fluorescent proteins throughout the astrocyte (Movie S2). [Scale bars, 50 μm (B and C).] (D) df/f Ca2+ traces from 20 representative ROIs in B. Note the heterogeneity of the amplitude and duration of transients. (EH) Statistics for Ca2+ imaging experiments in Fig. 2 (n = 22 5-min trials). (E) Distribution of subcellular localization of active ROIs per 5-min trial. Distribution of the number of Ca2+ events per experiment for all active ROIs (F) and amplitude (G) and duration (H) of all Ca2+ transients. ROIs from astrocyte somata are shown in gray and from processes are shown in green. (I) Raw LFP data of a 30-min recording in L2/3 of the cortex (Top) and resulting spectrograms calculated from raw LFP, separated into low (0.25–10 Hz) and high (10–80 Hz) graphs for clarity. Note the periodic state switching from the high frequency-dominated to the low frequency-dominated state. The red box corresponds to 100 s of LFP, marked by a red line in the raw trace. In spectrograms here and throughout paper, color bars are in units of 10*log(mV2). (J) Example of a state transition from a 100-s sample (red line) in I, with raw data (Top), spectrogram (Middle), and traces quantifying the power in low- and high-frequency bands (Bottom). Automatically detected increases in the low-frequency band above threshold (red dots) and decreases in the high-frequency band below threshold (blue dots) are plotted to emphasize the state transition to a slow-oscillation state.
Fig. S1.
Fig. S1.
In vivo Ca2+ imaging of cortical astrocytes with GCaMP6s and LFP recordings under various conditions. (A) Twenty representative Ca2+ signals from ROIs in the experiment in C. Note the heterogeneity of the amplitude and duration of transients. (B) df/f Ca2+ traces from all active ROIs in Fig. 1B, with average Ca2+ traces in dark gray overlaid (Top) and expanded in y axis (Bottom). (CH) Immunostained cortical slices for GFAP and various proteins in virally injected animals, including sham injections. (Scale bar, 100 μm.) (I) Example of a state transition under urethane anesthesia from a 100-s sample (red line) in Fig. 1I, with raw data (Top), resulting spectrogram (Middle), and traces quantifying the power in low- and high-frequency bands (Bottom). Automatically detected increases in the low-frequency band above threshold (red dot) and decreases in the high-frequency band below threshold (blue dot) are plotted to emphasize the state transition to a slow-oscillation state. Same data as Fig. 1J. (J and K) Similar state transitions are evident in LFP recordings in isoflurane-anesthetized (J) and awake animals (K), as in recordings from the urethane-anesthetized animals in A. The LFP recording in J is courtesy of J. Jackson, Columbia University, New York.
Fig. 2.
Fig. 2.
Astrocyte Ca2+ events precede the switch to the slow-oscillation state. (A) Astrocyte-specific expression of GCaMP6s (Left) and active ROIs (Right). (Scale bars, 50 μm.) (B) Raw 5-min LFP recording at the site shown in A. The expanded area in the red box (Bottom) shows an example of a shift to a slow-oscillation–dominated regime. (C) Power spectrogram of 0.25- to 10-Hz frequencies in the LFP shown in B. Note the transition to the slow-oscillation state (0.5–2 Hz; increase in red). (D) Ca2+ traces from 22 active ROIs in A (light gray) and the average of all traces in dark gray. (E) Overlay of astrocyte Ca2+ and the mean of frequency change to bands to 80 Hz. (F) Automatically detected mean Ca2+ (gray), low-frequency (0.5–2 Hz) increase (red) and decrease (pink) events, and high-frequency (3–10 Hz; blue) decrease events (dots) above thresholds (dashed lines). (G) All low-frequency LFP events from Ca2+ event time. Only the nearest LFP events to the Ca2+ event are shown for clarity. Gray dots represent automatically detected average Ca2+ events, and red and pink dots show LFP low-frequency increase and decrease events, respectively. Gray horizontal lines separate each 5-min trial. Darker gray lines indicate trials from different animals. (H) Distribution of events shown in G. (I) Distribution of all low-frequency increase events plotted with all high-frequency decrease events from all trials.
Fig. S2.
Fig. S2.
Temporal relationship between astrocytic Ca2+ and brain state switches. (A) LFP and Ca2+ data from all 22 trials shown in Fig. 1 and quantified in Fig. 1I. Gray dots represent automatically detected average Ca2+ events, and red and blue dots show LFP low-frequency increases and high-frequency decreases, respectively. Gray horizontal lines separate individual 5-min trials. (B) Data from A replotted as a histogram to highlight that the majority of low-frequency increase events start in the 20 s following the Ca2+ event, whereas the high-frequency decrease events are more evenly distributed around the Ca2+ event. (C) Same data from A and B and Fig. 1 plotted, with all increase (light blue) and decrease (blue) high-frequency events shown. (D) Histogram of all data from C. These two datasets do not have statistically significantly different distributions (two-sample F test). (E) Same data as in AC replotted with Ca2+ events (black) triggered from low-frequency increases (red; event time 0). (F) Same analysis as in E, but with Ca2+ event time (gray) from each low-frequency decrease (red). (G) Frequency histogram of all data from E and F. (H) Ca2+ data from the examples in Fig. 2 AF plotted against the ratio of a set of standard frequency bands (0.5–2, 3–8, 8–14, 15–30, and 30–80 Hz) to each other. A gray box shades the four graphs with the lowest-frequency band in the numerator of the ratio, highlighting the dominance of this frequency band’s correspondence with the average astrocyte Ca2+ activity.
Fig. S3.
Fig. S3.
Desynchronized astrocytic Ca2+ activity, measured with cytosolic and membrane-bound GCaMP6, is also temporally correlated with slow oscillation. Average astrocytic GCaMP6s (AE) and Lck-GCaMP6f (FJ) activity closely precedes the shift to slow oscillation. (A and F) GCaMP6 expression and active ROIs. (Scale bars, 50 μm.) (B and G) Raw 5-min LFP trace (Top) and resulting spectrogram (0.25–10 Hz; Bottom). (C and H) All active astrocytic ROIs. Compare these desynchronized Ca2+ signals with the synchronized transients in the example in Fig. 2D. (D and I) Average astrocyte Ca2+ trace (gray line) and Ca2+ event (gray dots) plotted with mean of the low-frequency band (0.5–2 Hz; red line) and automatically detected low-frequency increase events (red dots). Note the closely timed gray and red dots. (E and J) Average astrocyte Ca2+ trace (gray line) and Ca2+ event (gray dots) plotted with the mean of the high-frequency band (3–10 Hz; blue line) and automatically detected high-frequency decrease events (blue dots). Dashed lines indicate the respective thresholds.
Fig. 3.
Fig. 3.
Optogenetic activation of Archaerhodopsin (Arch) in cortical astrocytes drives Ca2+ increases. (A and B) Astrocyte-specific expression of Arch-GFP (green) throughout the astrocyte processes with stereotyped astrocyte morphology. Astrocyte somata are specifically labeled with rhod-2 (red). (C) Astrocyte in cortical slice expressing Arch-GFP and whole-cell patch-clamped with Alexa Fluor 594 in the pipette (Top). Yellow light stimulation causes the astrocyte to hyperpolarize (Bottom). (D) Cartoon of coexpressed astrocytic GCaMP6s and Arch-tdTomato. (E) Coexpression of GCaMP6s and Arch-tdTomato in vivo (Left), zoomed-in to show a single coexpressing cell (Middle), with automatically detected ROIs used for analysis and active ROIs shaded in green (Right). (F) Three successive stimulation (5-s) trials of the GCaMP+/Arch+ astrocyte from E. Yellow highlights the frame before stimulus onset and white arrows point to GCaMP fluorescence increases in astrocyte processes poststimulus. (G) Mean astrocyte Ca2+ dynamics in each of the three trials in F. Yellow bars denote stimulus throughout the figure. (H, Top) Average Ca2+ across animals in all stimulation (Left) and no-stimulation (control; Right) trials in GCaMP+/Arch+ astrocytes (green) and GCaMP+/Arch astrocytes (gray) ± SEM. (H, Bottom) Time from light stimulus to first Ca2+ event, as detected in Fig. 1 in stimulation (Left) and control (Right) trials. [Scale bars, 50 μm (A, C, and E) and 25 μm (B).]
Fig. S4.
Fig. S4.
Arch stimulation causes physiological astrocytic Ca2+ increases, whereas light activation alone does not increase astrocytic Ca2+. (A and B) Histogram of Ca2+ transient duration (A) and amplitude (B) following light stimulation of Arch+/GCaMP6+ astrocytes. (C and D) Arch-stimulated Ca2+ responses compared with spontaneous astrocyte Ca2+ activity. (E) Average Ca2+ dynamics ± SEM in the astrocyte soma and processes coexpressing tdTomato and GCaMP6s following 5-s light stimulation, as used in the optogenetic experiments. There is no significant change due to the light stimulus in either tdTomato+/GCaMP+ astrocytes (green) or tdTomato/GCaMP+ controls (gray). (F) Distribution of automatically detected Ca2+ events from the time of stimulation in tdTomato+/GCaMP+ (green) or tdTomato/GCaMP+ (gray) cells indicates no stimulus-dependent difference between cell types (two-sample F test). (G) Intracellular alkalinization upon application of NH4Cl in the bath causes a decrease in SNARF-1 fluorescence in all loaded cells in the cortical slice.
Fig. 4.
Fig. 4.
Mechanisms of Arch activation of astrocytes. (A) GCaMP6s-expressing astrocyte (green) under whole-cell patch clamp using a pipette filled with Alexa Fluor 594 (red) to confirm the correct cell. Single two-photon image; the pipette outline is shown with dashed lines because the pipette is out of the optical plane. (Scale bar, 50 μm.) (B) GCaMP Ca2+ dynamics in patched astrocytes in hyperpolarization (red) and control (gray) trials. Example of astrocyte electrophysiological recording, including hyperpolarization period, shown below Ca2+ data (*P < 0.05, t test; n = 10 cells, 34 110-s paired trials). (C, Top) Stereotypical astrocytic UP state (20) used to quantify network synchronization following hyperpolarization. (C, Bottom) Increased UP states following single-astrocyte hyperpolarization from same experiment as in B. (D and E) Two-photon single-plane images of SNARF-1 loading of astrocytes and neurons in slice (red) and specific Arch-GFP expression (green) in either astrocytes (D) or neurons (E). White arrowheads indicate double-labeled somata of the respective cell types. (Scale bars, 50 μm.) (F) SNARF-1 fluorescence dynamics before and after Arch stimulation (yellow bar; 5 s) of astrocytes (Top) and neurons (Bottom) in Arch+ cells (green) and surrounding Arch cells (gray) (astrocytes: n = 15 Arch+ cells, 264 Arch cells, 8 110-s trials each; neurons: n = 46 Arch+ cells, 313 Arch cells, 8 110-s trials each). Error bars are ± SEM.
Fig. 5.
Fig. 5.
Arch activation of astrocytes shifts the circuit into a slow-oscillation regime. (A) Schematic of the Arch/LFP experiment. Stimulation trials consisted of a 1-min baseline, 5-s stimulation, and 5-min recording, with an interleaved control trial of the same total duration. (B) Example LFP recording from a stimulation experiment (Top) and the corresponding spectrogram of 0.25–10 Hz (Middle) and 0.25–2 Hz (Bottom). (C and D) Normalized (z-score) low-frequency (C) and high-frequency (D) LFP power in stimulation and control trials ±SEM. In C, gray bars denote significance compared with controls (P < 0.05, t test). (EG) Automatically detected low-frequency (0.5–2 Hz; E) and high-frequency (3–10 Hz; F) LFP events as quantified in previous figures, plotted as time from Arch stimulation to LFP event in stimulation (red and blue) and control (pink and light blue) trials. Events are plotted in 25-s bins, and all conditions are plotted as a cumulative histogram (G).
Fig. S5.
Fig. S5.
Specific shift in low-frequency LFP events following Arch activation of astrocytes. (A) Immunostaining of Arch-tdTomato–positive astrocytes with Arch antibody. (Scale bar, 200 μm.) (B and C) Power of low-frequency (red) and high-frequency (blue) bands in the example shown in Fig. 5B. Automatic thresholds (dashed lines) and events (dots) are shown for each frequency band. (D and F) The first automatically detected LFP event from each stimulation (red and blue) and interleaved control trial (pink and light blue) from the time of stimulation. (E and G) Distribution of the first LFP event times from stimulation for both low-frequency (0.5–2 Hz) and high-frequency (3–10 Hz) bands and shown in Fig. 5 E and F. (H) Astrocytic expression of tdTomato in the L2/3 cortex. (Scale bar, 50 μm.) (I and J) Mean normalized LFP ± SEM for low-frequency (red) and high-frequency (blue) bands following 5-s light stimulation (yellow bar) and in interleaved no-stimulation control trials (pink and light blue). (K and M) First-detected LFP events after stimulation in light- and no-stimulation trials for all experiments. There is no statistically significant difference between stim and control trials in either frequency (mean low-frequency increase event from stim 80.4 ± 10.4 s vs. 103.4 ± 16.1 s control; P > 0.1, t test; mean high-frequency decrease event from stim 109.7 ± 11.4 s vs. 118.5 ± 12.9 s control; P > 0.5, t test). (L, N, and O) Histograms of the distribution of LFP events (L and N) and cumulative distributions (O) upon light stimulation of the cortex with tdTomato-expressing astrocytes.
Fig. S6.
Fig. S6.
Arch-dependent shift to slow oscillation is not due to nonspecific neuronal expression and activation of Arch. (A) Expression of Arch in cortical pyramidal neurons and their processes. (Scale bar, 50 μm.) (B and C) Mean normalized LFP ± SEM for low-frequency (red) and high-frequency (blue) bands following 5-s light stimulation (red and blue) and in interleaved no-stimulation control trials (pink and light blue). (D and F) First-detected LFP events after stimulation time in light- and no-stimulation trials for all experiments. There is no statistically significant difference between stim and control trials in either frequency (mean low-frequency event from stim 88.7 ± 15.5 s vs. 76.4 ± 17.1 s control; P > 0.5, t test; mean high-frequency event from stim 95.2 ± 16.3 s vs. 78.9 ± 12.7 s control; P > 0.1, t test). (E, G, and H) Histograms of distribution of LFP events (E and G) and cumulative distributions (H) indicate no significant change in LFP upon light stimulation of Arch-expressing neurons in the cortex (two-sample F test, for low frequency and for high frequency).
Fig. 6.
Fig. 6.
Astrocytic activity precedes synchronous neuronal events, and Arch activation of astrocytes increases coactive neuronal spiking. (A) Simultaneous expression of GCaMP6s in neurons and astrocytes (Left) and active astrocytic (green) ROIs (Right). (B) Large neuronal coactive events (red dots) detected above threshold (red line). No astrocytic ROIs are included in coactive event detection. (C) Eleven representative neuronal (gray) and astrocytic (green) ROIs, zoomed-in to display the difference in dynamics between neuronal (gray) and astrocytic (green) ROIs during three representative coactive events. When superimposed, it is evident that slower astrocyte transients precede synchronous neuronal events. (D, Left) Average of all active astrocytic ROIs 15 s before and after each neuronal coactive event (red line; n = 45 events). The increase in each average astrocyte Ca2+ is colored green. (D, Right) Mean ± SEM of astrocyte Ca2+ activity around all coactive neuronal events. (E) Simultaneous expression of Arch-tdTomato in astrocytes and GCaMP6s in neurons in the same field, with corresponding neuronal ROIs for analysis. (F, Top) Example Ca2+ traces of the four numbered neurons in E. (F, Bottom) Neuronal action potential firing during stimulation trial, with coactive events marked by red dots. (G) Average total neuronal firing within all coactive events ± SEM grouped in 30-s bins, normalized to the average in the first two bins (prestim) for stimulated (red) and interleaved control (pink) trials. An asterisk marks the bin with a statistically significant difference between conditions (P < 0.05, t test). A yellow bar denotes a 5-s stimulus throughout the figure. (Scale bars, 50 μm.)
Fig. S7.
Fig. S7.
Distinguishing astrocytic and neuronal signals during synchronous neuronal events, and Arch activation of astrocytes increases coactive spiking in neurons. (A) Expression of GCaMP6s in neurons and astrocytes (Left) and active astrocytic (green) and neuronal (gray) ROIs (Right) as shown in Fig. 6 AE. (Scale bars, 50 μm.) (B) Large neuronal coactive events (red dots) detected above threshold (red line). (C) Eleven representative neuronal (gray) and astrocytic (green) ROIs. (D) Traces in B zoomed-in to display the difference in dynamics between neuronal (gray) and astrocytic (green) ROIs during three representative coactive events. (E) Immunostaining of two examples of Arch-expressing astrocytes and GCaMP6s-expressing neurons in the same area of the cortex with Arch (red) and GFP (green) antibodies. (Scale bars, 200 μm.) (FH) Mean neuronal firing parameters ± SEM grouped in 30-s bins for Arch-stimulated (red) and interleaved control (pink) trials before and after stimulus (yellow bar). (F) Number of coactive events per bin. (G) Number of cells active in each coactive event (normalized to the average of the first two bins). (H) Total action potentials (normalized) fired by all cells during the coactive events within each bin. *P < 0.05.
Fig. 7.
Fig. 7.
Astrocytic GluSnFR spikes occur at the switch to the slow oscillation. (A) GluSnFR expression in astrocytes in vivo (Left) and corresponding ROIs chosen for analysis (Right). (B) Simultaneous LFP recording (Top) and corresponding spectrogram (Bottom) during GluSnFR imaging. (C) Example of GluSnFR fluorescence throughout two astrocytes in the imaging field in A. Images correspond in time to the cyan bar under LFP in B, Top. (D) Glutamate (cyan) and low-frequency increase (red) and decrease (pink) traces and events (dots) from the experiments in AC. (E) Distribution of LFP events (up, red; down, pink) relative to glutamate spikes (at time 0). (F) Astrocytic coexpression of GluSnFR and Arch-tdTomato in vivo. The astrocyte in the white box (Left) is magnified (Right) to demonstrate the colocalization of proteins on astrocyte processes. (G, Left) Raster plot of all glutamate spikes in Arch+/GluSnFR+ astrocytes in paired (control, gray; stim, cyan) trials. (G, Right) Distribution of GluSnFR spikes in paired trials, in 30-s bins. (Scale bars, 50 μm.)
Fig. 8.
Fig. 8.
Model. During desynchronized epochs, populations of neurons do not fire in a coordinated fashion and astrocytic Ca2+ signaling is low. Astrocyte Ca2+ activity increases in the local circuit through a variety of mechanisms (arrow 1; green), followed by (arrow 2) accumulation of extracellular glutamate (cyan) and a shift (arrow 3) into the slow-oscillation state.
Fig. S8.
Fig. S8.
Defining the temporal relationship between extracellular glutamate and brain state. (A) All data from simultaneous GluSnFR and LFP recordings (same 22 5-min trials as in Fig. 4). Cyan dots represent glutamate “spikes,” and low-frequency events are plotted in relation to these spikes (red, increase; pink, decrease). Gray horizontal lines separate individual trials. (B and C) Same data, with low-frequency increase (red) and high-frequency decrease (blue) events plotted (B), with a histogram of all data (C). (D and E) Same data, with high-frequency increase (light blue) and decrease (blue) events plotted in relation to glutamate spikes (cyan), and a distribution of events (E). (F) Number of glutamate spikes in GluSnFR+/Arch+ astrocytes in control (gray; Left) and stimulated (blue; Right) trials. Error bars are ± SEM.

References

    1. Steriade M, Nuñez A, Amzica F. A novel slow (< 1 Hz) oscillation of neocortical neurons in vivo: Depolarizing and hyperpolarizing components. J Neurosci. 1993;13(8):3252–3265. - PMC - PubMed
    1. Hughes SW, Cope DW, Blethyn KL, Crunelli V. Cellular mechanisms of the slow (<1 Hz) oscillation in thalamocortical neurons in vitro. Neuron. 2002;33(6):947–958. - PubMed
    1. Isomura Y, et al. Integration and segregation of activity in entorhinal-hippocampal subregions by neocortical slow oscillations. Neuron. 2006;52(5):871–882. - PubMed
    1. Ji D, Wilson MA. Coordinated memory replay in the visual cortex and hippocampus during sleep. Nat Neurosci. 2007;10(1):100–107. - PubMed
    1. Steriade M, Timofeev I, Grenier F. Natural waking and sleep states: A view from inside neocortical neurons. J Neurophysiol. 2001;85(5):1969–1985. - PubMed

Publication types

LinkOut - more resources