. 2016 Jul 1;37(25):1944-58.
doi: 10.1093/eurheartj/ehw152. Epub 2016 Apr 26.

Fasting is not routinely required for determination of a lipid profile: clinical and laboratory implications including flagging at desirable concentration cut-points-a joint consensus statement from the European Atherosclerosis Society and European Federation of Clinical Chemistry and Laboratory Medicine

Affiliations

Fasting is not routinely required for determination of a lipid profile: clinical and laboratory implications including flagging at desirable concentration cut-points-a joint consensus statement from the European Atherosclerosis Society and European Federation of Clinical Chemistry and Laboratory Medicine

Børge G Nordestgaard et al. Eur Heart J. .

Abstract

Aims: To critically evaluate the clinical implications of the use of non-fasting rather than fasting lipid profiles and to provide guidance for the laboratory reporting of abnormal non-fasting or fasting lipid profiles.

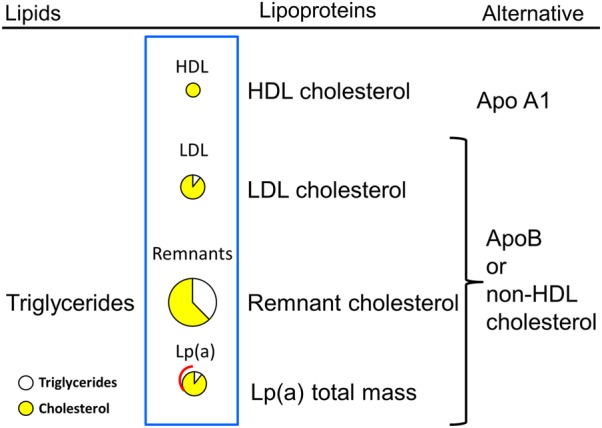
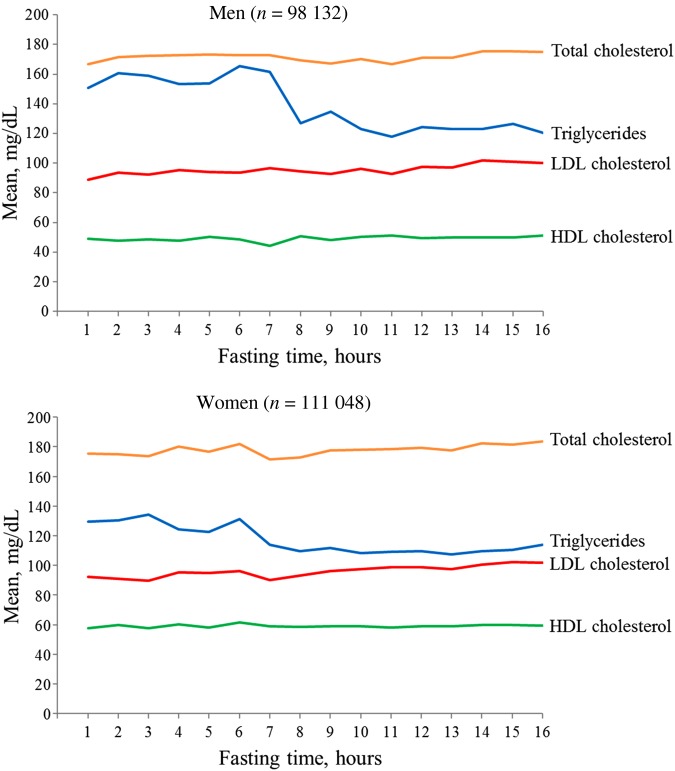
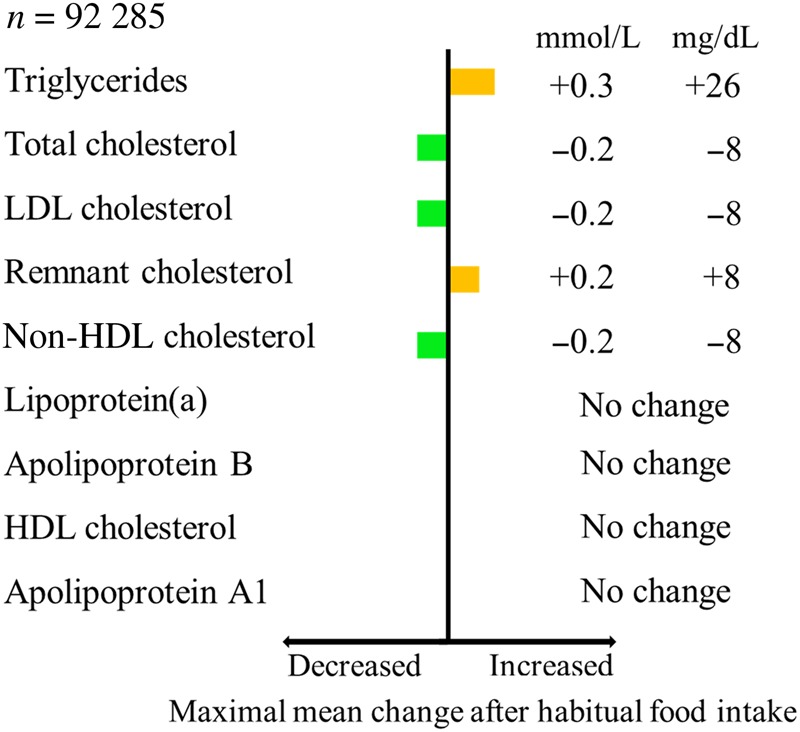
Methods and results: Extensive observational data, in which random non-fasting lipid profiles have been compared with those determined under fasting conditions, indicate that the maximal mean changes at 1-6 h after habitual meals are not clinically significant [+0.3 mmol/L (26 mg/dL) for triglycerides; -0.2 mmol/L (8 mg/dL) for total cholesterol; -0.2 mmol/L (8 mg/dL) for LDL cholesterol; +0.2 mmol/L (8 mg/dL) for calculated remnant cholesterol; -0.2 mmol/L (8 mg/dL) for calculated non-HDL cholesterol]; concentrations of HDL cholesterol, apolipoprotein A1, apolipoprotein B, and lipoprotein(a) are not affected by fasting/non-fasting status. In addition, non-fasting and fasting concentrations vary similarly over time and are comparable in the prediction of cardiovascular disease. To improve patient compliance with lipid testing, we therefore recommend the routine use of non-fasting lipid profiles, while fasting sampling may be considered when non-fasting triglycerides >5 mmol/L (440 mg/dL). For non-fasting samples, laboratory reports should flag abnormal concentrations as triglycerides ≥2 mmol/L (175 mg/dL), total cholesterol ≥5 mmol/L (190 mg/dL), LDL cholesterol ≥3 mmol/L (115 mg/dL), calculated remnant cholesterol ≥0.9 mmol/L (35 mg/dL), calculated non-HDL cholesterol ≥3.9 mmol/L (150 mg/dL), HDL cholesterol ≤1 mmol/L (40 mg/dL), apolipoprotein A1 ≤1.25 g/L (125 mg/dL), apolipoprotein B ≥1.0 g/L (100 mg/dL), and lipoprotein(a) ≥50 mg/dL (80th percentile); for fasting samples, abnormal concentrations correspond to triglycerides ≥1.7 mmol/L (150 mg/dL). Life-threatening concentrations require separate referral when triglycerides >10 mmol/L (880 mg/dL) for the risk of pancreatitis, LDL cholesterol >13 mmol/L (500 mg/dL) for homozygous familial hypercholesterolaemia, LDL cholesterol >5 mmol/L (190 mg/dL) for heterozygous familial hypercholesterolaemia, and lipoprotein(a) >150 mg/dL (99th percentile) for very high cardiovascular risk.

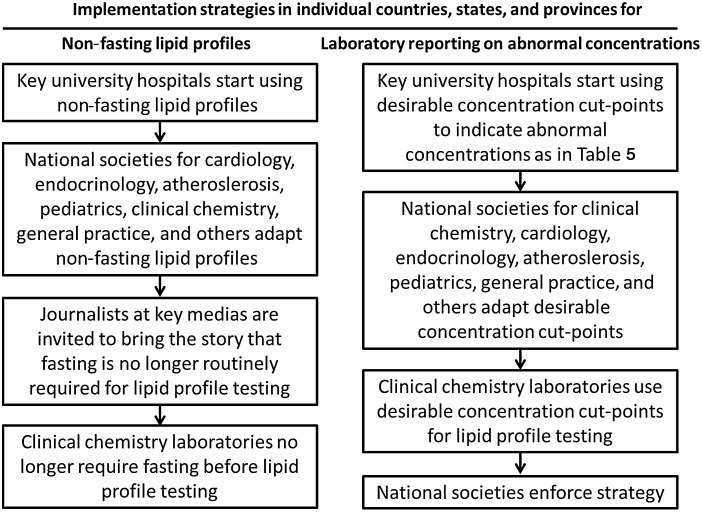
Conclusion: We recommend that non-fasting blood samples be routinely used for the assessment of plasma lipid profiles. Laboratory reports should flag abnormal values on the basis of desirable concentration cut-points. Non-fasting and fasting measurements should be complementary but not mutually exclusive.

Keywords: Cardiovascular disease; Lipids; Lipoproteins; Normal values; Reference values; Stroke.


Figures

Figure 1
Figure 1
Lipids, lipoproteins, and apolipoproteins as part of standard and expanded lipid profiles. Standard lipid profiles consist of triglycerides and total, low-density lipoprotein, and high-density lipoprotein cholesterol; however, a standard lipid profile could also report calculated remnant cholesterol and calculated non-high-density lipoprotein cholesterol as these come at no additional cost. Calculated remnant cholesterol is non-fasting total cholesterol minus low-density lipoprotein cholesterol minus high-density lipoprotein cholesterol. Calculated non-high-density lipoprotein cholesterol is total cholesterol minus high-density lipoprotein cholesterol. Lipoprotein(a) should be measured at least once in every individual screened for cardiovascular risk in order to detect potentially high concentrations of this genetic risk factor. Finally, apolipoprotein B and apolipoprotein A1 can be used as alternatives to non-high-density lipoprotein and high-density lipoprotein cholesterol, but these measurements come at an extra cost. Figure designed by Prof. B.G. Nordestgaard.
Figure 2
Figure 2
Comparison of calculated low-density lipoprotein cholesterol using the Friedewald equation with low-density lipoprotein cholesterol measured directly using random non-fasting and fasting lipid profiles. Only lipid profiles with triglycerides <4.5 mmol/L (400 mg/dL) were included, as low-density lipoprotein is typically measured using a direct low-density lipoprotein cholesterol assay when triglycerides are ≥4.5 mmol/L. Mes, measured; Cal, calculated using the Friedewald equation (low-density lipoprotein cholesterol = total cholesterol − high-density lipoprotein cholesterol − triglycerides/2.2; all values in mmol/L; if values are in mg/dL then use triglycerides/5). Figure designed by Prof. B.G. Nordestgaard and Dr A. Langsted based on unpublished data from individuals participating in the Copenhagen City Heat Study 2001–2003 examination.
Figure 3
Figure 3
Mean concentrations of lipids and lipoproteins as a function of the fasting period following the last meal in children from the US general population. The last meal simply represents what the particular child chose to eat at that particular day before blood sampling, with no information or requirement on amount or type of food eaten. Based on 12 744 children from the National Health and Nutrition Examination Survey.
Figure 4
Figure 4
Mean concentrations of lipids and lipoproteins as a function of the period of fasting following the last meal in men and women from the Canadian general population. The last meal simply represents what the particular individual chose to eat at that particular day before blood sampling, with no information or requirement on amount or type of food eaten. Based on 209 180 men and women from Calgary Laboratory Services.
Figure 5
Figure 5
Maximal mean changes at 1–6 h after habitual food intake of lipids, lipoproteins, and apolipoproteins as part of standard and expanded lipid profiles in individuals in the Danish general population. Calculated remnant cholesterol is non-fasting total cholesterol minus low-density lipoprotein cholesterol minus high-density lipoprotein cholesterol. Calculated non-high-density lipoprotein cholesterol is total cholesterol minus high-density lipoprotein cholesterol. Adapted and updated from Langsted et al.,, based on 92 285 individuals from the Copenhagen General Population Study recruited in 2003 through 2014. Of all participants, 12% were receiving statins. Values in mmol/L were converted to mg/dL by multiplication with 38.6 for cholesterol and by 88 for triglycerides.
Figure 6
Figure 6
Risk of ischaemic heart disease and myocardial infarction for highest vs. lowest quintile of random non-fasting lipids, lipoproteins, and apolipoproteins as part of standard and expanded lipid profiles in individuals in the general population. Hazard ratios were adjusted for age, sex, smoking, hypertension, diabetes, and use of statins. Figure designed by Prof. B.G. Nordestgaard and Dr A. Langsted based on unpublished data on 92 285 individuals from the Copenhagen General Population Study recruited in 2003 through 2014. Of all participants, 12% were receiving statins. Maximal and median follow-up were 11 and 6 years, respectively.
Figure 7
Figure 7
Comparison of concentrations of plasma triglycerides and low-density lipoprotein cholesterol measured in the non-fasting and fasting states in the same patients. Diabetes was determined as a haemoglobin A1c >7.1% (of all 5538 patients with both fasting and non-fasting triglyceride measurements, 371 did not have a haemoglobin A1c measurement). Values are medians and interquartile ranges; in strata of plasma triglycerides, the interquartile ranges are larger for fasting than for non-fasting values, which is explained by regression dilution bias as the groups were defined initially based on the non-fasting measurements. Figure designed by Prof. B.G. Nordestgaard and Dr A. Langsted based on unpublished data on patients from Herlev and Gentofte Hospital, Copenhagen University Hospital in the period 2011 through 2015.
Figure 8
Figure 8
Proportion of non-fasting individuals in the general population with flagged abnormal concentrations in laboratory reports using desirable concentration cut-points as shown in Table 5. Of all participants, 12% were receiving statins. Figure designed by Prof. B.G. Nordestgaard and Dr A. Langsted based on unpublished data on 92 285 non-fasting individuals from the Copenhagen General Population Study recruited in 2003 through 2014.
Figure 9
Figure 9
Suggested implementation strategies in individual countries, states, and/or provinces for use of non-fasting lipid profiles and for flagging in laboratory reports of abnormal values based on desirable concentration cut-points.

References

    1. Rifai N, Warnick GR. Lipids, lipoproteins, apolipoproteins, and other cardiovascular risk factors. In: Burtis CA, Ashwood ER, Bruns DE, (eds), Tietz Textbook of Clinical Chemistry and Molecular Diagnostics, 4th ed Philadelphia: Elsevier Saunders; 2006, p903–982.
    1. Simundic AM, Cornes M, Grankvist K, Lippi G, Nybo M. Standardization of collection requirements for fasting samples: for the Working Group on Preanalytical Phase (WG-PA) of the European Federation of Clinical Chemistry and Laboratory Medicine (EFLM). Clin Chim Acta 2014;432:33–37. - PubMed
    1. Langsted A, Freiberg JJ, Nordestgaard BG. Fasting and nonfasting lipid levels: influence of normal food intake on lipids, lipoproteins, apolipoproteins, and cardiovascular risk prediction. Circulation 2008;118:2047–2056. - PubMed
    1. Mora S, Rifai N, Buring JE, Ridker PM. Fasting compared with nonfasting lipids and apolipoproteins for predicting incident cardiovascular events. Circulation 2008;118:993–1001. - PMC - PubMed
    1. Watts GF, Cohn JS. Whither the lipid profile: feast, famine, or no free lunch? Clin Chem 2011;57:363–365. - PubMed