. 2016 Jun 15;27(12):1898-910.
doi: 10.1091/mbc.E15-10-0744. Epub 2016 Apr 27.

Dynamic myosin activation promotes collective morphology and migration by locally balancing oppositional forces from surrounding tissue

Affiliations

Dynamic myosin activation promotes collective morphology and migration by locally balancing oppositional forces from surrounding tissue

George Aranjuez et al. Mol Biol Cell. .

Abstract

Migrating cells need to overcome physical constraints from the local microenvironment to navigate their way through tissues. Cells that move collectively have the additional challenge of negotiating complex environments in vivo while maintaining cohesion of the group as a whole. The mechanisms by which collectives maintain a migratory morphology while resisting physical constraints from the surrounding tissue are poorly understood. Drosophila border cells represent a genetic model of collective migration within a cell-dense tissue. Border cells move as a cohesive group of 6-10 cells, traversing a network of large germ line-derived nurse cells within the ovary. Here we show that the border cell cluster is compact and round throughout their entire migration, a shape that is maintained despite the mechanical pressure imposed by the surrounding nurse cells. Nonmuscle myosin II (Myo-II) activity at the cluster periphery becomes elevated in response to increased constriction by nurse cells. Furthermore, the distinctive border cell collective morphology requires highly dynamic and localized enrichment of Myo-II. Thus, activated Myo-II promotes cortical tension at the outer edge of the migrating border cell cluster to resist compressive forces from nurse cells. We propose that dynamic actomyosin tension at the periphery of collectives facilitates their movement through restrictive tissues.


Figures

FIGURE 1:
FIGURE 1:
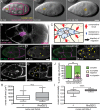
Nurse cells influence border cell cluster migration. (A) Frames from a DIC movie (Supplemental Movie S2) showing border cells (false-colored yellow) migrating between the nurse cells (nc; pink outlines) to reach the oocyte (n = 5 movies). The follicle cell epithelium surrounds the germ line. Scale bar: 40 μm. (B) Merged three-dimensional z-stack image of a live stage 9 egg chamber stained with the lipophilic FM 4-64 dye; the dye labels many, though not all, cell membranes. This image is taken from Supplemental Movie S1. Border cells, distinguished by enriched FM 4-64 staining (false-colored magenta), are closely surrounded by neighboring nurse cell membranes. The oocyte is to the far right. Scale bar: 20 μm. (C) Model of tissue-level forces between the border cell cluster (blue arrows) and the nurse cells (red arrows). Border cells are proposed to resist compression from nurse cells. Border cells are blue; central polar cells are pink; nurse cells are yellow; dashed lines indicate nurse cell nuclei. The direction of migration is to the right (black arrow). (D–E′) 2P-Sqh expression in nurse cells. Stage 9 egg chambers stained for 2P-Sqh (green in D and E) and phalloidin to label F-actin (magenta in D and E). (D and D′) Control egg chambers have low levels of 2P-Sqh at nurse cell membranes. (E and E′) Elevated 2P-Sqh staining (arrowheads) at cortical nurse cell membranes in a nurse cell (n.c.) > RhoGEF2 egg chamber (n = 24). Filamentous 2P-Sqh within nurse cell cytoplasm (asterisks in D′ and E′) is likely nonspecific staining. Scale bars: 20 μm. (F and G) RhoGEF2 expression in nurse cells causes the cells to become rounder than normal (asterisks). Late stage 9 control (F; nurse cell GAL4/+) and stage 10 RhoGEF2 (G; nurse cell GAL4/UASp-RhoGEF2) egg chambers stained with phalloidin to label F-actin. Scale bar: 20 μm. (H and I) Measurements of nurse cells, represented as box-and-whisker plots. The whiskers represent the minimum and maximum, the box extends from the 25th to the 75th percentiles, and the line indicates the median measurement. Nurse cells from control egg chambers (n = 29) and nurse cells from nurse cell > RhoGEF2 egg chambers (n = 26) were analyzed; not significant (n.s.), p ≥ 0.05; ****, p < 0.0001; unpaired t test. (H) Quantification of the area of nurse cells in control and nurse cell > RhoGEF2 egg chambers. (I) Quantification of the circularity of nurse cells from control and nurse cell > RhoGEF2 egg chambers. A value of 1.0 is a perfect circle, whereas a number close to 0.0 is an extremely elongated shape. (J) Quantification of border cell migration in egg chambers expressing RhoGEF2 in nurse cells (nurse cell GAL4/UASp-RhoGEF2; n = 162 egg chambers) compared with control (nurse cell GAL4/+; n = 217), shown as the percentage of stage 10 egg chambers with complete, incomplete, or no migration to the oocyte. A diagram illustrating the migration distance is shown in Supplemental Figure S1C. At least three trials were performed per genotype; n ≥ 50 egg chambers per trial. **, p < 0.01; unpaired t test. Error bars: SEM. In this and all subsequent figures, anterior is to the left and the direction of migration is to the right.
FIGURE 2:
FIGURE 2:
Border cells change shape and increase levels of activated Myo-II in response to nurse cells. (A–C) Elongation of wild-type border cell clusters upon increased contraction of nurse cells. Stage 9 control (nurse cell GAL4/+) and RhoGEF2 (nurse cell GAL4/UASp-RhoGEF2) egg chambers stained with phalloidin to label F-actin (green in A and B) and Fascin to mark border cells (magenta in A and B; white in A′ and B′). Scale bars: 20 μm. (A and A′) Control border cell cluster shape is normal. (B and B′) Example of a border cell cluster that is elongated in a nurse cell > RhoGEF2 egg chamber. (C) Quantification of individual border cell cluster lengths from control (n = 20) and nurse cell > RhoGEF2 (n = 55) egg chambers. The line indicates the mean. *, p < 0.05; unpaired t test. (D–F) Elevated 2P-Sqh levels in border cells when the surrounding nurse cells express RhoGEF2. (D and E) The heat map shows the levels of low to high signal intensity of 2P-Sqh. (D′ and E′) The border cell cluster is defined by Fascin signal, which is expressed at low levels in nurse cells at this stage of egg chamber development (Cant et al., 1994). Scale bars: 5 μm. (F) Quantification of the mean 2P-Sqh pixel intensity within the border cell cluster (defined by Fascin staining) from control (n = 8) and nurse cell > RhoGEF2 (n = 11) egg chambers, represented as a box-and-whisker plot. The whiskers represent the minimum and maximum pixel intensity; the box extends from the 25th to the 75th percentiles; the line indicates the median measurement. ***, p < 0.001; unpaired t test.
FIGURE 3:
FIGURE 3:
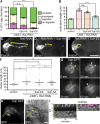
Myo-II maintains the migratory morphology of the border cell cluster. (A) Illustration of proposed mechanism by which Myo-II (red) and F-actin (blue) generate cortical tension to contract border cell cluster membranes (arrows). (B) Localization of Sqh:GFP in border cells during migration. Sqh:GFP is enriched in foci at the cluster periphery (arrowheads) and in polar cells (asterisk). Scale bar: 5 μm. (C–G) Knockdown or loss of sqh disrupts cluster shape. (C and D) Fascin labels border cells of stage 9 control (c306-GAL4, tsGAL80/+) and stage 10 sqh RNAi egg chambers (c306-GAL4, tsGAL80/+; UAS-sqh RNAi/+). (D and G) Dashed line indicates the anterior oocyte border. (E) Quantification of cluster length (l) along the axis of migration (schematic), shown as the percentage of control (n = 30) and sqh RNAi (n = 75) midmigration border cells in stage 9 egg chambers. (F and G) Examples of stage 9 FRT 19A control (F) and stage 10 sqhAX3 (G) mosaic mutant clusters (n = 38), costained for E-cadherin (E-cad; green) to label cell membranes and DAPI (blue) to show nuclei. Loss of nuclear RFP (red fluorescent protein; red) marks cell clones (arrowheads). Scale bars (C, D, F, and G): 20 μm. (H and I) Frames from control (H) and sqh RNAi (I) live movies (Supplemental Movies S4 and S5) showing migrating border cells (mCD8:GFP). (J) Quantification of the variability in cluster length from individual movies over time (∼1 h duration), shown as box-and-whisker plots. The whiskers represent the minimum and maximum length within one movie; the box extends from the 25th to the 75th percentiles; the line indicates the median length measurement within that movie.
FIGURE 4:
FIGURE 4:
Cell and cluster morphology of border cells requires activated Myo-II. (A–A″) Representative example of a stage 9 wild-type border cell cluster stained for 1P-Sqh (green) and 2P-Sqh (red). The 1P-Sqh and 2P-Sqh colocalize (yellow in A″) and are enriched in discrete foci (arrowheads, dashed line) at the cluster periphery (n = 17). Armadillo (Arm; white in A″) labels all cell membranes, including the central polar cells (asterisk). Scale bar: 5 μm. (B) Example of an elongated Rok KD cluster (bracket) in a slbo-GAL4/UAS-Venus:Rok KD stage 10 egg chamber. The border cells are stained for Fascin (red), Venus:Rok KD (green), and DAPI (blue nuclei). (C) Example of a cluster with stretched-out, trailing Rok2 mutant border cells (loss of nuclear RFP; arrowheads) in a stage 9 egg chamber stained for Fascin (green) and DAPI (blue nuclei). Scale bars (B and C): 50 μm. (D–G) Activated RhoA causes rounded border cells and disrupts cluster shape. Stage 9 control (slbo-GAL4, UAS-mCD8:GFP/+) and active RhoA (slbo-GAL4, UAS-mCD8:GFP/UAS-Rho1V14) border cells labeled by GFP (D and F) and F-actin (D′ and F′). (E and G) The 1P- and 2P-Sqh localize to the periphery of control (E) but are mislocalized in constitutively active RhoA (G; n = 19) border cell clusters. Dashed lines indicate the cluster boundary. (H–H′′) Altered shape of Mbs RNAi (c306-GAL4/+; UAS-Mbs RNAi/UAS-mCD8:GFP) border cells (n > 7), marked by GFP (H; green in H″) and F-actin (H′; magenta in H″). Scale bar (D–H″): 5 μm. (I) Mean pixel intensity of 1P- and 2P-Sqh measured in control (n = 10) and active RhoA (n = 6) border cell clusters. Error bars: SEM. **, p < 0.01; unpaired t test.
FIGURE 5:
FIGURE 5:
Requirement for dynamic cycles of activated Myo-II in cluster shape and membrane deflection. (A) Sqh-EE strongly suppresses the Rok RNAi migration defects. Quantification of complete, incomplete, and no migration in stage 10 Rok RNAi (c306-Gal4/+; UAS-Rok RNAi/+) egg chambers, with or without the indicated Sqh mutant transgenes. n ≥ 50 egg chambers in each of three trials; not significant (n.s.), p ≥ 0.05; ***, p < 0.001; one-way ANOVA with Dunnett test compared with “complete migration.” (B–E) Sqh-EE rescues the Rok RNAi border cell protrusion-length defects. (B) Quantification of mean protrusion length in the indicated genotypes. Dashed line shows the mean protrusion length of control (c306-GAL4/+). n ≥ 86 protrusions per genotype; n.s., p ≥ 0.05; ***, p < 0.001; one-way ANOVA with Dunnett test. Error bars in A and B: SEM. (C–E) Stage 9 Rok RNAi egg chambers, with or without the indicated Sqh mutant transgenes, stained for Fascin to label border cells and protrusions (brackets). Scale bar: 20 μm. (F) Sqh-EE and Sqh-AA did not alter the Rok RNAi cluster elongation defect. Quantification of individual border cell cluster length measurements in the indicated genotypes. The line indicates the mean. n ≥ 46 clusters per genotype; n.s., p ≥ 0.05; **, p < 0.01; one-way ANOVA with Dunnett test. (G) Consecutive frames from a Sqh:GFP movie at the indicated times. Two foci of Sqh:GFP (arrowheads) were tracked at the cluster periphery until they disappeared (arrowhead outlines). A new foci appears in the last frame. (H and H′) Frame from a time-lapse Sqh:GFP movie (Supplemental Movie S6) simultaneously imaged by fluorescence microscopy (H) and DIC (H′) optics to visualize cell membranes (n = 6). Scale bars (G and H): 5 μm. The boxed region corresponds to the kymograph shown in I, with the outside (“o”) and inside (“i”) labeled to provide orientation. (I) Kymograph of the GFP (top) and DIC (bottom) channels from the boxed region in H and H′ over time (minutes). Sqh:GFP (magenta, overlay) correlates with deflection of the cluster membrane (n = 9 egg chambers). Orientation as in H and H′.
FIGURE 6:
FIGURE 6:
Proposed model for maintaining the collective morphology of border cells migrating within the egg chamber. (A) The border cell cluster maintains a collective morphology while migrating between the large nurse cells. (B) A balance of forces (arrows), through actomyosin activity and cortical tension, between nurse cells (yellow) and border cells (blue) produces a compact cluster shape. (A and B) Right, when forces become unbalanced, for example by altered myosin activity, the collective migratory morphology is disrupted. Either knocking down Sqh in border cells or expressing ectopic RhoGEF2 in nurse cells causes the border cell cluster to elongate and stop migrating. Border cells respond to increased levels of compressive forces from the surrounding nurse cells by elevating the levels of activated Myo-II.

References

    1. Alexander S, Weigelin B, Winkler F, Friedl P. Preclinical intravital microscopy of the tumour-stroma interface: invasion, metastasis, and therapy response. Curr Opin Cell Biol. 2013;25:659–671. - PubMed
    1. Amano M, Ito M, Kimura K, Fukata Y, Chihara K, Nakano T, Matsuura Y, Kaibuchi K. Phosphorylation and activation of myosin by Rho-associated kinase (Rho-kinase) J Biol Chem. 1996;271:20246–20249. - PubMed
    1. Amano M, Nakayama M, Kaibuchi K. Rho-kinase/ROCK: A key regulator of the cytoskeleton and cell polarity. Cytoskeleton. 2010;67:545–554. - PMC - PubMed
    1. Andersen D, Horne-Badovinac S. Influence of ovarian muscle contraction and oocyte growth on egg chamber elongation in Drosophila. Development. 2016;143:1375–1387. - PMC - PubMed
    1. Aranjuez G, Kudlaty E, Longworth MS, McDonald JA. On the role of PDZ domain-encoding genes in Drosophila border cell migration. G3 (Bethesda) 2012;2:1379–1391. - PMC - PubMed

Publication types