Review
. 2016 Mar;32(2):129-44.
doi: 10.6515/acs20150616a.

Introduction to Cardiovascular Magnetic Resonance: Technical Principles and Clinical Applications

Affiliations
Review

Introduction to Cardiovascular Magnetic Resonance: Technical Principles and Clinical Applications

Wen-Yih Isaac Tseng et al. Acta Cardiol Sin. 2016 Mar.

Abstract

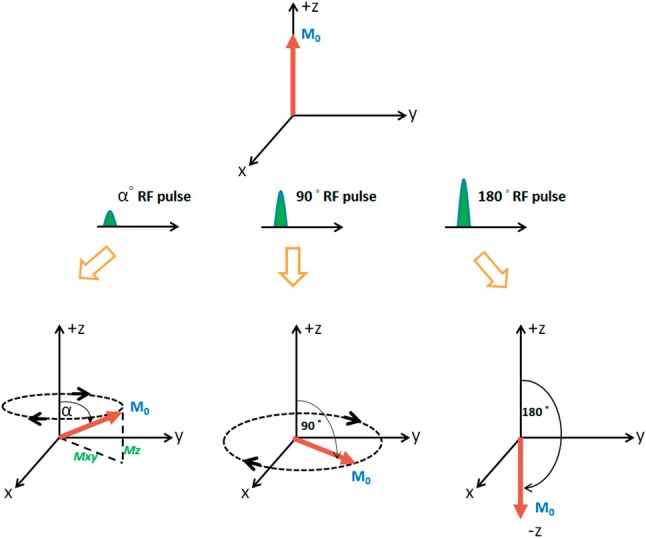
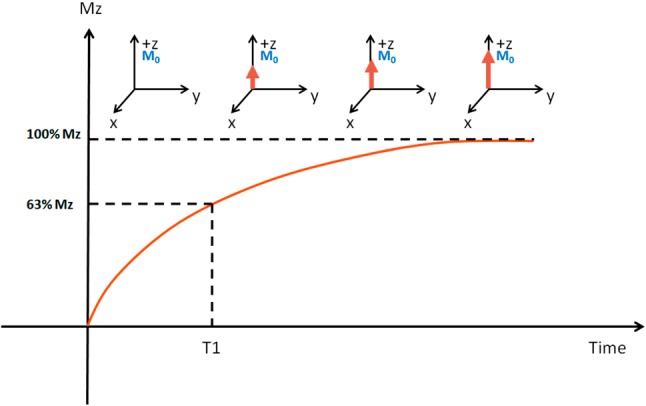
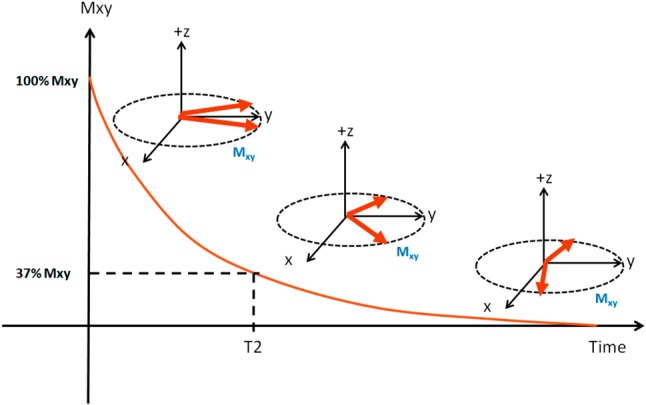
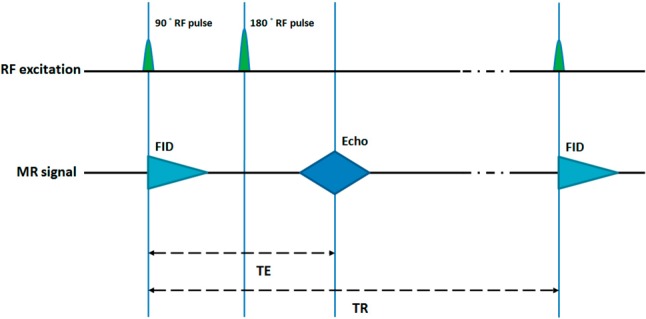
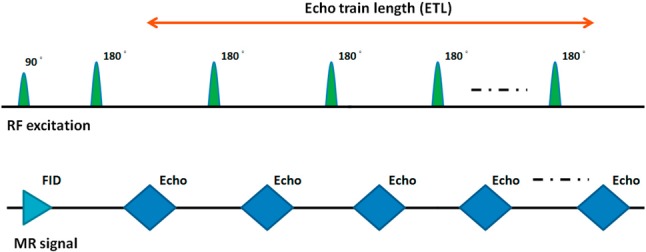
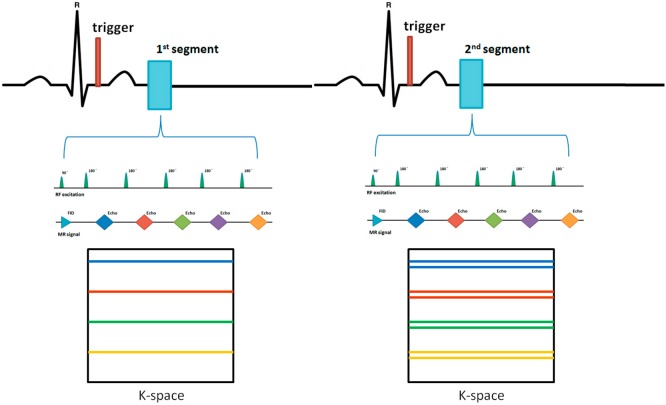
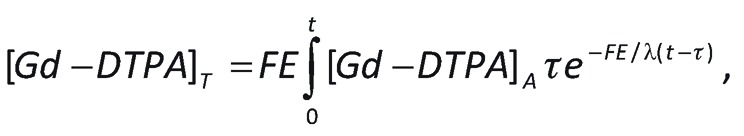
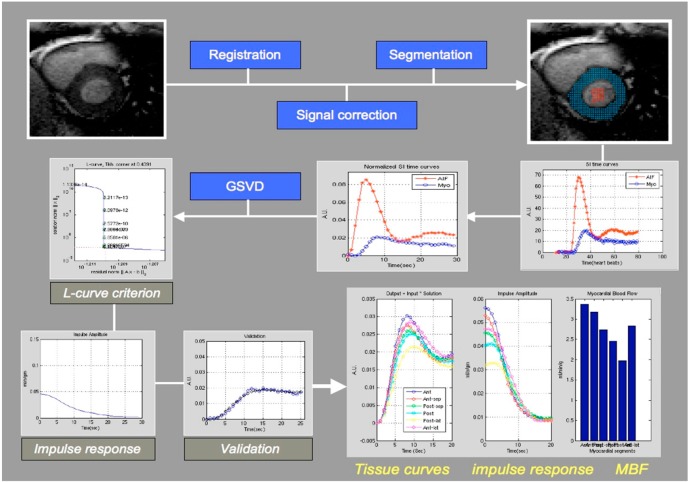
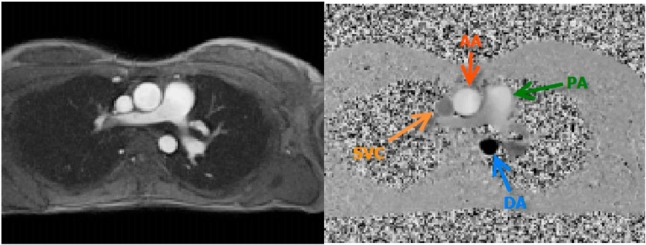
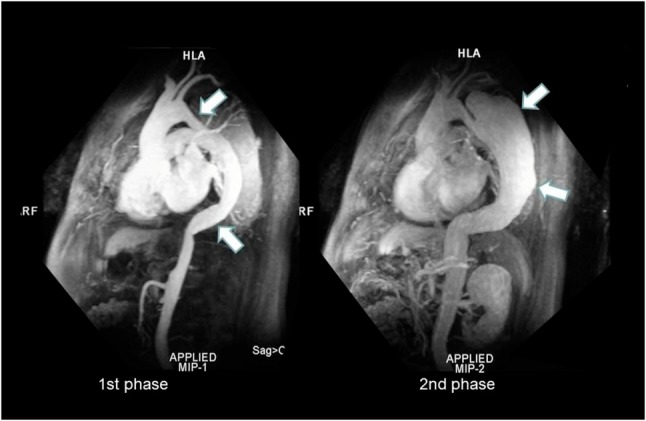
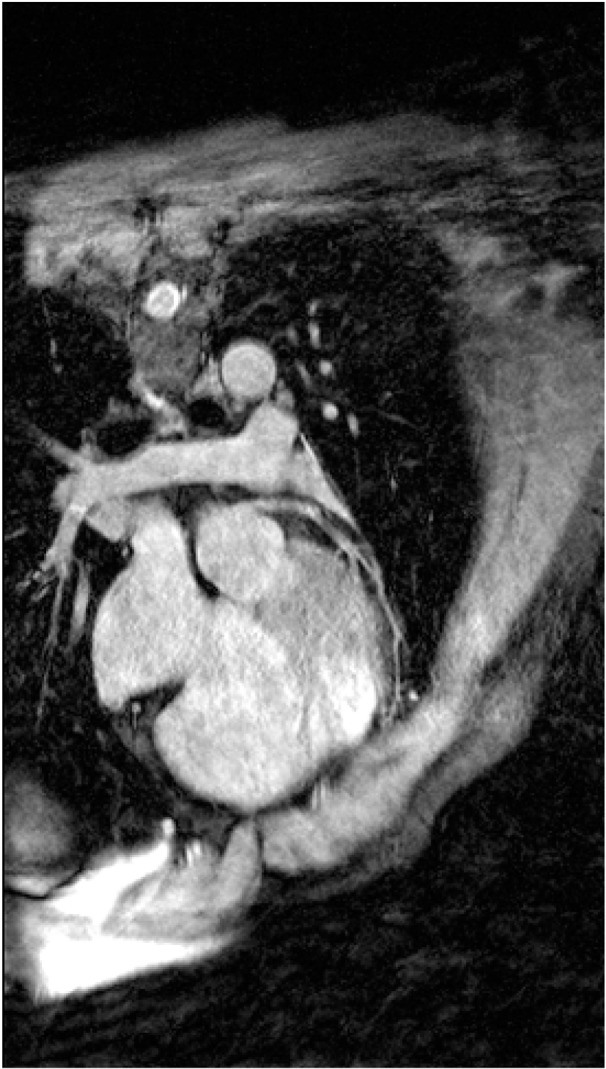
Cardiovascular magnetic resonance (CMR) is a set of magnetic resonance imaging (MRI) techniques designed to assess cardiovascular morphology, ventricular function, myocardial perfusion, tissue characterization, flow quantification and coronary artery disease. Since MRI is a non-invasive tool and free of radiation, it is suitable for longitudinal monitoring of treatment effect and follow-up of disease progress. Compared to MRI of other body parts, CMR faces specific challenges from cardiac and respiratory motion. Therefore, CMR requires synchronous cardiac and respiratory gating or breath-holding techniques to overcome motion artifacts. This article will review the basic principles of MRI and introduce the CMR techniques that can be optimized for enhanced clinical assessment.

Key words: Cardiovascular MR • Coronary arteries • Flow quantification • Myocardial fibrosis • Myocardial perfusion • Myocardial scarring • Regional wall motion • Ventricular function.


Figures

Figure 1
Figure 1
At equilibrium state, the net magnetization (M0) is pointing in the +z direction. When a radiofrequency (RF) pulse is applied, the M0 absorbs the energy from the RF pulse and rotates away from the +z direction and makes an angle with respect to +z direction, known as the flip angle. The degree of the flip angle depends on the magnitude and duration of the RF pulse.
Figure 2
Figure 2
The time it takes for Mz to increase from zero to 63% of the M0 is known as T1.
Figure 3
Figure 3
The time for Mxy to decrease to 37% of Mxy at the beginning is known as T2.
Figure 4
Figure 4
In the spin echo (SE) sequence, a 90° RF pulse is first applied to rotate the magnetization M0 from the +z direction to the xy plane. The transverse magnetization in the xy plane induced MR signal, called free induction decay or FID, which begins to decay due to the transverse relaxation. After a period of time, a 180° RF pulse is applied to refocus the decaying transverse magnetization and produce an echo, called ‘spin echo’. The time between the start of the 90° RF pulse and the echo is the echo time (TE). The cycle of 90°-180° -echo is repeated many times to collect signals, and the interval between successive 90° RF pulse is defined as the repetition time (TR).
Figure 5
Figure 5
The fast spin echo (FSE) sequence uses a 90° RF pulse followed by a rapid train of 180° RF pulses to produce a rapid train of spin echo signals. The echo train length (ETL) is the number of 180° refocusing pulses within each repetition time. The number of refocusing pulses corresponds to the number of echoes produced and the number of k-lines filled. In the single-shot FSE, the number of k-lines acquired after the 90° RF pulse is sufficient to reconstruct an image.
Figure 6
Figure 6
The fast spin echo pulse sequence applies multiple 180° pulses following the 90° pulse to generate multiple spin echoes. Multiple lines of k space are filled within each heartbeat.
Figure 7
Figure 7
The graident-echo (GRE) sequence uses a ‘weak’ RF pulse (α) to initiate a transverse magnetization and refocus it by a bioploar magentic gradient (blue) to produce MR signal (yellow).
Figure 8
Figure 8
The diagram of a MRI imaging sequence is composed of a series of RF pulses and spatial gradients (Gss, Gpe, Gfe) which are played out at appropriate timing in order to produce MR signal that is encoded with spatial information.
Figure 9
Figure 9
A double inversion-recovery (IR) dark-blood image in the short-axis view shows a bright intramural tumor (red arrow) protruding into the right ventricular cavity (A). The signal of the tumor becomes dark in the tripple IR dark-blood dark-fat image (B), indicating that this tumor is right ventricular lipomma.
Figure 10
Figure 10
Cardiac cine MRI is achieved by acquiring multiple images at different cardiac phases throughout the cardiac cycle. The image at each cardiac phase is reconstructed from segments of data acquired at different heartbeats. The number of segments is the number of cardiac phases. By acquiring multiple images at multiple cardiac phases, a series of images can be displayed as a movie (cine).
Figure 11
Figure 11
The volume-time curve of the left ventricle. The end-systolic volume (ESV) and end-diastolic volume (EDV) are determined by the minimal and maximal values from the volume-time curve. (BSA, body surface area)
Figure 12
Figure 12
The rate-of-volume-change curve of the left ventricle. From this curve, the minimum and maximum values are identified as the peak ejection rate (PER) and peak filling rate (PFR). The time for deceleration (Tdec) is the time interval between PFR and the zero intercept of the deceleration slope.
Figure 13
Figure 13
The change in the longitudinal magnetization (Mz) in the infarcted and normal myocardium after an unselective RF pre-pulse. The time of inversion (TI) is defined as the time between the RF pulse to the time when the Mz of the normal myocardium is zero (null point). The data acquisition starts at this null point so that the signal of the normal myocardium appears dark, whereas the signal of the infarcted myocardium appears bright.
Figure 14
Figure 14
Different hyperenhancement patterns in different types of cardiomyopathy in late gadolinium enhancement (LGE) MR images. Ischemic cardiomyopathy typically shows the subendocardial hyperenhancement (first column). For non-ischemic cardiomyopathy, different disease entities show unique patterns of hyperenhancement in the myocardium.
Figure 15
Figure 15
The flowchart of quantifying the extracellular volume fraction (ECV). For T1 maps, the regions of interest (ROI) in the blood and the myocardium of the LV are segmented manually in the central area of the LV cavity and the septal myocardium, respectively. If the septal myocardium shows regional hyperenhancement on the late gadolinum enhancement (LGE) images, the region of interest of the myocardium is redrawn in other unenhanced myocardial region. The ECV is calculated using the ratio of the change in relaxation rate (R1 = 1/T1) in the myocardium to that in the blood and multipled by (1-hematocrit).
Figure 16
Figure 16
Semi-quantitative perfusion parameters derived from the signal-intensity-time curve (SI curve). The SI curve of the first pass in the myocardium is fitted smoothly by a gamma-variate function. The myocardial maximal upslope is measured from the peak value of the time derivatives of the myocardial signal intensity time (SI) curve (green). The peak value (red), time-to-peak (blue), and area under curve (purple) are directly assessed from the myocardial SI curve.
equation
equation
Figure 17
Figure 17
The flow chart of perfusion quantification analysis. The analysis starts with alignment of the perfusion images followed by surface coil signal correction. After segmentation of the left ventricle (LV), the time curves of mean signal intensity (SI; AU, arbitrary unit) in myocardium (Myo, myocardium) and in the LV cavity (AIF, arterial input function) are computed, and normalized by the area under the curve of the AIF. The residue impulse response (ml/sec/g) is calculated by the general singular value deconvolution (GSVD) of Myo and AIF, followed by Tikhonov regularization and determination from the L-curve criterion. For validation, the resulting impulse response is convolved with the AIF to compare with the time curve of the myocardium (Myo). After obtaining the impulse response, the myocardial perfusion (ml/min/g) is determined by the initial height of the impulse response.
Figure 18
Figure 18
Magnitude image in phase-contrast cine can be used to identify morphology of the vessels (Left). Phase image shows flows in different directions coded with continuous gray-scale levels (from black to white) (Right). Different flow velocity has different signal intensity in the image as well. (AA, ascending aorta; DA, descending aorta; PA, pulmonary artery; SVC, superior vena cava)
Figure 19
Figure 19
CE-MRA in a patient with aortic dissection. The early phase (left) shows early enhancement of the Gadolinium-chelate contrast agent in the true lumen of the ascending and descending aorta (white arrows). The false lumen is partially enhanced due to slow flow. The delayed phase (right) shows late enhancement of the false lumen (white arrows).
Figure 20
Figure 20
Coronary MR angiography of the left main and left anterior descending artery. The image is acquired by a 3D GRE sequence with fat-saturation and synchronous ECG- and respiratory-gating.

References

    1. Leong DP, De Pasquale CG, Selvanayagam JB. Heart failure with normal ejection fraction: the complementary roles of echocardiography and CMR imaging. JACC Cardiovasc Imaging. 2010; 3(4):409–420. - PubMed
    1. Brenner DE, Whitley NO, Houk TL, et al. Volume determinations in computed tomography. JAMA. 1982;247(9):1299–1302. - PubMed
    1. Tseng WY, Liao TY, Wang JL. Normal systolic and diastolic functions of the left ventricle and left atrium by cine magnetic resonance imaging. J Cardiovasc Magn Reson. 2002;4(4):443–457. - PubMed
    1. Ohno M, Cheng CP, Little WC. Mechanism of altered patterns of left ventricular filling during the development of congestive heart failure. Circulation. 1994;89(5):2241–2250. - PubMed
    1. Gaasch WH, Delorey DE, St John Sutton MG, et al. Patterns of structural and functional remodeling of the left ventricle in chronic heart failure. Am J Cardiol. 2008;102(4):459–462. - PubMed

LinkOut - more resources