. 2016 Jun 2;12(6):999-1014.
doi: 10.1080/15548627.2016.1166318. Epub 2016 Apr 28.

Increased mitochondrial fission promotes autophagy and hepatocellular carcinoma cell survival through the ROS-modulated coordinated regulation of the NFKB and TP53 pathways

Affiliations

Increased mitochondrial fission promotes autophagy and hepatocellular carcinoma cell survival through the ROS-modulated coordinated regulation of the NFKB and TP53 pathways

Qichao Huang et al. Autophagy. .

Abstract

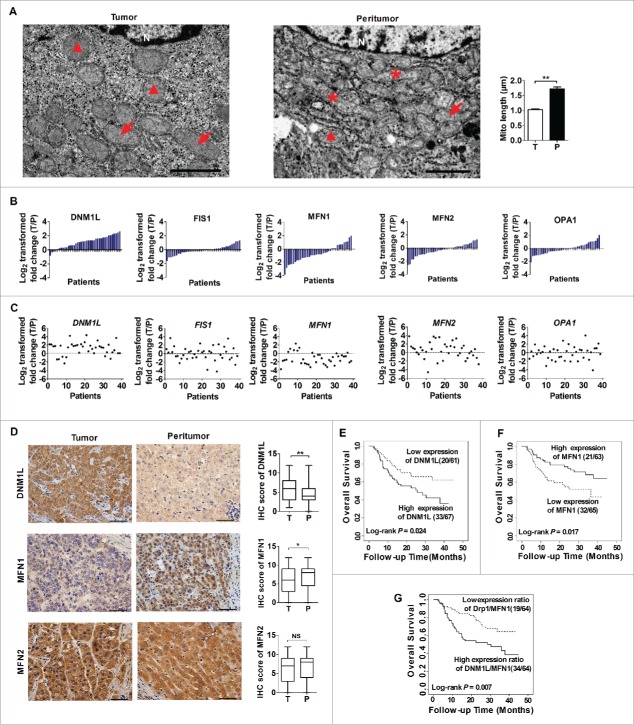
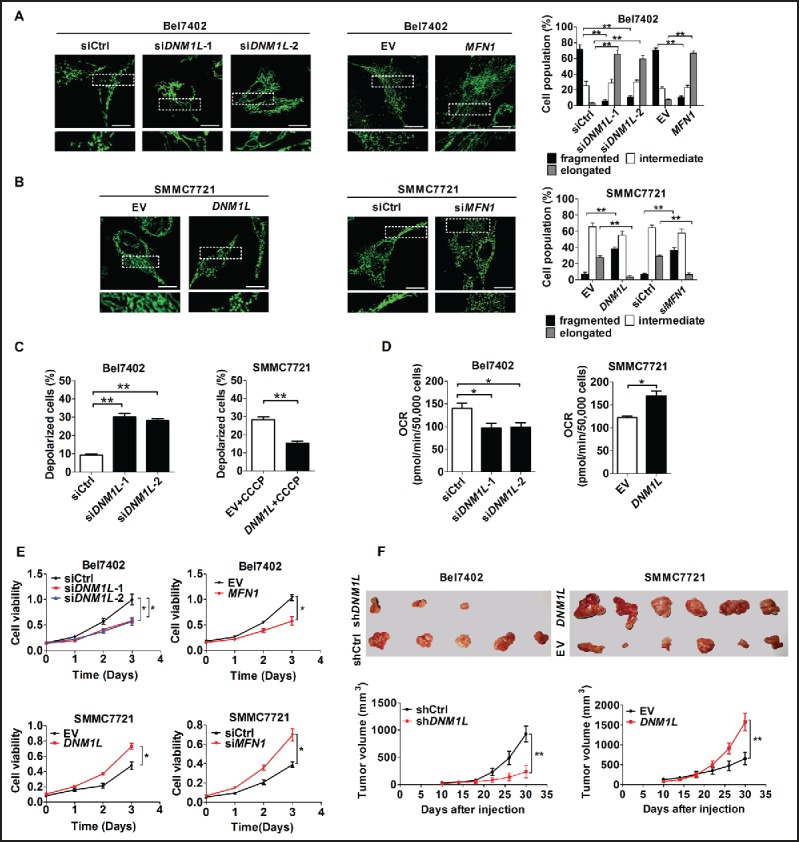
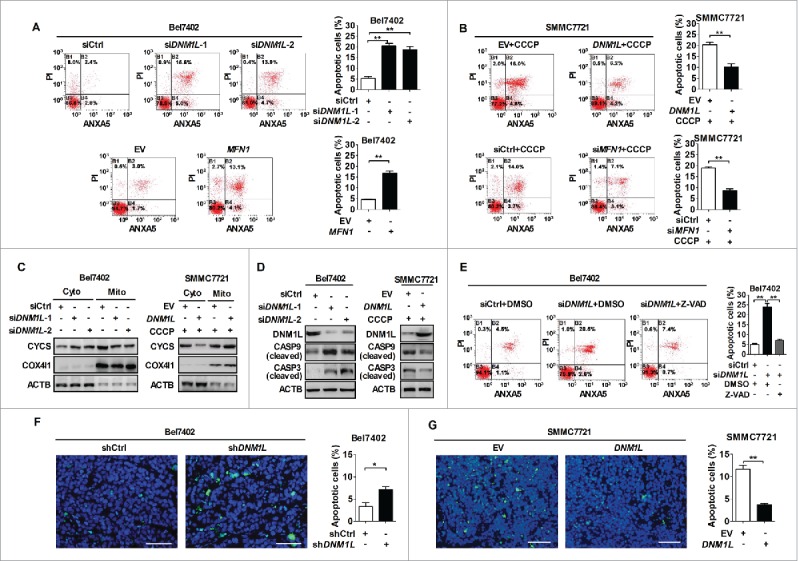
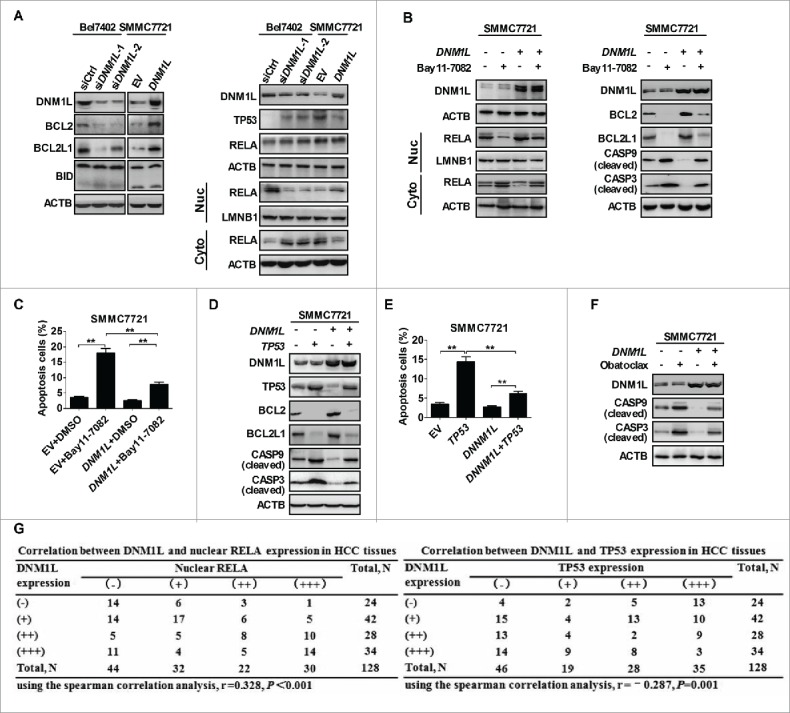
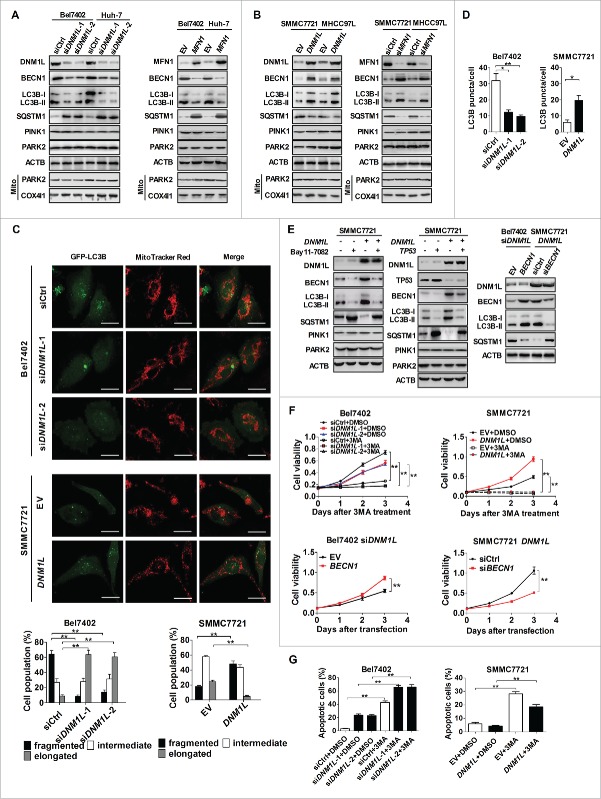
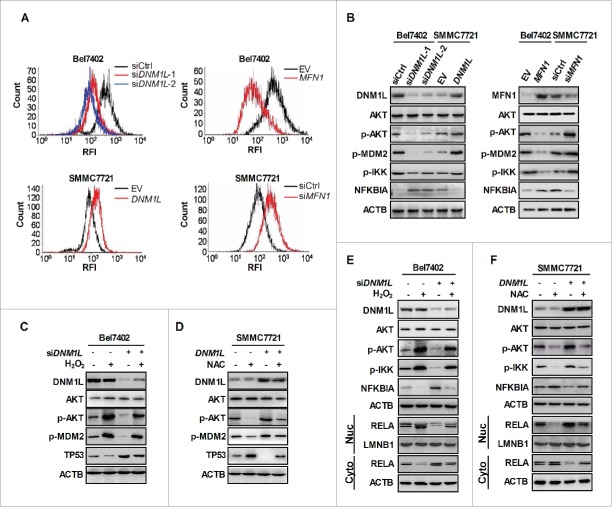
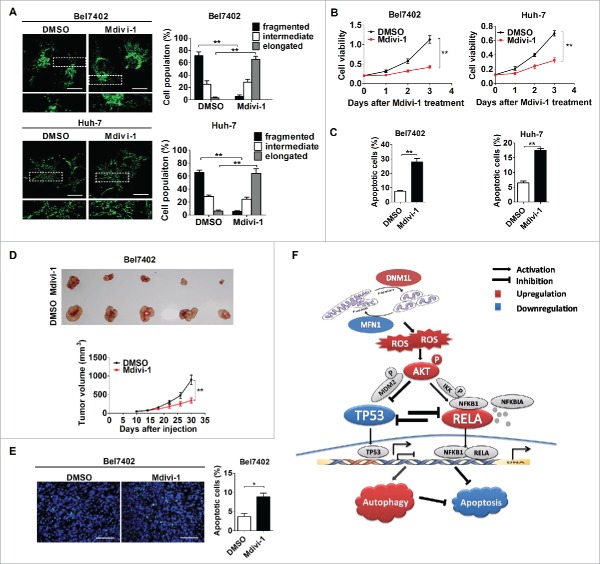
Mitochondrial morphology is dynamically remodeled by fusion and fission in cells, and dysregulation of this process is closely implicated in tumorigenesis. However, the mechanism by which mitochondrial dynamics influence cancer cell survival is considerably less clear, especially in hepatocellular carcinoma (HCC). In this study, we systematically investigated the alteration of mitochondrial dynamics and its functional role in the regulation of autophagy and HCC cell survival. Furthermore, the underlying molecular mechanisms and therapeutic application were explored in depth. Mitochondrial fission was frequently upregulated in HCC tissues mainly due to an elevated expression ratio of DNM1L to MFN1, which significantly contributed to poor prognosis of HCC patients. Increased mitochondrial fission by forced expression of DNM1L or knockdown of MFN1 promoted the survival of HCC cells both in vitro and in vivo mainly by facilitating autophagy and inhibiting mitochondria-dependent apoptosis. We further demonstrated that the survival-promoting role of increased mitochondrial fission was mediated via elevated ROS production and subsequent activation of AKT, which facilitated MDM2-mediated TP53 degradation, and NFKBIA- and IKK-mediated transcriptional activity of NFKB in HCC cells. Also, a crosstalk between TP53 and NFKB pathways was involved in the regulation of mitochondrial fission-mediated cell survival. Moreover, treatment with mitochondrial division inhibitor-1 significantly suppressed tumor growth in an in vivo xenograft nude mice model. Our findings demonstrate that increased mitochondrial fission plays a critical role in regulation of HCC cell survival, which provides a strong evidence for this process as drug target in HCC treatment.

Keywords: apoptosis; autophagy; cell survival; liver cancer; mitochondrial dynamics.


Figures

Figure 1.
Figure 1.
Mitochondrial dynamics in HCC tissues and their effects on prognosis of HCC patients. (A) Representative transmission electron microscopy images of mitochondrial network in paired tissues from HCC patients (n=15). Asterisks, arrows and triangles indicate elongated, intermediate (mid) and fragmented mitochondria, respectively. N, nucleus. Scale bar: 2 µm. (B and C) Western blot and qRT–PCR analyses for expression levels of DNM1L, FIS1, MFN1, MFN2 and OPA1 in 39 paired tissues from HCC patients. T, tumor; P, peritumor. The relative expression ratio of tumor to peritumor was log2-transformed. The serial number of patient was rearranged for western blot according to expression level, while qRT-PCR data were displayed according to serial patient ID number. (D) Representative immunohistochemical (IHC) staining images of DNM1L, MFN1 and MFN2 in paired HCC tissues (n = 128). *, P<0.05; **, P<0.01. Scale bar: 50μm. (E to G) Kaplan-Meier curve analysis of overall survival in HCC patients by the expression of DNM1L and MFN1. Death/total and recurrence/total number of patients in each subgroup were presented.
Figure 2.
Figure 2.
The effects of mitochondrial fission on mitochondrial function and survival of HCC cells in vitro and in vivo. (A and B) Confocal microscopy analysis of mitochondrial network in different HCC cells as indicated. Scale bars: 5 µm. siDNM1L-1 and siDNM1L-2, siRNAs against DNM1L; siMFN1, siRNA against MFN1; siCtrl, control siRNA; DNM1L, expression vector encoding DNM1L; MFN1, expression vector encoding MFN1; EV, empty vector. (C) Depolarization of mitochondrial membrane potential was analyzed by JC-1 staining in HCC cells with treatment as indicated. (D) Oxygen consumption rate (OCR) was measured with a liquid-phase oxygen electrode in HCC cells with treatment as indicated. (E) HCC cells were transiently transfected with siRNA or expression vector as indicated. Cells were reseeded for MTS cell viability assay 24 h after transfection. (F) Tumor growth curves of subcutaneous xenograft tumor model developed from HCC cells which were stably transfected with shRNA (n = 5) or forced-expression vector of DNM1L (n = 6) as indicated (lower panel). Tumor size including tumor length (L) and width (W) was measured using vernier calipers every 4 d from d 10 after transplantation. The tumor volumes were calculated according to the formula (L x W2)/2 and presented as mean ± SEM. Tumors from sacrificed mice were dissected 30 d after transplantation and were also shown in upper panel. shDNM1L, shRNA expression vector against DNM1L; shCtrl, control shRNA.
Figure 3.
Figure 3.
Increased mitochondrial fission inhibits mitochondria-dependent apoptosis. (A and B) Flow cytometry analysis of apoptosis by ANXA5/Annexin V (an indicator of apoptosis) and PI staining in both Bel7402 and SMMC7721 cells 48 h after transfection with siRNA or expression vector as indicated. SMMC7721 cells were also treated with CCCP (150 μM) for 4 h before apoptosis analysis. (C) Western blot analyses for protein levels of CYCS (cytochrome c) in cytoplasm and mitochondria of HCC cells with treatment as indicated. ACTB and COX4I1/COX IV were used as loading controls for cytoplasm and mitochondria, respectively. Cyto, cytoplasm; Mito, mitochondria. (D) Western blot analyses for protein levels of DNM1L, cleaved CASP9 and cleaved CASP3 in HCC cells with treatment as indicated. (E) Apoptosis analysis by flow cytometry in Bel7402 cells 48 h after treatment with siRNA and caspase inhibitor Z-VAD as indicated. Z-VAD (20 μM) treatment for 24 h were applied before cell harvest. Z-VAD, Z-VAD-FMK. (F and G) TUNEL staining in tumor tissues of nude mice xenograft model developed from different HCC cells stably transfected with different expression vector as indicated. Blue, Hochest 33342; Green, TUNEL-positive nucleus. *, P < 0.05; **, P < 0.01. Scale bar: 50 μm.
Figure 4.
Figure 4.
Increased mitochondrial fission affects apoptosis of HCC cells through coordinately regulating the NFKB and TP53 pathways. (A) Western blot analyses for protein levels of DNM1L, apoptosis-related molecules BCL2, BCL2L1, BID, TP53 and RELA in HCC cells with treatment as indicated. LMNB1 (a nuclear envelope marker) and ACTB were used as loading controls in the nuclear and cytoplasmic fractions, respectively. (B) Western blot analyses for protein levels of DNM1L and apoptosis-related molecules in whole-cells or RELA in cytoplasm and nucleus of SMMC7721 cells transiently transfected with the DNM1L expression vector and then followed by treatment with the NFKB inhibitor Bay11-7082 (12.5 μM) for 12 h. (C) Cell apoptosis was respectively evaluated in SMMC7721 cells with treatment as indicated. (D) Western blot analyses for protein levels of DNM1L, TP53 and apoptosis-related molecules in SMMC7721 cells transiently tansfected with DNM1L and/or TP53 expression vectors as indicated. (E) Cell apoptosis was evaluated in SMMC7721 cells tansfected with different expression vectors as indicated. (F) Western blot analyses for protein levels of cleaved CASP9 and cleaved CASP3 in HCC cells treated with obatoclax (5 μM) for 12 h before cell harvest. (G) The correlation was evaluated between the protein expression levels of DNM1L and TP53 or nuclear RELA in 128 HCC tissues based on IHC staining.
Figure 5.
Figure 5.
Inhibition of apoptosis by increased mitochondrial fission is alternatively regulated by activation of autophagy. (A and B) Western blot analyses for total protein levels of DNM1L, MFN1, BECN1, LC3B-I/-II, SQSTM1, PINK1 and PARK2 in HCC cells with different treatments as indicated. Protein levels of PARK2 in mitochondria were examined by purifying mitochondria from HCC cells. COX4I1/COX IV were used as loading controls for mitochondria. (C) Representative images of fluorescent LC3B puncta (green) and mitochondria (red) in HCC cells with different treatment as indicated. Scale bar: 5 µm. (D) Numbers of GFP-LC3B puncta per cell were analyzed in HCC cells with treatment as indicated. (E) Western blot analyses for DNM1L, BECN1, LC3B-I/-II, SQSTM1, PINK1 and PARK2 in SMMC7721 cells transiently transfected with DNM1L expression vector and then followed by treatment with the NFKB inhibitor Bay11-7082 (left panel) and for DNM1L, TP53, BECN1, LC3B-I/-II, SQSTM1, PINK1 and PARK2 in those cells transiently tansfected with DNM1L and/or TP53 expression vectors (middle panel) as well as for DNM1L, BECN1, LC3B-I/-II and SQSTM1 in cells with DNM1L knockdown or overexpression, which were transiently tansfected with BECN1 siRNA or BECN1 expression vector (right panel) as indicated. (F) Cell viability was evaluated by MTS assay in HCC cells with different treatment as indicated. (G) Apoptosis analysis by flow cytometry in HCC cells with treatment as indicated.
Figure 6.
Figure 6.
Increased mitochondrial fission regulates the activity of NFKB and TP53 through the ROS-modulated AKT-IKK-NFKBIA and AKT-MDM2 pathways. (A) Intracellular ROS levels were analyzed by flow cytometry in HCC cells treated as indicated. (B) Western blot analyses for protein levels of AKT, phosphorylated AKT (p-AKT), phosphorylated MDM2 (p-MDM2), phosphorylated IKK (p-IKK) and NFKBIA in HCC cells treated as indicated. (C and D) Western blot analyses for protein levels of DNM1L, AKT, p-AKT, p-MDM2 and TP53 in HCC cells transiently transfected with DNM1L siRNA or expression vector and then followed by treatment with 100 µM H2O2 or 20 mM NAC for 12 h as indicated. (E and F) Western blot analyses for protein levels of DNM1L, AKT, p-AKT, p-IKK and NFKBIA or nuclear and cytosolic RELA in HCC cells with treatment as indicated.
Figure 7.
Figure 7.
The DNM1L inhibitor Mdivi-1 exhibits a therapeutic effect on HCC in vitro and in vivo. (A) Confocal microscopy analysis of the mitochondrial network in HCC cells treated with 50 µM Mdivi-1 or DMSO for 12 h as indicated. (B) Cell viability for HCC cells treated with Mdivi-1 or DMSO was evaluated using the MTS assay. (C) Cell apoptosis was measured in HCC cells treated with Mdivi-1 or DMSO as indicated. (D) Bel7402 tumor-bearing mice were treated with Mdivi-1 (0.75 mg/mice) or DMSO by intratumor injection. Dissected tumors from sacrificed mice are shown in upper panel. Tumor growth curves of the subcutaneous xenograft tumor model are shown in lower panel. (E) TUNEL staining in tumor tissues of nude mice treated as indicated. Scale bar: 50 µm. (F) Schematic depicting the effect of increased mitochondrial fission on the HCC cell survival and underlying mechanism.

Similar articles

Cited by

References

    1. Westermann B. Mitochondrial fusion and fission in cell life and death. Nat Rev Mol Cell Biol 2010; 11:872-84; PMID:21102612; http://dx.doi.org/10.1038/nrm3013 - DOI - PubMed
    1. Chan DC. Mitochondria: dynamic organelles in disease, aging, and development. Cell 2006; 125:1241-52; PMID:16814712; http://dx.doi.org/10.1016/j.cell.2006.06.010 - DOI - PubMed
    1. Rehman J, Zhang HJ, Toth PT, Zhang Y, Marsboom G, Hong Z, Salgia R, Husain AN, Wietholt C, Archer SL. Inhibition of mitochondrial fission prevents cell cycle progression in lung cancer. FASEB J 2012; 26:2175-86; PMID:22321727; http://dx.doi.org/10.1096/fj.11-196543 - DOI - PMC - PubMed
    1. Jin B, Fu G, Pan H, Cheng X, Zhou L, Lv J, Chen G, Zheng S. Anti-tumour efficacy of mitofusin-2 in urinary bladder carcinoma. Medical oncology 2011; 28 Suppl 1:S373-80; PMID:20803103; http://dx.doi.org/10.1007/s12032-010-9662-5 - DOI - PubMed
    1. Zhao J, Zhang J, Yu M, Xie Y, Huang Y, Wolff DW, Abel PW, Tu Y. Mitochondrial dynamics regulates migration and invasion of breast cancer cells. Oncogene 2013; 32:4814-24; PMID:23128392; http://dx.doi.org/10.1038/onc.2012.494 - DOI - PMC - PubMed

MeSH terms