. 2016 Apr 28;11(4):e0154590.
doi: 10.1371/journal.pone.0154590. eCollection 2016.

Porphyromonas gingivalis Differentially Modulates Cell Death Profile in Ox-LDL and TNF-α Pre-Treated Endothelial Cells

Affiliations

Porphyromonas gingivalis Differentially Modulates Cell Death Profile in Ox-LDL and TNF-α Pre-Treated Endothelial Cells

Isaac Maximiliano Bugueno et al. PLoS One. .

Abstract

Objective: Clinical studies demonstrated a potential link between atherosclerosis and periodontitis. Porphyromonas gingivalis (Pg), one of the main periodontal pathogen, has been associated to atheromatous plaque worsening. However, synergism between infection and other endothelial stressors such as oxidized-LDL or TNF-α especially on endothelial cell (EC) death has not been investigated. This study aims to assess the role of Pg on EC death in an inflammatory context and to determine potential molecular pathways involved.

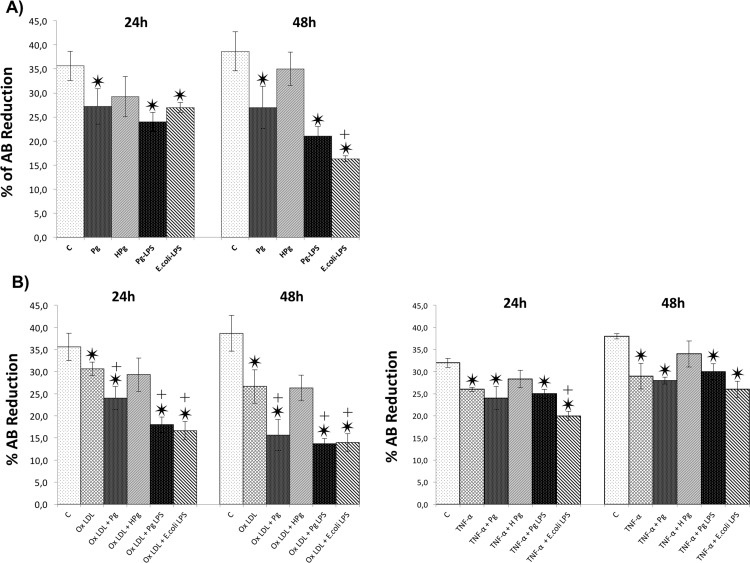
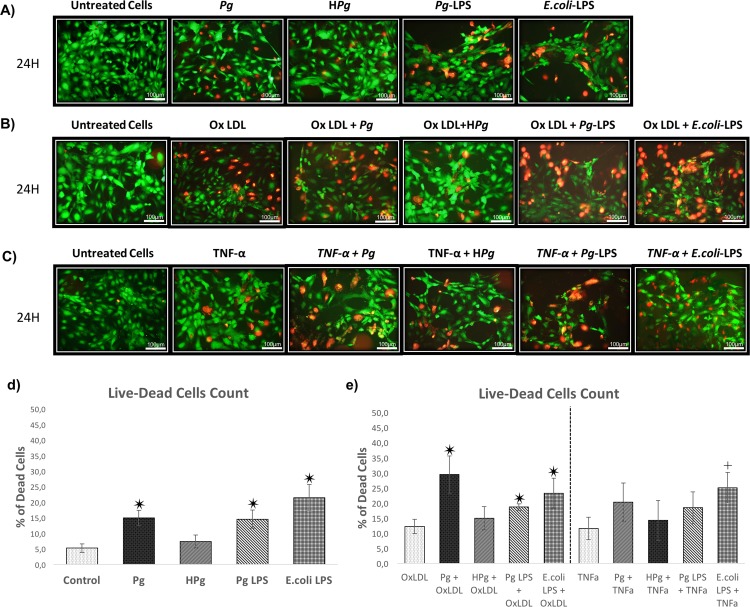
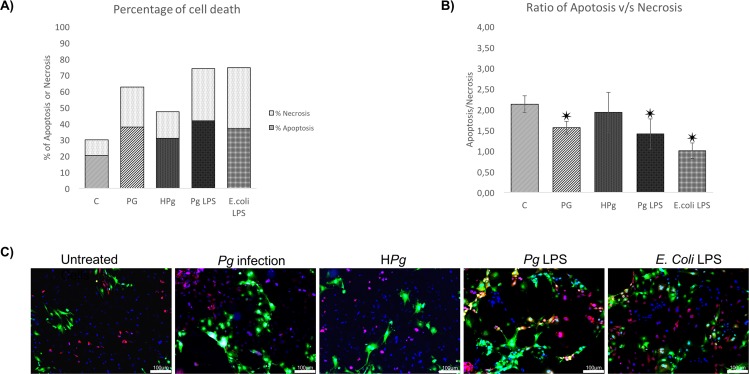
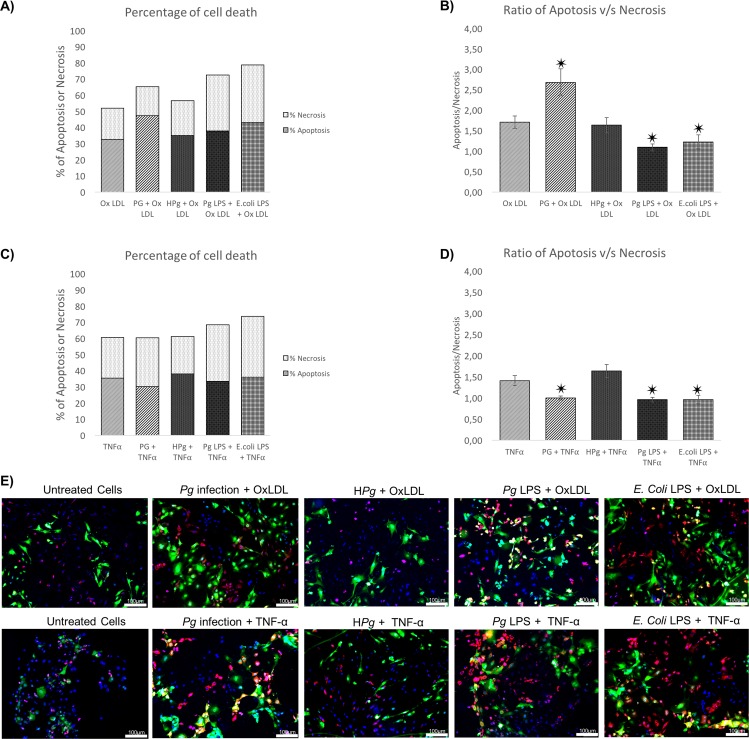
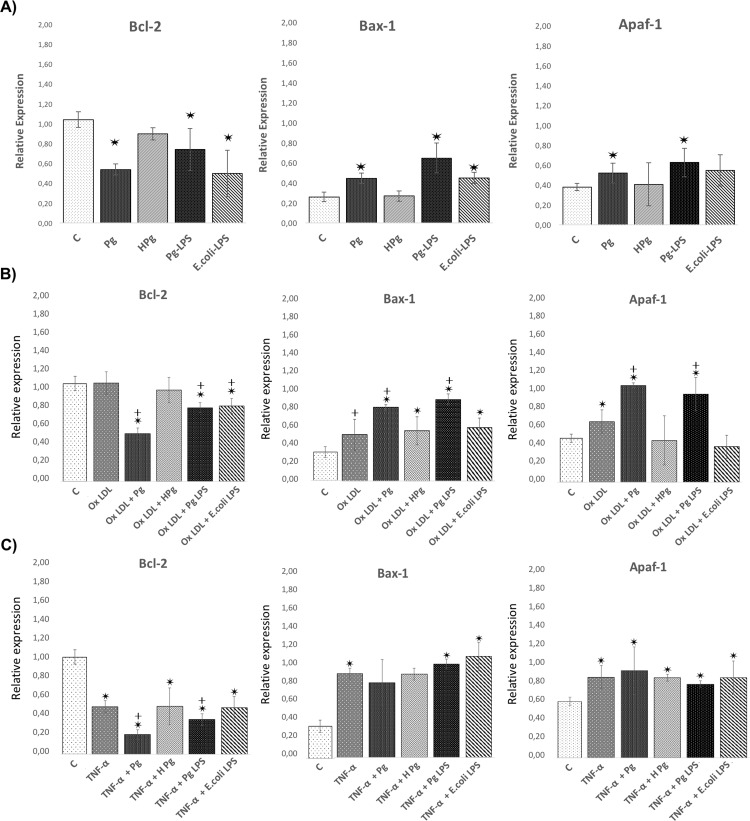
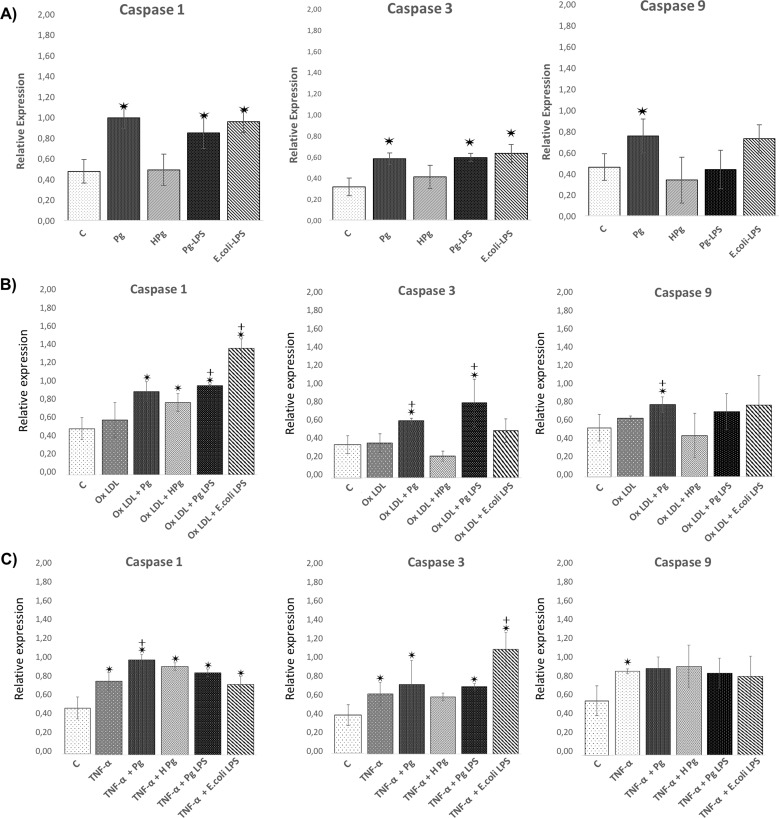
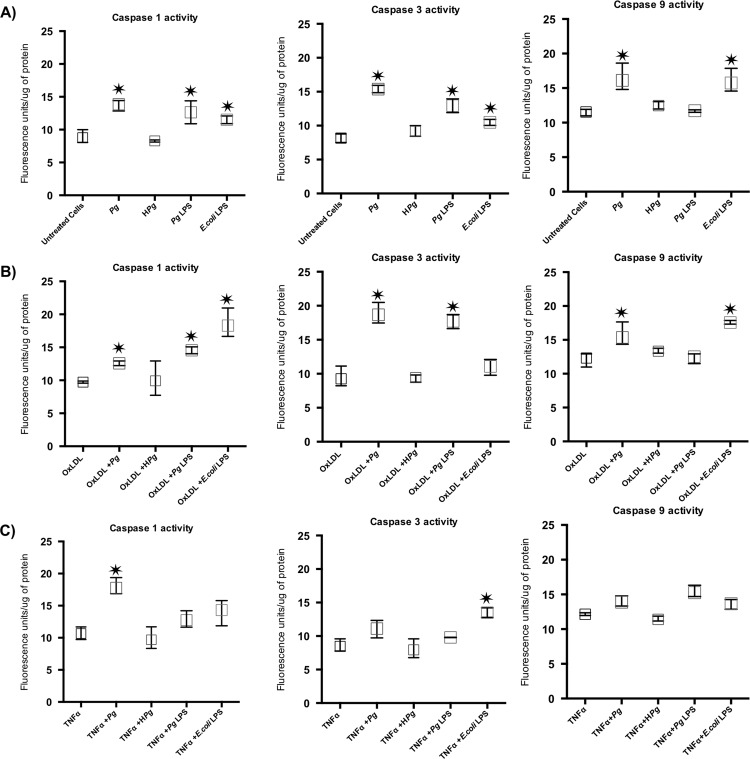
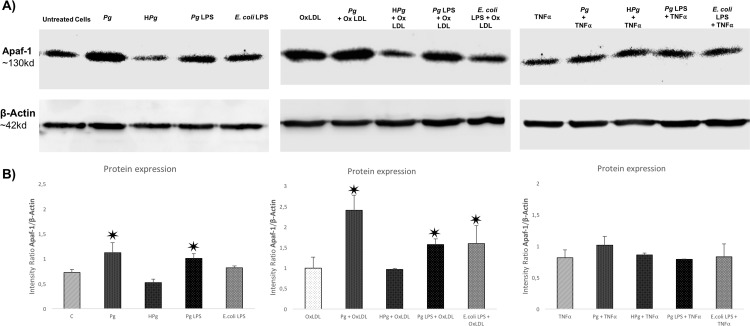
Methods: Human umbilical vein ECs (HUVECs) were infected with Pg (MOI 100) or stimulated by its lipopolysaccharide (Pg-LPS) (1μg/ml) for 24 to 48 hours. Cell viability was measured with AlamarBlue test, type of cell death induced was assessed using Annexin V/propidium iodide staining. mRNA expression regarding caspase-1, -3, -9, Bcl-2, Bax-1 and Apaf-1 has been evaluated with RT-qPCR. Caspases enzymatic activity and concentration of APAF-1 protein were evaluated to confirm mRNA results.

Results: Pg infection and Pg-LPS stimulation induced EC death. A cumulative effect has been observed in Ox-LDL pre-treated ECs infected or stimulated. This effect was not observed in TNF-α pre-treated cells. Pg infection promotes EC necrosis, however, in infected Ox-LDL pre-treated ECs, apoptosis was promoted. This effect was not observed in TNF-α pre-treated cells highlighting specificity of molecular pathways activated. Regarding mRNA expression, Pg increased expression of pro-apoptotic genes including caspases-1,-3,-9, Bax-1 and decreased expression of anti-apoptotic Bcl-2. In Ox-LDL pre-treated ECs, Pg increased significantly the expression of Apaf-1. These results were confirmed at the protein level.

Conclusion: This study contributes to demonstrate that Pg and its Pg-LPS could exacerbate Ox-LDL and TNF-α induced endothelial injury through increase of EC death. Interestingly, molecular pathways are differentially modulated by the infection in function of the pre-stimulation.


Conflict of interest statement

Competing Interests: The authors have declared that no competing interests exist.

Figures

Fig 1
Fig 1. Pg ant its LPS increase ECs death.
(A) Viability of HUVECs infected with Pg at a MOI of 100 or Heat-inactivated Pg (HPg) and stimulated by Pg-LPS (1μg/ml) or E.Coli-LPS (1μg/ml) for 24h to 48h was measured using AlamarBlue test. (B) Viability of Ox-LDL (50μg/ml) and TNF- α (10ng/ml) pre-treated HUVECs with Pg at a MOI of 100 or Heat-inactivated Pg (HPg) and stimulated by Pg-LPS (1μg/ml) or E.Coli-LPS (1μg/ml) for 24h to 48h. Data were expressed as mean ± SD. *: difference between non-stimulated/infected and stimulated/infected cells, p < 0.05, ┼: difference between non pre-treated/stimulated/infected and treated cells, p < 0.05.
Fig 2
Fig 2. Qualitative evaluation of the EC death.
(A) Viability of HUVECs infected with Pg at a MOI of 100 or Heat-inactivated Pg (HPg) and stimulated by Pg-LPS (1μg/ml) or E.Coli-LPS (1μg/ml) at 24h. All different conditions have been evaluated quantitatively and qualitatively by Live-Dead staining assays. (B) Viability of Ox-LDL (50μg/ml) pre-treated HUVECs on cell cultures infected with Pg or HPg at a MOI of 100 and stimulated by Pg-LPS (1μg/ml) or E.Coli-LPS (1μg/ml) at 24h. (C) Viability of TNF- α (10ng/ml) pre-treated HUVECs on cell cultures infected with Pg or HPg at a MOI of 100 and stimulated by Pg-LPS (1μg/ml) or E.Coli-LPS (1μg/ml) at 24h. (D) Percentage of dead cells infected with Pg or HPg and stimulated by Pg-LPS (1μg/ml) or E.Coli-LPS (1μg/ml) at 24h. (E) Percentage of dead cells in OxLDL qnd TNF- α pre-treated HUVECs. All images were acquired under fluorescence microscopy (in green: viable cells; in red: dead cells). All scale bars indicate 100 μm.
Fig 3
Fig 3. Infection of ECs leads to cell death mediated by apoptosis.
(A) Percentage of cell death of ECs infected with Pg or Heat inactivated Pg (HPg) at a MOI of 100 and stimulated by Pg-LPS (1μg/ml) or E.Coli-LPS (1μg/ml). Each percentage was calculated on account of total cells counted in triplicate for each experiment. (B) The apoptosis/necrosis ratio of ECs infected with Pg or Heat inactivated Pg (HPg) at a MOI of 100 and stimulated by Pg-LPS (1μg/ml) or E.Coli-LPS (1μg/ml). Each value was calculated from the ratio between the total number of apoptotic cells and necrotic cells and for each count nine images were used of each experimentation. Data were expressed as mean ± SD. ✷: difference between non pre-treated/stimulated/infected and infected/stimulated cells, p < 0.05; (C) Infected and stimulated HUVECs cell death was evaluated for each condition qualitatively using Annexin V-IP staining at 24h (in green: Annexin V positive staining; in red: Iodure propidium positive staining; in blue: DAPI nuclear staining) Images were acquired under fluorescence microscopy (10x) after Annexin V-IP and DAPI staining for all previously described condition. All scale bars indicate 100 μm.
Fig 4
Fig 4. Pre-treatment of EC leads to different types of cell death induced by Pg.
(A) Percentage of cell death of Ox-LDL (50μg/ml) pre-treated ECs infected with Pg at a MOI of 100 or Heat-inactivated Pg (HPg) and stimulated by Pg-LPS (1μg/ml) or E.Coli-LPS (1μg/ml) for 24h. (B) The apoptosis/necrosis ratio of Ox-LDL (50μg/ml) pre-treated ECs with Pg at a MOI of 100 or Heat-inactivated Pg (HPg) and stimulated by Pg-LPS (1μg/ml) or E.Coli-LPS (1μg/ml) for 24h. (C) Percentage of cell death of TNF-α (10ng/ml) pre-treated ECs infected with Pg at a MOI of 100 or Heat-inactivated Pg (HPg) and stimulated by Pg-LPS (1μg/ml) or E.Coli-LPS (1μg/ml) for 24h. (D) The apoptosis/necrosis ratio of TNF- α (10ng/ml) pre-treated ECs infected with Pg at a MOI of 100 or Heat-inactivated Pg (HPg) and stimulated by Pg-LPS (1μg/ml) or E.Coli-LPS (1μg/ml) for 24h. Data were expressed as mean ± SD. ✷: difference between non pre-treated/stimulated/infected and infected/stimulated cells, p < 0.05; (E) Infected and stimulated Ox-LDL (50μg/ml) and TNF- α (10ng/ml) pre-treated HUVECs cell death was evaluated for each condition qualitatively using Annexin V-IP staining at 24h and 48h (in green: Annexin V positive staining; in red: Iodure propidium positive staining; in blue: DAPI nuclear staining). Images were acquired under fluorescence microscopy (10x) after Annexin V-IP and DAPI staining for all previously described condition. All scale bars indicate 100 μm.
Fig 5
Fig 5. Pg and its LPS modulate the expression of EC death related gene expression.
(A) Gene expression of Bcl-2, Bax-1, and Apaf-1 in HUVECs infected with Pg at a MOI of 100 or with heat inactivated Pg and stimulated by Pg-LPS (1μg/ml) or E.Coli-LPS (1μg/ml) at 24h. (B) Gene expression for the same described genes in Ox-LDL (50μg/ml) pre-treated HUVECs infected with Pg at a MOI of 100 or with heat inactivated Pg and stimulated by Pg-LPS (1μg/ml) or E.Coli-LPS (1μg/ml) at 24h. (A) Gene expression for the same described genes in TNF- α (10ng/ml) pre-treated HUVECs infected with Pg at a MOI of 100 or with heat inactivated Pg and stimulated by Pg-LPS (1μg/ml) or E.Coli-LPS (1μg/ml) at 24h. Data were expressed as mean ± SD. *: difference between non-stimulated/infected and stimulated/infected cells, p < 0.05, ┼: difference between non pre-treated/stimulated/infected and treated cells, p < 0.05.
Fig 6
Fig 6. Differential modulation of the EC death related gene expression with Pg and its LPS in Ox-LDL and TNF-α pre-treated cells.
(A) Gene expression of Caspase-1,-3 and -9 in HUVECs infected with Pg at a MOI of 100 or with heat inactivated Pg and stimulated by Pg-LPS (1μg/ml) or E.Coli-LPS (1μg/ml) at 24h. (B) Gene expression for the same described genes in Ox-LDL pre-treated HUVECs at 24h. (C) Gene Expression for the same described genes in TNF- α pre-treated HUVECs at 24h. Data were expressed as mean ± SD. *: difference between non-stimulated/infected and stimulated/infected cells, p < 0.05, ┼: difference between non pre-treated/stimulated/infected and treated cells, p < 0.05.
Fig 7
Fig 7. Differential modulation of the EC death related caspase activity after infection with Pg and its LPS in Ox-LDL and TNF-α pre-treated cells.
(A) Enzymatic activity of Caspase-1, -3 and -9 in HUVECs infected with Pg at a MOI of 100 or with heat inactivated Pg and stimulated by Pg-LPS (1μg/ml) or E.Coli-LPS (1μg/ml) at 24h. (B) Enzymatic activity of Caspase-1, -3 and -9 in Ox-LDL pre-treated HUVECs at 24h. (C) Enzymatic activity of Caspase-1, -3 and -9 in in TNF- α pre-treated HUVECs at 24h. Data were expressed as mean ± SD. *: difference between non-stimulated/infected and stimulated/infected cells, p < 0.05.
Fig 8
Fig 8. Differential modulation of Apaf-1 protein expression after infection with Pg and its LPS in Ox-LDL and TNF-α pre-treated cells.
(A) Western blot analysis for Apaf-1 protein in HUVECs infected with Pg at a MOI of 100 or with HPg and stimulated by Pg-LPS (1μg/ml) or E.Coli-LPS (1μg/ml) and pre-treated with Ox-LDL (50μg/ml) or TNF- α (10ng/ml) at 24h. (B) Density tracing was used to illustrate the quantitative differences in western blot analysis for Apaf-1 protein. Data were expressed as mean ± SD. *: difference between non-stimulated/infected and stimulated/infected cells, p < 0.05.

References

    1. Hajishengallis G, Lamont RJ. Breaking bad: manipulation of the host response by Porphyromonas gingivalis. Eur J Immunol. 2014;44: 328–338. 10.1002/eji.201344202 - DOI - PMC - PubMed
    1. Hajishengallis G. Periodontitis: from microbial immune subversion to systemic inflammation. Nat Rev Immunol. 2015;15: 30–44. 10.1038/nri3785 - DOI - PMC - PubMed
    1. Lockhart PB, Bolger AF, Papapanou PN, Osinbowale O, Trevisan M, Levison ME, et al. Periodontal Disease and Atherosclerotic Vascular Disease: Does the Evidence Support an Independent Association?: A Scientific Statement From the American Heart Association. Circulation. 2012;125: 2520–2544. 10.1161/CIR.0b013e31825719f3 - DOI - PubMed
    1. Huck O, Saadi-Thiers K, Tenenbaum H, Davideau J-L, Romagna C, Laurent Y, et al. Evaluating periodontal risk for patients at risk of or suffering from atherosclerosis: recent biological hypotheses and therapeutic consequences. Archives of Cardiovascular Diseases. 2011;104: 352–358. 10.1016/j.acvd.2011.02.002 - DOI - PubMed
    1. Rosenfeld ME, Campbell LA. Pathogens and atherosclerosis: update on the potential contribution of multiple infectious organisms to the pathogenesis of atherosclerosis. Thromb Haemost. 2011;106: 858–867. 10.1160/TH11-06-0392 - DOI - PubMed

Publication types

MeSH terms