. 2016 Apr 8;352(6282):216-20.
doi: 10.1126/science.aad8127. Epub 2016 Apr 7.

Task-free MRI predicts individual differences in brain activity during task performance

Affiliations

Task-free MRI predicts individual differences in brain activity during task performance

I Tavor et al. Science. .

Abstract

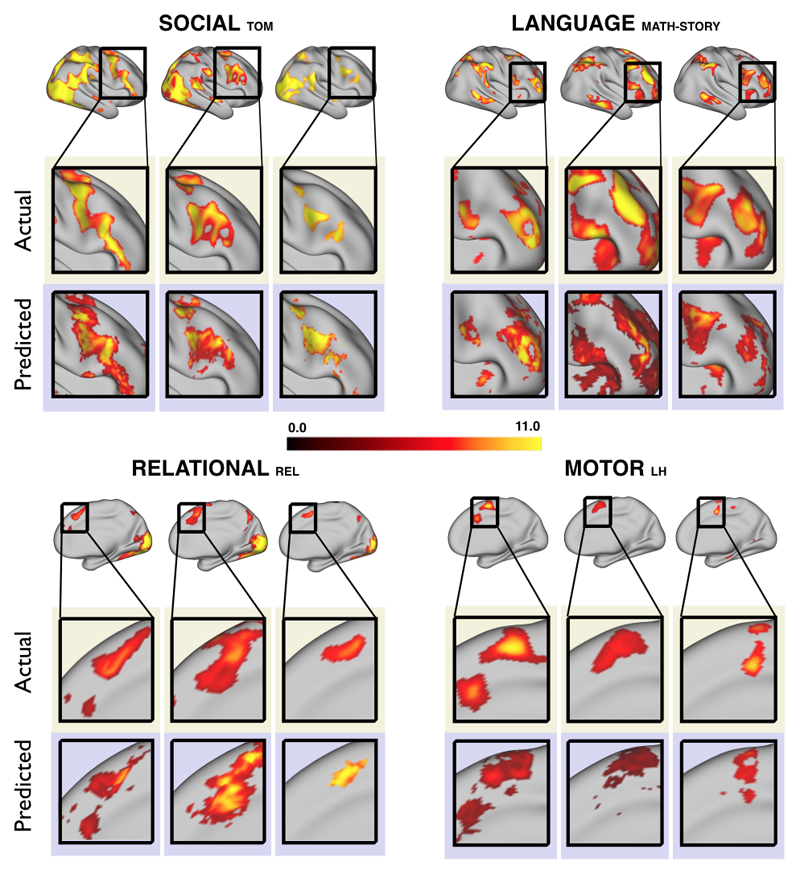
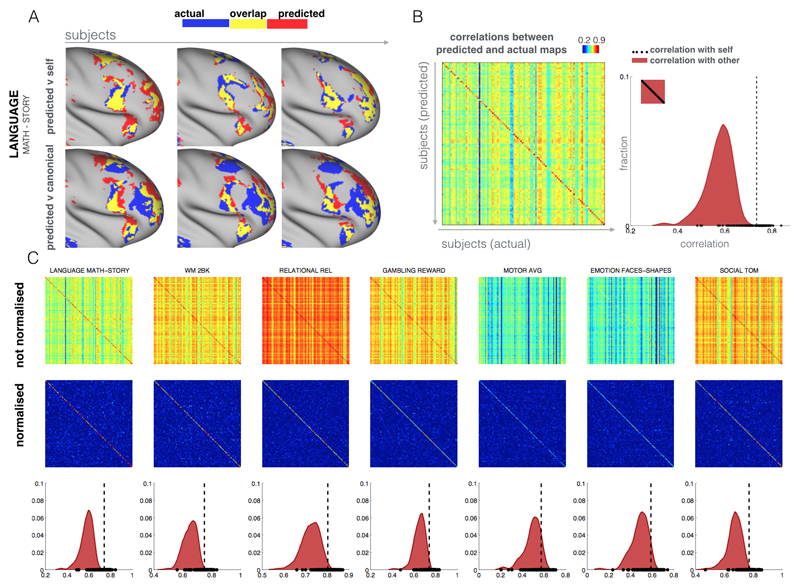
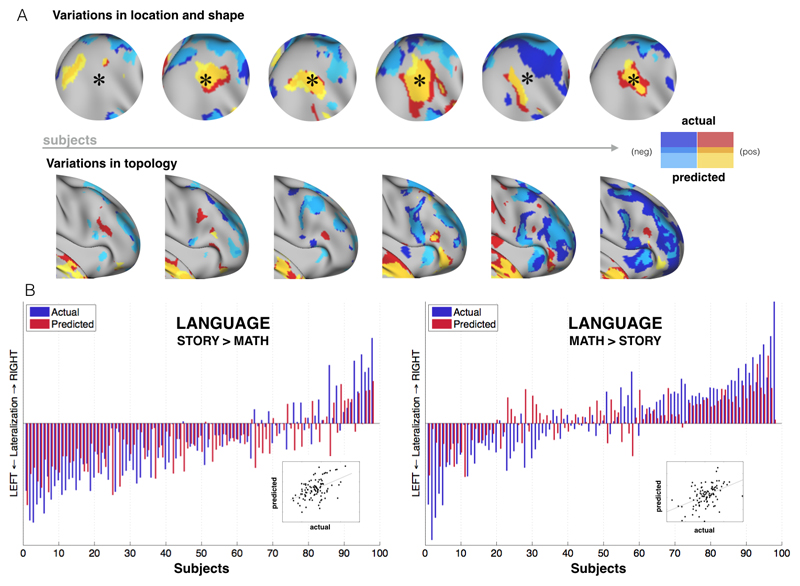
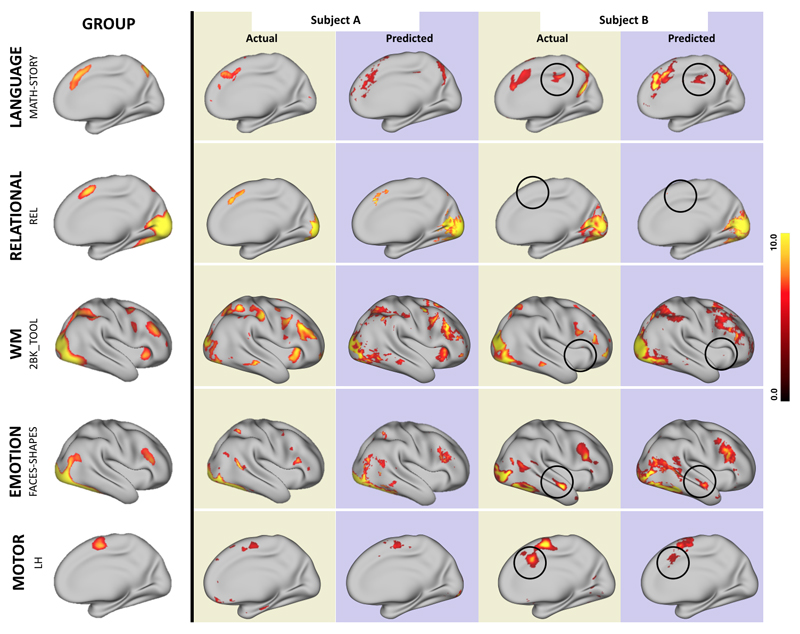
When asked to perform the same task, different individuals exhibit markedly different patterns of brain activity. This variability is often attributed to volatile factors, such as task strategy or compliance. We propose that individual differences in brain responses are, to a large degree, inherent to the brain and can be predicted from task-independent measurements collected at rest. Using a large set of task conditions, spanning several behavioral domains, we train a simple model that relates task-independent measurements to task activity and evaluate the model by predicting task activation maps for unseen subjects using magnetic resonance imaging. Our model can accurately predict individual differences in brain activity and highlights a coupling between brain connectivity and function that can be captured at the level of individual subjects.


Figures

Fig. 1
Fig. 1. Predicting individual variations in task maps.
Figure shows actual and predicted thresholded task maps in 3 subjects and 4 different task contrasts. The model is able to capture striking variations between subjects in the shape, topology and extent of their activation maps. Predictions and comparisons to actual maps for all behavioral domains and more subjects are shown in Figures S1-S3 and movies SM1-SM6.
Fig. 2
Fig. 2. Specificity of the individual predictions.
A subject’s prediction map is more similar to the subject’s actual map than to the rest of the subjects. (A) Predicted maps (zoomed on the right frontal lobe) of the MATH-STORY contrast from the LANGUAGE task of 3 subjects are overlapped with their actual activation maps (top row). We also overlap the subjects' predictions with the activation map of the median subject (bottom row). Blue represents actual activation, red is the predicted activation and yellow is the overlap. The maximum overlap is obtained when comparing a given subject's prediction to their own actual map. (B) Pearson correlation matrix between actual (columns) and predicted activations (rows). The correlation matrix is noticeably diagonal-dominant, indicating that on average the model prediction for any given subject is more similar to the subject's own map than to other subjects' maps. This is also shown as a histogram plot, where the extra-diagonal elements of the correlation matrix (subject X vs subject Y) are compared to the diagonal elements (subject X vs subject X). The vertical dashed line corresponds to the median of the correlation coefficients along the diagonal. (C) Correlation matrices and histograms for 6 additional behavioral domains. When normalizing the rows and columns of the correlation matrices (which removes the mean and accounts for higher variability in actual than predicted maps), the diagonal-dominance is even more prominent. In all cases, a Kolmogorov-Smirnov test between the two distributions (self vs other) gives a highly significant difference (p < 10-10).
Fig. 3
Fig. 3. Capturing qualitative and quantitative inter-individual differences.
A. Variations in location, shape and topology are predicted by the model (contrast: LANGUAGE MATH-STORY). B. Peak Z scores were calculated for each hemisphere to examine how well the model can predict the amount of activation for each subject. A lateralization index (difference between right and left peak activation levels) is then calculated for each subject for both predicted and actual data and is shown as red and blue bars, respectively (LANGUAGE task). The model is able to predict individual subjects' lateralization index for both contrasts, including in the case where the majority of the subjects are left-lateralized. Statistical tests: MATH-STORY (r = 0.47, p < 10-5), STORY-MATH (r = 0.48, p < 10-6).
Fig. 4
Fig. 4. Predictions in atypical subjects.
The figure demonstrates the ability of our prediction model to detect inter-subject variability when subjects differ from the group-averaged activation. In each row the group activation for each behavioral domain is shown on the left, and the actual and predicted activations for 2 subjects are shown on the right. In each row we show activations and predictions for one subject that is similar to the group activation (A) and one that differs from it (B) as shown by the black circles. The model can capture the presence of clusters that are not active in the group (rows 1,4,5) as well as the absence of clusters that are active in the group (rows 2,3). Note that subjects A and B are not the same pair of subjects across behavioral domains.

References

    1. Jenkinson M, Smith S. A global optimisation method for robust affine registration of brain images. Medical Image Analysis. 2001;5:143–156. published online EpubJun. - PubMed
    1. Besle J, Sanchez-Panchuelo RM, Bowtell R, Francis S, Schluppeck D. Single-subject fMRI mapping at 7 T of the representation of fingertips in S1: a comparison of event-related and phase-encoding designs. J Neurophysiol. 2013;109:2293–2305. doi: 10.1152/jn.00499.2012. published online EpubMay. - DOI - PMC - PubMed
    1. McNab F, Klingberg T. Prefrontal cortex and basal ganglia control access to working memory. Nat Neurosci. 2008;11:103–107. doi: 10.1038/nn2024. published online EpubJan. - DOI - PubMed
    1. Mukai I, Kim D, Fukunaga M, Japee S, Marrett S, Ungerleider LG. Activations in visual and attention-related areas predict and correlate with the degree of perceptual learning. J Neurosci. 2007;27:11401–11411. doi: 10.1523/JNEUROSCI.3002-07.2007. published online EpubOct 17. - DOI - PMC - PubMed
    1. Tom SM, Fox CR, Trepel C, Poldrack RA. The neural basis of loss aversion in decision-making under risk. Science. 2007;315:515–518. doi: 10.1126/science.1134239. published online EpubJan 26. - DOI - PubMed

Publication types