. 2016 May 1;30(9):1020-33.
doi: 10.1101/gad.278549.116. Epub 2016 Apr 28.

Germline loss of PKM2 promotes metabolic distress and hepatocellular carcinoma

Affiliations

Germline loss of PKM2 promotes metabolic distress and hepatocellular carcinoma

Talya L Dayton et al. Genes Dev. .

Abstract

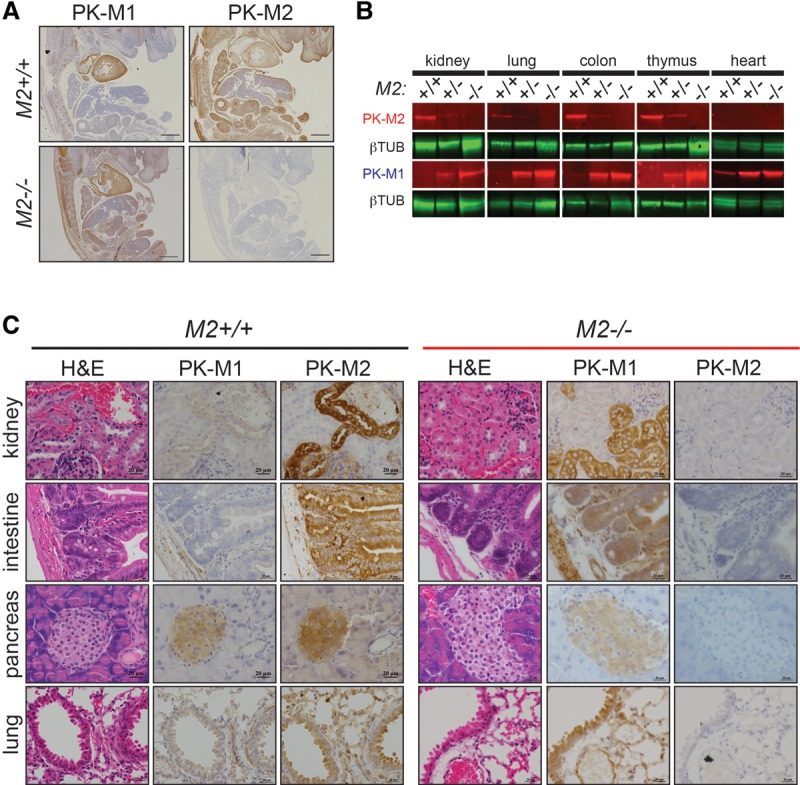
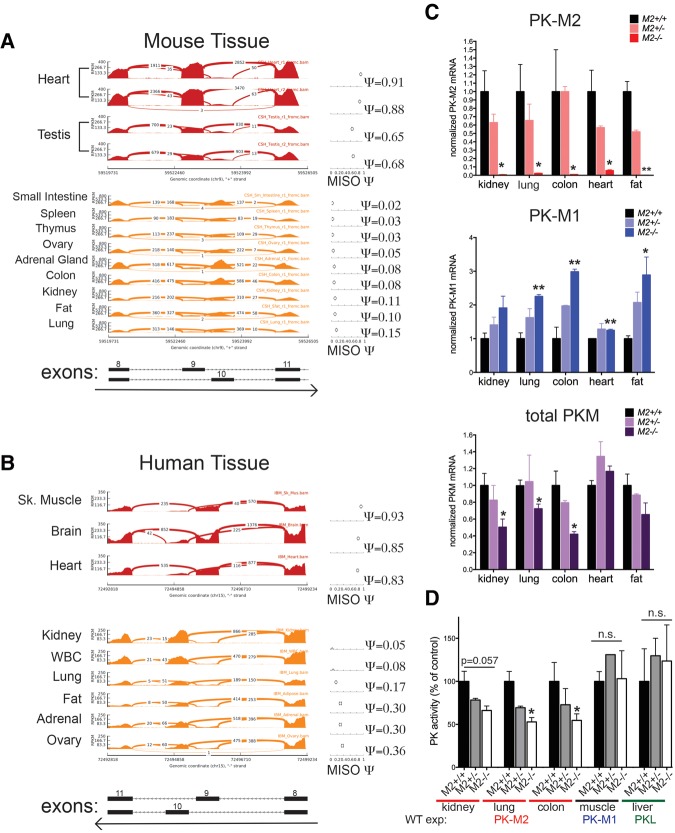
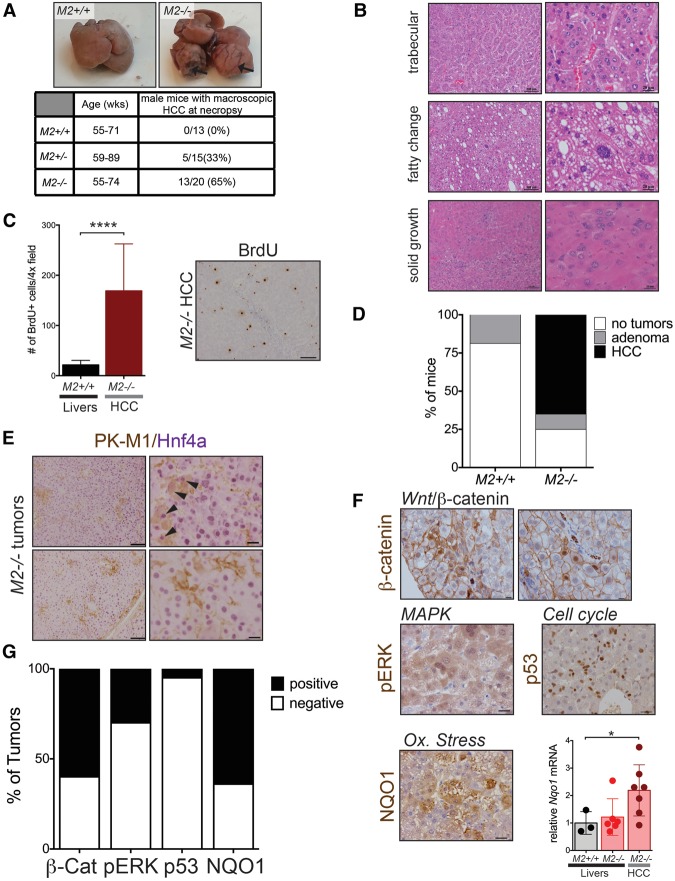
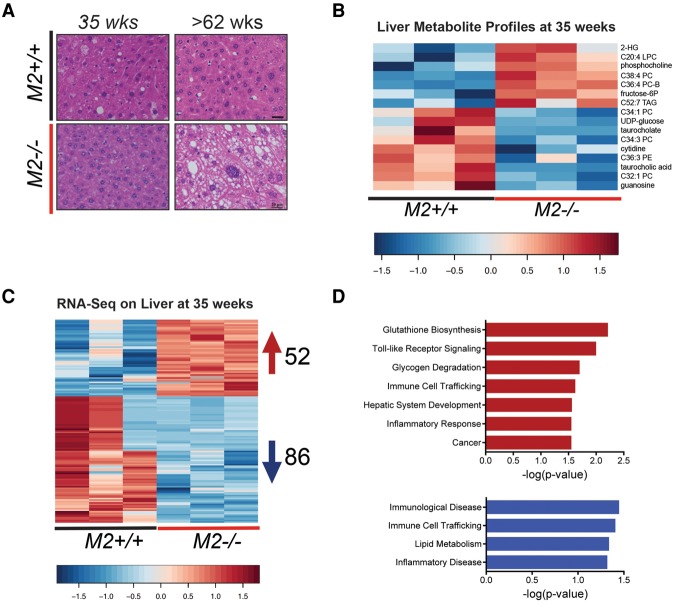
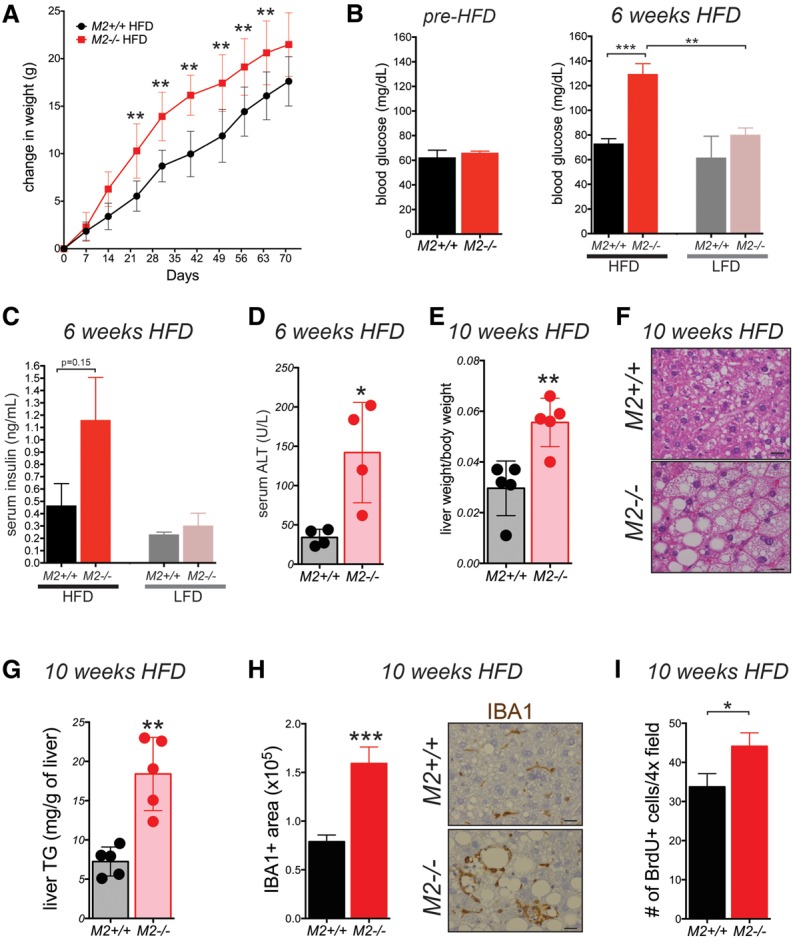
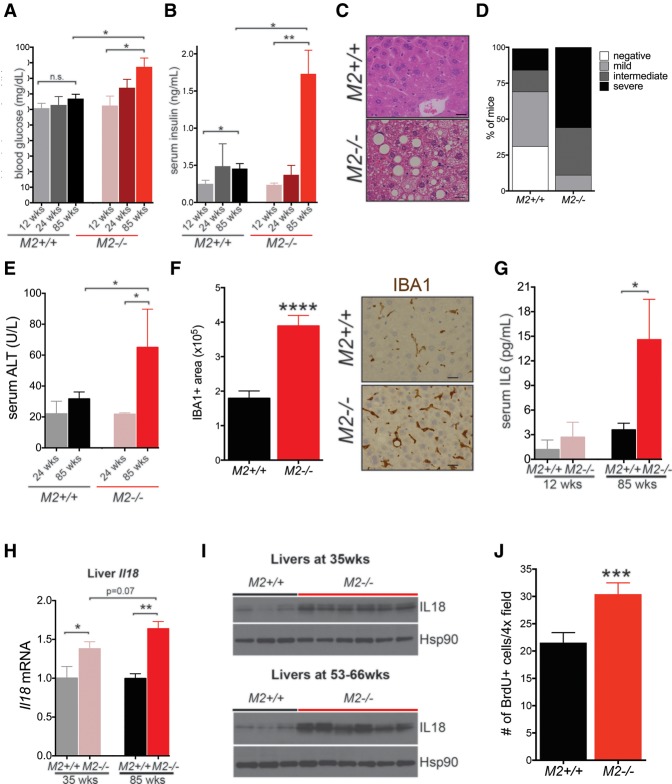
Alternative splicing of the Pkm gene product generates the PKM1 and PKM2 isoforms of pyruvate kinase (PK), and PKM2 expression is closely linked to embryogenesis, tissue regeneration, and cancer. To interrogate the functional requirement for PKM2 during development and tissue homeostasis, we generated germline PKM2-null mice (Pkm2(-/-)). Unexpectedly, despite being the primary isoform expressed in most wild-type adult tissues, we found that Pkm2(-/-) mice are viable and fertile. Thus, PKM2 is not required for embryonic or postnatal development. Loss of PKM2 leads to compensatory expression of PKM1 in the tissues that normally express PKM2. Strikingly, PKM2 loss leads to spontaneous development of hepatocellular carcinoma (HCC) with high penetrance that is accompanied by progressive changes in systemic metabolism characterized by altered systemic glucose homeostasis, inflammation, and hepatic steatosis. Therefore, in addition to its role in cancer metabolism, PKM2 plays a role in controlling systemic metabolic homeostasis and inflammation, thereby preventing HCC by a non-cell-autonomous mechanism.

Keywords: HCC; PKM2; metabolism.


Figures

Figure 1.
Figure 1.
Germline loss of PKM2 leads to expression of PKM1. (A) Representative images of IHC for PKM1 and PKM2 in wild-type (M2+/+) and Pkm2-deficient (M2−/−) mouse embryos harvested at E14.5. Bars, 500 μm. (B) Western blot analysis for PKM2 protein on tissue lysates from M2+/+, M2+/−, or M2−/− mice. β-Tubulin was used as a loading control. (C) Representative images of IHC for PKM1 and PKM2 in M2+/+ (left set of panels) and M2−/− (right set of panels) tissues. Corresponding hematoxylin and eosin (H&E) images are shown. Bars, 20 μm.
Figure 2.
Figure 2.
PKM2 is the predominant isoform in mouse and human tissues, and germline loss of PKM2 leads to decreased levels of total PK. RNA-seq read coverage across Pkm exons 8–11 of adult mouse tissue (A) and PKM exons 8–11 of adult human tissue (B). MISO (Katz et al. 2010) percentage spliced-in (Ψ) values for inclusion of exon 9 (corresponding to the Pkm1 isoform) are shown at the right for each tissue. The regions that correspond to each exon and the direction of transcription are indicated below. (C) Expression of PKM1, PKM2, and total Pkm mRNA in tissue isolated from M2+/+, M2+/−, or M2−/− mice was assessed by quantitative RT–PCR (qRT–PCR). (D) PK enzymatic activity assays in kidney, lung, colon, skeletal muscle (gastrocnemius), or liver tissue lysates isolated from M2+/+, M2+/−, or M2−/− mice. For C and D, P-values using unpaired t-test are shown. (*) P < 0.05; (**) P < 0.01. n = 3 mice.
Figure 3.
Figure 3.
Aged PKM2-null mice develop spontaneous HCC with high penetrance. (A) Representative macroscopic images of livers harvested from aged wild-type or M2−/− mice. The table indicates the frequency of HCC in male mice, as identified at necropsy. (B) Representative H&E images of liver tumors from aged M2−/− mice. Bars: left images, 100 μm; right images, 20 μm. (C) Quantification of BrdU-positive cells in the livers and HCC sections of aged M2+/+ or M2−/− mice. A representative 10× image of IHC for BrdU in an M2−/− tumor is shown. Bar, 100 μm. Means and P-value using unpaired t-test are indicated. (****) P < 0.0001. (D) Summary of hepatic adenoma and HCC incidence in M2+/+ and M2−/− male mice. (E) Dual-color IHC for PKM1 (brown) and total HNF4α (purple) in M2−/− HCC. Bars: left, 100 μm; right, 20 μm. (F) Representative images of IHC for β-catenin, pERK, p53, or NQO1 on M2−/− HCC. Bar, 20 μm. (Bottom right) Expression of Nqo1 mRNA as determined by qRT–PCR in wild-type livers, M2−/− livers, or M2−/− HCC. Mean ± SEM and P-values using unpaired t-test are shown. (*) P < 0.05. (G) Quantification of IHC results for different markers of active oncogenic pathways.
Figure 4.
Figure 4.
Metabolite and RNA-seq profiles of prediseased livers reveal early changes in PKM2-null mice. (A) Representative H&E images of livers from M2+/+ and M2−/− male mice at the indicated ages. Bars, 20 μm. Heat maps of differentially expressed metabolites (B) and differentially expressed genes (C) (RNA-seq; false discovery rate < 0.05; fold change > 1.5) identified in livers of 35-wk-old M2+/+ or M2−/− mice. (D) The top up-regulated (top) and down-regulated (bottom) canonical pathways based on differentially expressed genes identified in C, analyzed by Ingenuity Pathway Analysis (IPA).
Figure 5.
Figure 5.
PKM2-null mice are sensitive to HFD-induced metabolic distress. (A) Weekly weight measurements of 8- to 12-wk-old M2+/+ and M2−/− male mice fed a HFD. Blood glucose (B) and serum insulin (C) were measured in fasted (16 h) M2+/+ or M2−/− mice fed a HFD or LFD for 6 wk. (B) The fasting glucose levels of mice before being placed on either diet are shown at the left. (D) Levels of ALT were measured in serum of M2+/+ or M2−/− mice after 6 wk on a HFD. (E) Ratio of liver weight to body weight of mice fed a HFD at the end of the 10-wk regimen. (F) Representative H&E images of livers from M2+/+ and M2−/− male mice after a 10-wk HFD regimen. Bars, 20 μm. (G) Triglyceride (TG) concentrations were measured in the livers of fed M2+/+ or M2−/− mice after 10 wk on a HFD. (H) Quantification of Iba1+ macrophages in livers from M2+/+ or M2−/− mice fed a HFD for 10 wk. Representative images of the IHC for Iba1 are shown. Bars, 20 μm. (I) Quantification of BrdU-positive cells in livers from M2+/+ or M2−/− mice fed a HFD for 10 wk. Means ± SEM and P-values using unpaired t-test are shown. (*) P < 0.05; (**) P < 0.01; (***) P < 0.001.
Figure 6.
Figure 6.
HCC in PKM2-null mice is accompanied by metabolic distress and preceded by hepatic inflammation and increased hepatocyte proliferation. Blood glucose (A) and serum insulin (B) were measured in fasted (16 h) M2+/+ or M2−/− mice of the indicated ages. (C) Representative H&E images of livers from 54- to 62-wk-old M2+/+ and M2−/− male mice reveal hepatic steatosis in M2−/− mice. Bars, 20 μm. (D) Degree of steatosis was graded as none, mild, intermediate, or severe according to the proportion of total liver displaying a steatosis phenotype. (E) Levels of ALT were measured in serum of young (24 wk) or old (85 wks) M2+/+ or M2−/− mice. (F) Quantification of macrophages (Iba1+ area) in livers from M2+/+ or M2−/− mice fed a HFD for 10 wk. Representative images of Iba1 IHC are shown. Bars, 20 μm. (G) Levels of IL-6 in the serum of young (12 wk) and aged (85 wk) M2+/+ and M2−/− mice were determined by multiplex array. (H) Expression of Il18 mRNA in the livers of young (35 wk) or aged (85 wk) M2+/+ and M2−/− male mice as determined by qRT–PCR. (I) Western blot analysis for IL-18 on whole liver tissue lysates from young (top) and aged (bottom) M2+/+ or M2−/− mice. Hsp90 was used as a loading control. (J) Quantification of BrdU-positive cells in liver sections of 40- to 56-wk-old M2+/+ or M2−/− mice. Means ± SEM and P-values using unpaired t-test are shown. (*) P < 0.05; (**) P < 0.01; (***) P < 0.001; (n.s.) P > 0.05.

References

    1. Anastasiou D, Yu Y, Israelsen WJ, Jiang J-K, Boxer MB, Hong BS, Tempel W, Dimov S, Shen M, Jha A, et al. 2012. Pyruvate kinase M2 activators promote tetramer formation and suppress tumorigenesis. Nat Chem Biol 8: 839–847. - PMC - PubMed
    1. Baffy G, Brunt EM, Caldwell SH. 2012. Hepatocellular carcinoma in non-alcoholic fatty liver disease: an emerging menace. J Hepatol 56: 1384–1391. - PubMed
    1. Barros RPA, Gustafsson J-Å. 2011. Estrogen receptors and the metabolic network. Cell Metab 14: 289–299. - PubMed
    1. Byrne CD, Targher G. 2015. NAFLD: a multisystem disease. J Hepatol 62: S47–S64. - PubMed
    1. Cairns RA, Harris IS, Mak TW. 2011. Regulation of cancer cell metabolism. Nat Rev Cancer 11: 85–95. - PubMed

Publication types

MeSH terms