. 2016 Jul 1;121(1):78-88.
doi: 10.1152/japplphysiol.01040.2015. Epub 2016 Apr 28.

Different cyclical intermittent hypoxia severities have different effects on hippocampal microvasculature

Affiliations

Different cyclical intermittent hypoxia severities have different effects on hippocampal microvasculature

Diane C Lim et al. J Appl Physiol (1985). .

Abstract

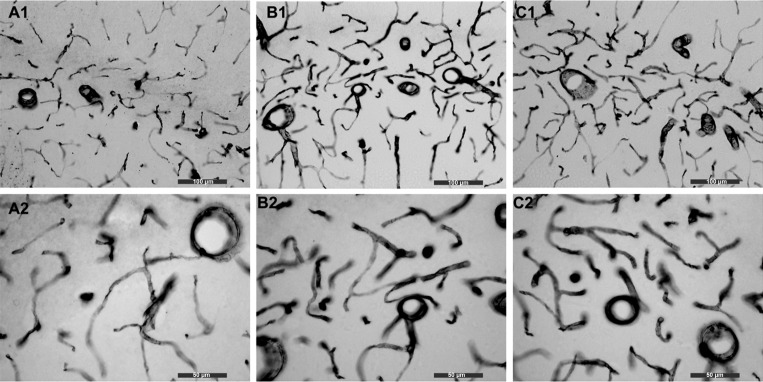
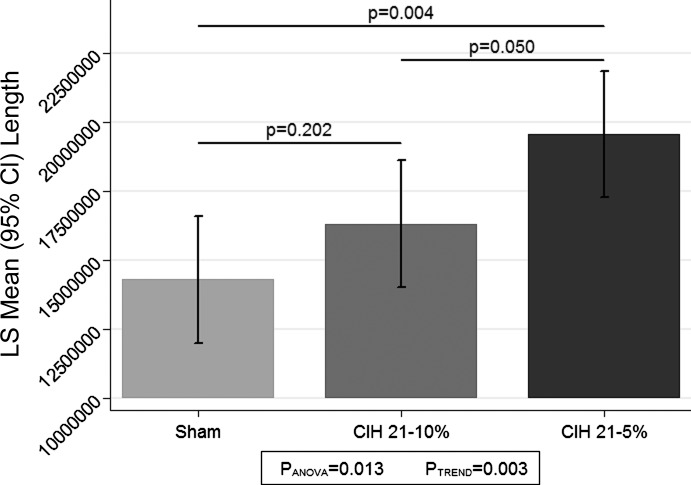
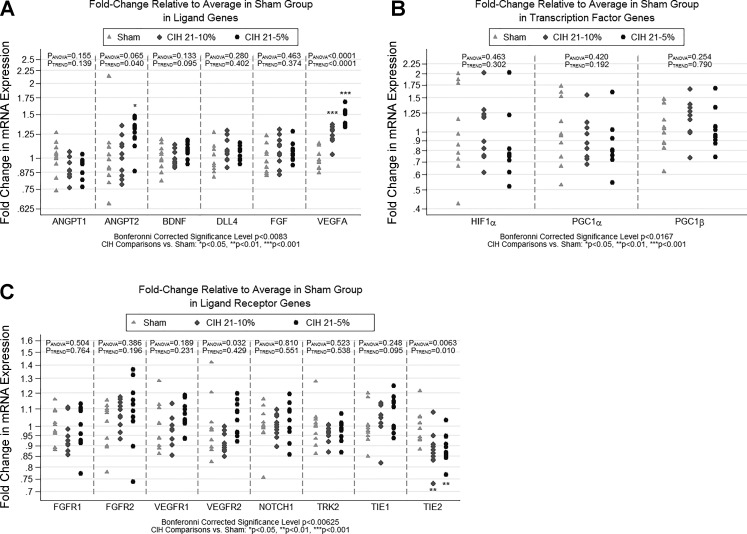
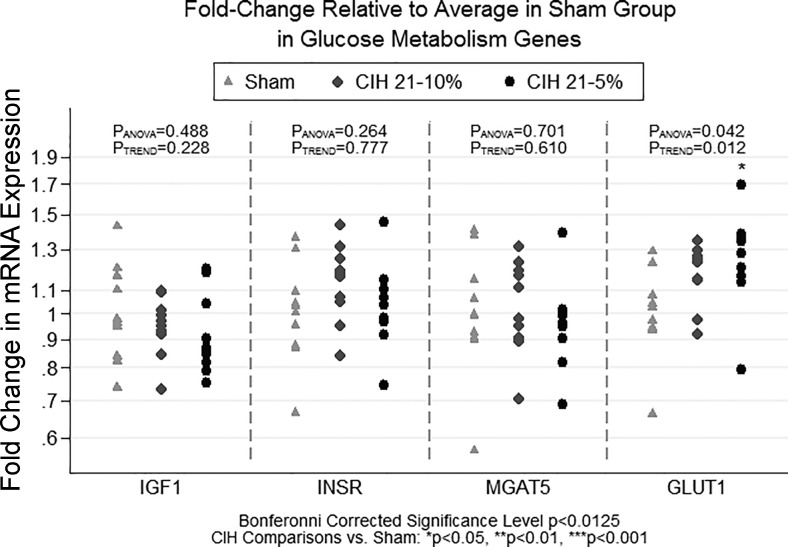
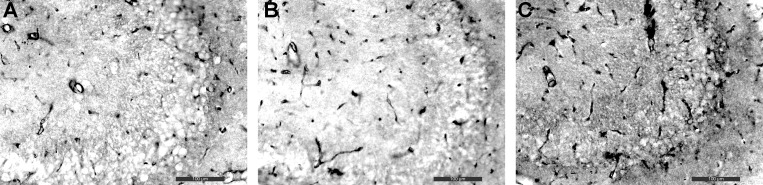
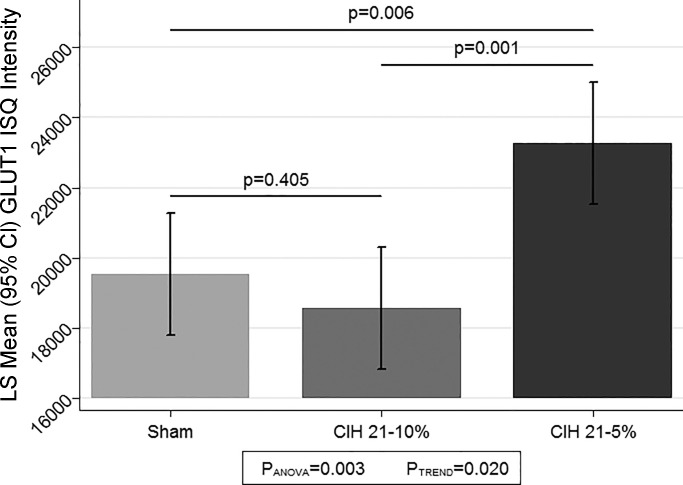
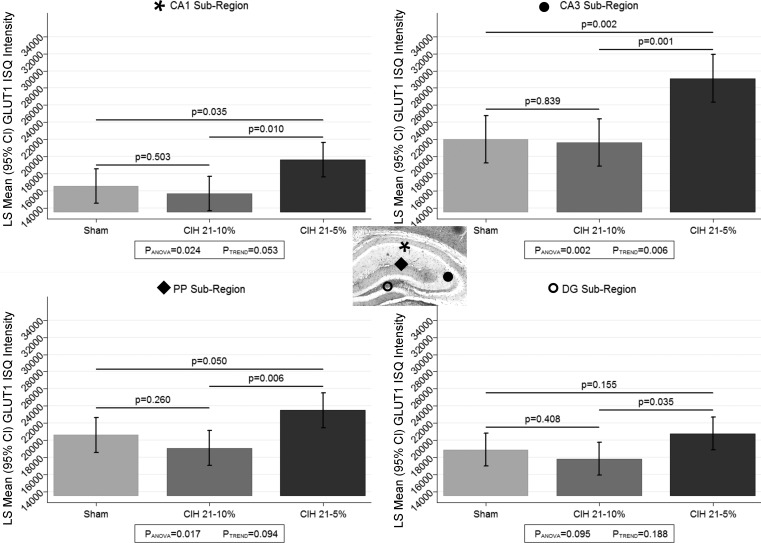
Recent studies have shown an association between obstructive sleep apnea (OSA) and cognitive impairment. This study was done to investigate whether varied levels of cyclical intermittent hypoxia (CIH) differentially affect the microvasculature in the hippocampus, operating as a mechanistic link between OSA and cognitive impairment. We exposed C57BL/6 mice to sham [continuous air, arterial O2 saturation (SaO2 ) 97%], severe CIH to inspired O2 fraction (FiO2 ) = 0.10 (CIH10; SaO2 nadir of 61%), or very severe CIH to FiO2 = 0.05 (CIH5; SaO2 nadir of 37%) for 12 h/day for 2 wk. We quantified capillary length using neurostereology techniques in the dorsal hippocampus and utilized quantitative PCR methods to measure changes in sets of genes related to angiogenesis and to metabolism. Next, we employed immunohistochemistry semiquantification algorithms to quantitate GLUT1 protein on endothelial cells within hippocampal capillaries. Capillary length differed among CIH severity groups (P = 0.013) and demonstrated a linear relationship with CIH severity (P = 0.002). There was a strong association between CIH severity and changes in mRNA for VEGFA (P < 0.0001). Less strong, but nominally significant associations with CIH severity were also observed for ANGPT2 (PANOVA = 0.065, PTREND = 0.040), VEGFR2 (PANOVA = 0.032, PTREND = 0.429), and TIE-2 (PANOVA = 0.006, PTREND = 0.010). We found that the CIH5 group had increased GLUT1 protein relative to sham (P = 0.006) and CIH10 (P = 0.001). There was variation in GLUT1 protein along the microvasculature in different hippocampal subregions. An effect of CIH5 on GLUT1 mRNA was seen (PANOVA = 0.042, PTREND = 0.012). Thus CIH affects the microvasculature in the hippocampus, but consequences depend on CIH severity.

Keywords: GLUT1 transporter; VEGF; angiogenesis; blood-brain barrier; cyclical intermittent hypoxia; obstructive sleep apnea; vascular endothelium.


Figures

Fig. 1.
Fig. 1.
Immunohistochemistry for CD31 to quantitate angiogenesis. We used immunohistochemistry for CD31 followed by neurostereology to count the total length of microvessels in our three conditions. A: sham (A1 is at ×20 and A2 is at ×40 magnification). B: CIH10 (B1 is at ×20 and B2 is at ×40 magnification). C: CIH5 (C1 is at ×20 and C2 is at ×40 magnification). It is appreciated by visual inspection that there are more blood vessels in the CIH10 group compared with sham, and more blood vessels in the CIH5 group compared with sham and CIH10. ×20 bar = 100 μm; ×40 bar = 50 μm.
Fig. 2.
Fig. 2.
Angiogenesis (total vessel length) as measured by neurostereology. The figure illustrates the estimated least squares (LS) mean and 95% confidence interval (CI) of total vessel length among the 3 conditions: sham, CIH10, and CIH5. For each condition, n = 5 mice, 2 slices per mouse, for both the left and right hippocampus. The average probed volume are as follows: sham = 7,282,841 μm3, CIH10 = 7,194,943 μm3, and CIH5 = 7,519,552 μm3. There was a significant difference among the three conditions (P = 0.013) and strong evidence for a linear trend across conditions (P = 0.003). In pairwise comparisons between groups, CIH5 had significantly longer vessel length compared with sham (P = 0.004) and borderline significantly longer length compared with CIH10 (P = 0.050); there was no statistically significant difference between sham and CIH10 (P = 0.202).
Fig. 3.
Fig. 3.
Fold change in qPCR gene expression for angiogenesis-related genes. The figure illustrates the results of qPCR analyses examining expression of three subsets of genes hypothesized to be related to angiogenesis. Results are shown as fold change in expression relative to the sham condition. Fold change is measured as 2−ΔΔCT for each gene, where the first Δ is the average CT of the housekeeping genes, and the second Δ is the average ΔCT in the sham condition. Analyses were based on −ΔΔCT values, which are measured on a linear scale. Based on a priori hypothesized pathways, genes were separated into 3 distinct domains/subgroups. A: ligands: VEGFA, ANGPT1, ANGPT2, BDNF, FGF, and DLL4. B: ligand receptors: VEGFR1, VEGFR2, TIE-1, TIE-2, TRK2, FGFR-1, FGFR-2, NOTCH1. C: transcription factors: HIF-1α, PGC-1α, and PGC-1β. Statistical significance was based on a domain-specific Bonferroni corrected α-level (equal to 0.05 divided by the number of genes in the domain). Significant or nominally significant differences were observed for VEGFA, ANGPT2, VEGFR2, and TIE-2. The strongest differences among conditions were seen for VEGFA (P < 0.0001; significant after correction for multiple ligand genes), with both CIH5 and CIH10 showing significantly increased expression compared with sham. We also observed nominal or borderline significant differences among the conditions for the ligand gene ANGPT2 and ligand receptors VEGFR2 and TIE-2. We note that the TIE-2 result was just slightly above our Bonferroni-corrected threshold for significance (P < 0.00625). Significant difference vs. sham: *P < 0.05, **P < 0.01, ***P < 0.001.
Fig. 4.
Fig. 4.
Fold change in qPCR gene expression for glucose metabolism genes. The figure illustrates the results of qPCR analyses examining expression of IGF-I, INSR, MGAT5, and GLUT1, genes hypothesized to be related to metabolism within the hippocampus across CIH severities. Results are shown as fold change in expression relative to the sham condition. Fold change is measured as 2−ΔΔCT for each gene, where the first Δ is the average of the housekeeping genes, and the second Δ is the average ΔCT in the sham condition. Analyses were based on −ΔΔCT values, which are measured on a linear scale. We observed a significant difference in GLUT1 expression among CIH severity groups, with the CIH5 group showing significantly higher expression compared with sham. There is also evidence of a linear dose response in mRNA expression across CIH conditions. Significant difference vs. sham: *P < 0.05.
Fig. 5.
Fig. 5.
Immunohistochemistry staining for GLUT1 proteins. Representative images of GLUT1 staining in the hippocampus are shown for the three CIH conditions: sham (A), CIH10 (B), and CIH5 (C). It is appreciated by visual inspection that there is more GLUT1 protein in the CIH5 group, as evidenced by the darker staining, compared with sham and CIH10. ×20 bar = 100 μm.
Fig. 6.
Fig. 6.
Immunohistochemistry semiquantification (ISQ) for GLUT1. We used immunohistochemistry to stain for GLUT1 and then applied our ISQ technique to determine the intensity of the GLUT1 protein on the microvessels of the 3 CIH conditions. We observed a significant difference among the groups (PANOVA = 0.003), with the CIH5 having significantly greater GLUT1 intensity compared with both sham (P = 0.006) and CIH10 (P = 0.001); there was no difference between CIH10 and sham (P = 0.405), with CIH10 actually showing less GLUT1, on average. While there was evidence for a linear trend (P = 0.020), this result is solely driven by the strong difference between sham and CIH5. LS, least squares; CI, confidence interval; IQ, ??.
Fig. 7.
Fig. 7.
ISQ for GLUT1 within brain subregions. We used the ISQ technique to assess the intensity of the GLUT1 protein on the microvessels in our 3 CIH conditions and present results stratified by brain subregion [CA1 (denoted by *), CA3 (denoted by ●), PP (denoted by ⧫), and DG (denoted by ○); see inset]. We observed significant differences among the conditions in all but the DG subregion. In general, as with the overall analysis, CIH5 showed significantly higher GLUT1 intensity compared with either the CIH10 or sham conditions. There were significant differences in the overall GLUT1 intensity across subregions, with the CA3 showing the most GLUT1 and CA1 the least. IQ, ??.

References

    1. Ancoli-Israel S, Coy T. Are breathing disturbances in elderly equivalent to sleep apnea syndrome? Sleep 17: 77–83, 1994. - PubMed
    1. Ancoli-Israel S, Klauber MR, Butters N, Parker L, Kripke DF. Dementia in institutionalized elderly: relation to sleep apnea. J Am Geriatr Soc 39: 258–263, 1991. - PubMed
    1. Ancoli-Israel S, Palmer BW, Cooke JR, Corey-Bloom J, Fiorentino L, Natarajan L, Liu L, Ayalon L, He F, Loredo JS. Cognitive effects of treating obstructive sleep apnea in Alzheimer's disease: a randomized controlled study. J Am Geriatr Soc 56: 2076–2081, 2008. - PMC - PubMed
    1. Arany Z, Foo SY, Ma Y, Ruas JL, Bommi-Reddy A, Girnun G, Cooper M, Laznik D, Chinsomboon J, Rangwala SM, Baek KH, Rosenzweig A, Spiegelman BM. HIF-independent regulation of VEGF and angiogenesis by the transcriptional coactivator PGC-1alpha. Nature 451: 1008–1012, 2008. - PubMed
    1. Arcondeguy T, Lacazette E, Millevoi S, Prats H, Touriol C. VEGF-A mRNA processing, stability and translation: a paradigm for intricate regulation of gene expression at the post-transcriptional level. Nucleic Acids Res 41: 7997–8010, 2013. - PMC - PubMed

Publication types

MeSH terms

Substances

LinkOut - more resources