. 2016 Apr 29;352(6285):565-9.
doi: 10.1126/science.aad3369. Epub 2016 Apr 28.

Population-based metagenomics analysis reveals markers for gut microbiome composition and diversity

Affiliations

Population-based metagenomics analysis reveals markers for gut microbiome composition and diversity

Alexandra Zhernakova et al. Science. .

Abstract

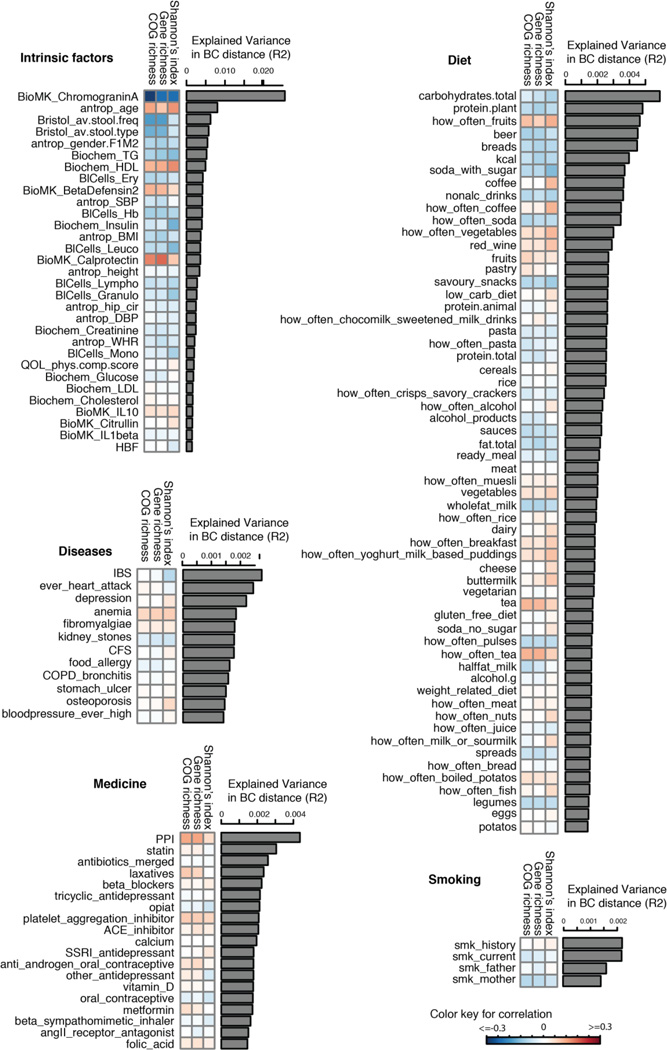
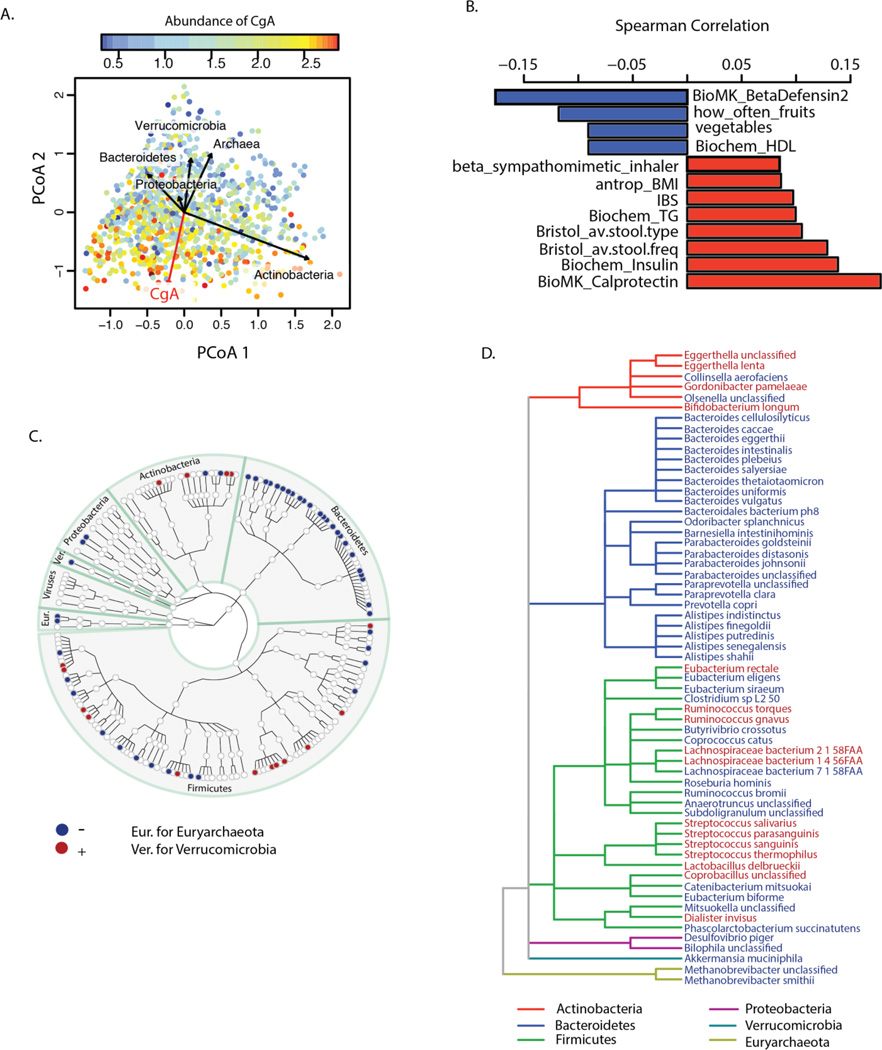
Deep sequencing of the gut microbiomes of 1135 participants from a Dutch population-based cohort shows relations between the microbiome and 126 exogenous and intrinsic host factors, including 31 intrinsic factors, 12 diseases, 19 drug groups, 4 smoking categories, and 60 dietary factors. These factors collectively explain 18.7% of the variation seen in the interindividual distance of microbial composition. We could associate 110 factors to 125 species and observed that fecal chromogranin A (CgA), a protein secreted by enteroendocrine cells, was exclusively associated with 61 microbial species whose abundance collectively accounted for 53% of microbial composition. Low CgA concentrations were seen in individuals with a more diverse microbiome. These results are an important step toward a better understanding of environment-diet-microbe-host interactions.


Conflict of interest statement

The authors have no conflicts of interest to report.

Figures

Fig. 1
Fig. 1. The taxonomic tree of microbial taxonomies predicted by MGS and 16S rRNA gene sequencing
(A) Taxonomic tree based on MGS shotgun sequencing data. (B) Taxonomic tree based on16S rRNA gene sequencing data. Each dot represents a taxonomic entity. From the inner to outer circles, the taxonomic levels range from domains to species. Different colors of dots indicate different taxonomy levels according to the color key shown. Numbers in brackets indicate the total number of unique taxonomies detected at each level.
Fig. 2
Fig. 2. The inter-individual variation of microbial composition and function profile
(A) Principal coordinates plots of Bray-Curtis distance of microbial composition. The composition was driven by the most dominant phyla: Firmicutes, Actinobacteria, and Bacteroidetes. Each dot represents one individual. Color indicates the relative abundance of each phylum. (B) Distribution of Shannon’s diversity index. (C) Distribution of the gene richness. (D) Distribution of the clusters of orthologous groups (COG) richness.
Fig. 3
Fig. 3. Factors associated with inter-individual variation of gut microbiome
A total of 126 factors (FDR<0.1) were associated with inter-individual variation of the gut microbiome. The bar plot indicates the explained variation of each factor in the inter-individual variation of microbial composition (Bray-Curtis distance). The heatmap under the bar plot shows the correlation coefficients of each factor with Shannon’s index of diversity, gene richness, and COG richness, respectively. Color key for correlation is shown.
Fig. 4
Fig. 4. The association of fecal level of Chromogranin A
(A) Principal coordinate plots of Bray-Curtis distance of microbial composition. Each dot represents one individual and its color is based on the abundance level of CgA: warm colors indicate high abundance and cool colors low abundance. The red arrow indicates the association direction of CgA, while the directions of the CgA-associated phyla are shown as black arrows. (B) Correlation between CgA and other factors at FDR<0.1. (C) Taxonomic tree of 170 species, of which 61 species were exclusively associated with CgA level. Each dot represents a taxonomic entity. Red dots indicate positively associated species. Blue dots indicate negatively associated species. (D) Taxonomic tree of the 61 species exclusively associated with CgA level. The branches are colored to show phylum levels as shown in the color key. Species in red show increased abundance associated with higher CgA levels. Species in blue show lower abundance associated with higher CgA levels.

References

    1. Clemente JC, Ursell LK, Parfrey LW, Knight R. The impact of the gut microbiota on human health: an integrative view. Cell. 2012;148:1258–1270. - PMC - PubMed
    1. Tigchelaar EF, et al. Cohort profile: LifeLines DEEP, a prospective, general population cohort study in the northern Netherlands: study design and baseline characteristics. BMJ Open. 2015;5:e006772. - PMC - PubMed
    1. Scholtens S, et al. Cohort Profile: LifeLines, a three-generation cohort study and biobank. Int. J. Epidemiol. 2014;44:1172–1180. - PubMed
    1. Information on materials and methods is available at the Science Web site

    1. Segata N, et al. Metagenomic microbial community profiling using unique clade-specific marker genes. Nat. Methods. 2012;9:811–814. - PMC - PubMed

Publication types