. 2016 Apr 29;352(6285):600-4.
doi: 10.1126/science.aad9417. Epub 2016 Apr 28.

RNA splicing is a primary link between genetic variation and disease

Affiliations

RNA splicing is a primary link between genetic variation and disease

Yang I Li et al. Science. .

Abstract

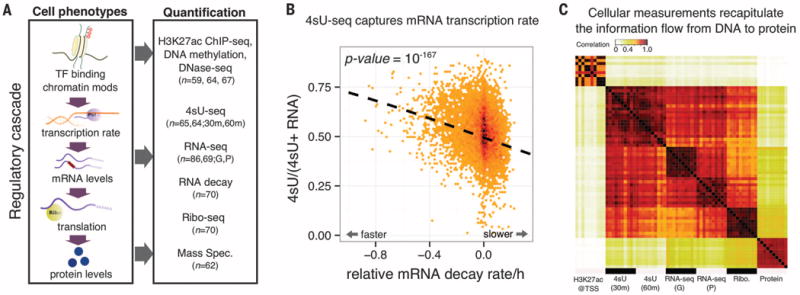
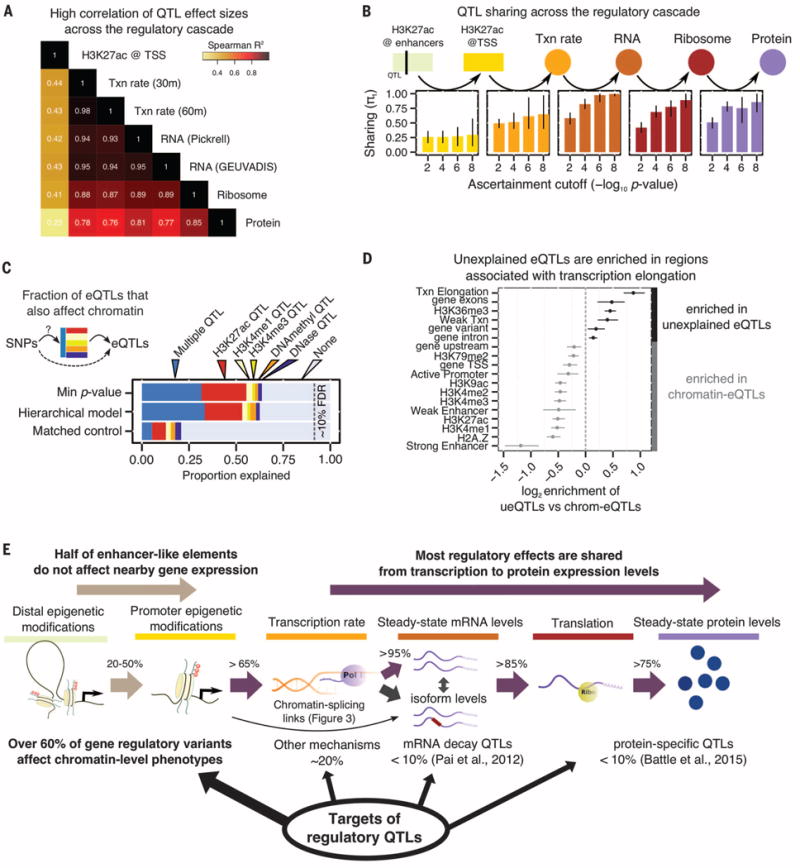
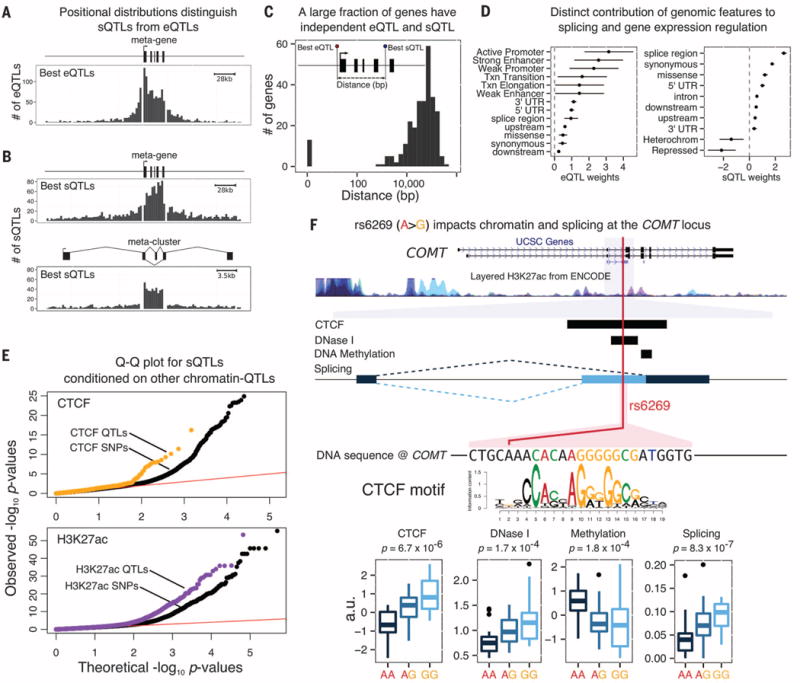
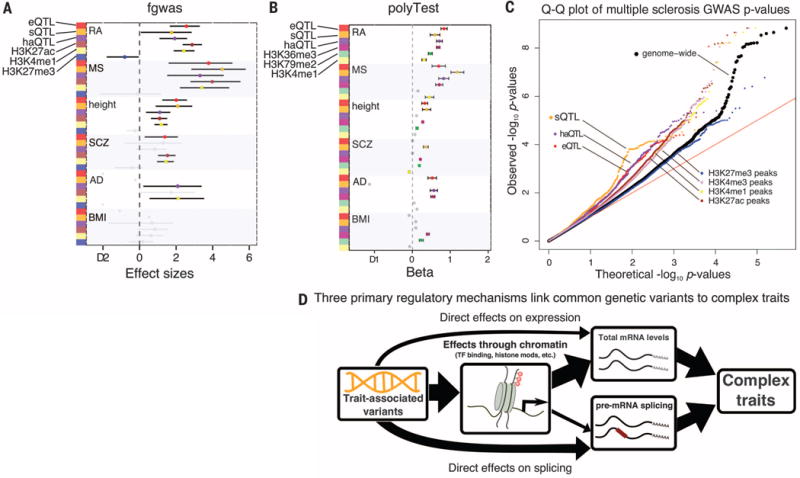
Noncoding variants play a central role in the genetics of complex traits, but we still lack a full understanding of the molecular pathways through which they act. We quantified the contribution of cis-acting genetic effects at all major stages of gene regulation from chromatin to proteins, in Yoruba lymphoblastoid cell lines (LCLs). About ~65% of expression quantitative trait loci (eQTLs) have primary effects on chromatin, whereas the remaining eQTLs are enriched in transcribed regions. Using a novel method, we also detected 2893 splicing QTLs, most of which have little or no effect on gene-level expression. These splicing QTLs are major contributors to complex traits, roughly on a par with variants that affect gene expression levels. Our study provides a comprehensive view of the mechanisms linking genetic variation to variation in human gene regulation.


Figures

Fig. 1
Fig. 1. Systematic mapping of genetic variation that affects the gene-regulatory cascade
(A) QTLs mapped for eight cellular phenotypes in LCLs. For 4sU, 30 m and 60 m refer to different measurement time points. For RNA-seq, G and P refer to data from two studies (6, 17). TF, transcription factor. (B) Steady-state RNA levels reflect a balance between transcription and decay. Normalized mRNA decay rates (x axis) are plotted against the ratio of new mRNA to steady-state mRNA (y axis). Each data point is a gene. (C) A correlation matrix of seven data sets reflects the expected order of steps in gene regulation. Each entry in the matrix shows the correlation across genes between measurements of a pair of samples and/or data types. The plot shows 10 different random samples for each data type.
Fig. 2
Fig. 2. Percolation of genetic effects through the gene regulatory cascade
(A) Correlation of effect sizes across different measurements from eQTLs identified in the GEUVADIS YRI sample (6). Txn rate, transcription rate. (B) QTL sharing across the regulatory cascade. Each panel shows the estimated fraction of QTLs identified at one stage that are preserved at the next stage of regulation. The four bars in each panel correspond to the P-value threshold for ascertaining QTLs in each assay, using the linear regression t statistics. Bars represent 80% confidence intervals on π1, the fraction of true positives (16). The enhancer→TSS panel considers the effect of H3K27ac QTLs on the nearest TSS. (C) The fraction of expression QTLs that also affect chromatin-level phenotypes, as estimated by two models, and for matched control SNPs. About 35% of gene eQTLs do not appear to affect chromatin traits. QTLs for H3K4me1 and H3K4me3 are from (8). (D) Functional context of eQTL SNPs that are not associated with chromatin changes (“unexplained”) versus those eQTLs that are also chromatin QTLs. 5′ untranslated regions were excluded from the “gene exons” annotation. Five annotations with bootstrap P > 0.05 are not shown. (E) Summary of the effects of regulatory QTLs and of their sharing through the regulatory cascade.
Fig. 3
Fig. 3
Properties of sQTLs. Most sQTLs act independently from eQTLs: Positional distributions of (A) eQTLs and (B) sQTLs at 5% FDR are consistent with our mechanistic understanding of gene transcription and splicing. (C) The distance between the best eQTL and best sQTL for genes with both types of QTL is typically large, suggesting distinct causal variants. (D) A hierarchical model reveals distinct genomic features that are most relevant for eQTLs and sQTLs, respectively. (E) QTLs for CTCF binding, and H3K27ac levels are more likely to be sQTLs than matched SNPs within CTCFand H3K27ac ChIP-seq peaks, respectively. (F) Example of an sQTL (rs6269) that is also a QTL for CTCF, DNaseI sensitivity, and DNA methylation. The allele that is associated with increased CTCF occupancy is also associated with increased use of an alternative upstream splice site for an exon of the catechol-O-methyltransferase gene, COMT, which is consistent with the model that PolII pausing at CTCF binding sites can promote upstream exon inclusion (21). COMT, which regulates dopamine, has possible roles in neuropsychiatric conditions (25). In Europeans, the sQTL is in nearly complete linkage disequilibrium with a missense variant, rs4680, which has been the main focus of attention to date.
Fig. 4
Fig. 4. Contribution of regulatory variants to complex traits
(A) Annotations identified with significant enrichment for GWAS traits by fgwas (23). (B) Annotations identified with significant enrichment for GWAS traits by polyTest (16). (C) Quantile-quantile (Q-Q) plot for multiple sclerosis GWAS suggests that splicing plays an important role in the etiology of multiple sclerosis. (D) Model of the regulatory mechanisms through which common variants affect complex traits.

Comment in

References

    1. Nicolae DL, et al. PLOS Genet. 2010;6:e1000888. - PMC - PubMed
    1. The GTEx Consortium. Science. 2015;348:648–660. - PMC - PubMed
    1. Kasowski M, et al. Science. 2010;328:232–235. - PMC - PubMed
    1. Degner JF, et al. Nature. 2012;482:390–394. - PMC - PubMed
    1. McVicker G, et al. Science. 2013;342:747–749. - PMC - PubMed

Publication types