. 2016 Apr 29;352(6285):604-7.
doi: 10.1126/science.aac8167.

Broken detailed balance at mesoscopic scales in active biological systems

Affiliations

Broken detailed balance at mesoscopic scales in active biological systems

Christopher Battle et al. Science. .

Abstract

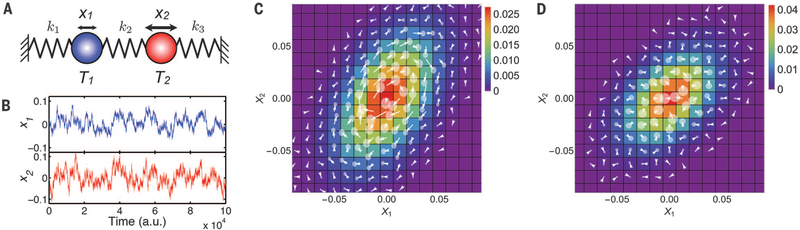
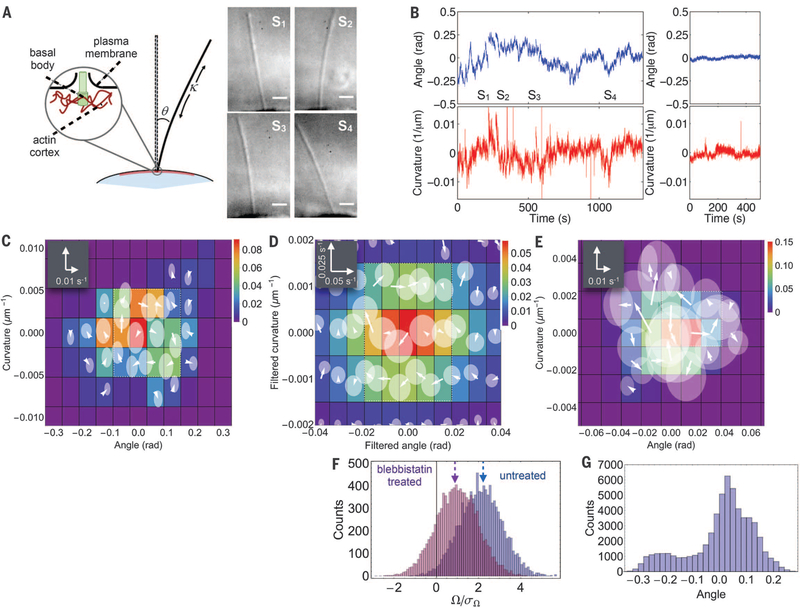
Systems in thermodynamic equilibrium are not only characterized by time-independent macroscopic properties, but also satisfy the principle of detailed balance in the transitions between microscopic configurations. Living systems function out of equilibrium and are characterized by directed fluxes through chemical states, which violate detailed balance at the molecular scale. Here we introduce a method to probe for broken detailed balance and demonstrate how such nonequilibrium dynamics are manifest at the mesosopic scale. The periodic beating of an isolated flagellum from Chlamydomonas reinhardtii exhibits probability flux in the phase space of shapes. With a model, we show how the breaking of detailed balance can also be quantified in stationary, nonequilibrium stochastic systems in the absence of periodic motion. We further demonstrate such broken detailed balance in the nonperiodic fluctuations of primary cilia of epithelial cells. Our analysis provides a general tool to identify nonequilibrium dynamics in cells and tissues.


Figures

Fig. 1.
Fig. 1.. Detailed balance and actively beating Chlamydomonas flagella.
(A) In thermodynamic equilibrium, transitions between microscopic states are pairwise-balanced, precluding net flux among states. (B) Nonequilibrium steady states can break detailed balance and exhibit flux loops. (C) Snapshots separated by 24 (orange-yellow), 7, and 10 ms in an isolated Chlamydomonas flagellum’s beat cycle (movie S1). Arrows on the central circle indicate the direction of time. Color corresponds to position in (E). (D) The first three bending modes for a freely suspended flexible rod. (E) A three-dimensional (3D) probability flux map of flagellar dynamics in the CGPS spanned by the first three modes. (F and G) Probability distribution (color) and flux map (white arrows) of flagellar dynamics in CGPS spanned by first and second modes (F), and first and third modes (G). The white legend indicates the flux scale.
Fig. 2.
Fig. 2.. Brownian-dynamics simulation of 1D bead-spring model.
(A) Model schematic. (B) Time series of the bead positions for T2 = 1.5T1 and equal spring constants. See figs. S4 and S5 for the general case (18). (C and D) Probability distribution (color) and flux map (white arrows) in CGPS spanned by x1 and x2 for the simulation in panel B (C) and for a simulation with T2 = T1 (D). Translucent disks represent a 2σ confidence interval for fluxes.
Fig. 3.
Fig. 3.. Nonequilibrium fluctuations of MDCK-II primary cilia.
(A) Left: Schematic of primary cilium and anchoring of the basal body in the cell cortex with angle θ and curvature, κ, defined positive as shown. Right: Snapshots of cilium, from differential interference contrast microscopy, taken at time points marked in (B). Scale bar: 2 μm. (B) Angle (top) and curvature time series (bottom) of an active cilium (left) and of a blebbistatin-treated cilium (right). Frame rate: 25 Hz; scale bar: 2 μm. (C to E)Phase-space probability distribution (color) and flux map (white arrows) of ciliary fluctuations in CGPS spanned by θ and κ for (C): the untreated time series from (B); (D) a high-pass filtered time series of an untreated cilium (window size = 200 s); (E) the fluctuations of the blebbistatin-treated cilium from (B). The translucent disks represent a 2σ confidence interval for fluxes. (F) Distributions of flux contour integrals for untreated (purple) and blebbistatin-treated (pink) cilia. (G) Angle distribution for the high-pass filtered cilium data in (D).

Comment in

References

    1. Boltzmann L, Sitzungsberichte Akad. Wiss., Vienna, part II 66, 275–370 (1872).
    1. Alberts B et al., Molecular Biology of the Cell (Garland Science, New York, ed. 5 2007).
    1. Brangwynne CP, Koenderink GH, MacKintosh FC, Weitz DA, J. Cell Biol. 183, 583–587 (2008). - PMC - PubMed
    1. Fakhri N et al., Science 344, 1031–1035 (2014). - PubMed
    1. Guo M et al., Cell 158, 822–832 (2014). - PMC - PubMed

Publication types