. 2016 Aug;42(8):1929-41.
doi: 10.1016/j.ultrasmedbio.2016.03.017. Epub 2016 Apr 26.

Frequency Dependence of Petechial Hemorrhage and Cardiomyocyte Injury Induced during Myocardial Contrast Echocardiography

Affiliations

Frequency Dependence of Petechial Hemorrhage and Cardiomyocyte Injury Induced during Myocardial Contrast Echocardiography

Douglas L Miller et al. Ultrasound Med Biol. 2016 Aug.

Abstract

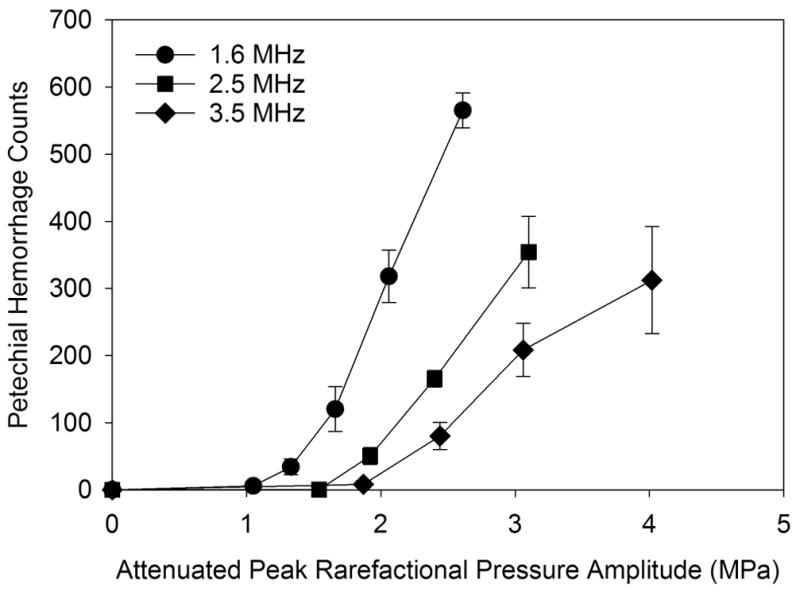
Myocardial contrast echocardiography (MCE) for perfusion imaging can induce microscale bio-effects during intermittent high-Mechanical Index scans. The dependence of MCE-induced bio-effects on the ultrasonic frequency was examined in rats at 1.6, 2.5 and 3.5 MHz. Premature complexes were counted in the electrocardiogram, petechial hemorrhages with microvascular leakage on the heart surface were observed at the time of exposure, plasma troponin elevation was measured after 4 h and cardiomyocyte injury was detected at 24 h. Increasing response to exposure above an apparent threshold was observed for all endpoints at each frequency. The effects decreased with increasing ultrasonic frequency, and the thresholds increased. Linear regressions for frequency-dependent thresholds indicated coefficients and exponents of 0.6 and 1.07 for petechial hemorrhages, respectively, and 1.02 and 0.8 for cardiomyocyte death, compared with 1.9 and 0.5 (square root) for the guideline limit of the mechanical index. The results clarify the dependence of cardiac bio-effects on frequency, and should allow development of theoretical descriptions of the phenomena and improved safety guidance for MCE.

Keywords: Cardiomyocyte injury; Diagnostic ultrasound adverse effects; Myocardial contrast echocardiography; Ultrasonic cavitation biology.


Figures

Figure 1
Figure 1
Plots of the attenuated acoustic pressure for the maximum pulses at each frequency after passage through a chest wall sample. The machine was operated at the 0 dB (maximum power) setting and the calibrated hydrophone was placed at the depth position of the anterior wall of the left ventricle which coincided with the position of the peak rarefactional pressure amplitude.
Figure 2
Figure 2
Ultrasound dual images 30 ms apart for 2.5 MHz scanning at −4 dB. For the dual image before contrast was infused (top), both images are essentially the same, with the left ventricle (arrow) appearing as a dark area. The dual image after contrast infusion (bottom) shows the reduction in contrast echoes from the left to the right image (the blood-filled left ventricle appears as a bright central area). The traces across the bottom of the images were the ECG-derived signal used to trigger the images; the lower trace shows a premature complex with compensatory pause just after the dual trigger (two red markers on the signal trace) with microbubble destruction evident in the myocardium. The depth scale on the left side of the image is in cm.
Figure 3
Figure 3
The number of premature complexes observed during MCE for the range of attenuated peak rarefactional pressure amplitudes measured at each frequency. There were approximately 350 triggered scans for each 5 min of scanning-exposure, which sets the maximum possible number of PCs.
Figure 4
Figure 4
Stereo microscope photographs of the anterior heart surface for a heart scanned at the maximum PRPA (top row) or sham (bottom row) at each frequency for the first part of the study. The petechial hemorrhages are evident as the reddish areas (but not individually distinct at this magnification), while the microvascular leakage is indicted by the extravasated Evans blue dye. Scale bars: 2 mm for all photographs.
Figure 5
Figure 5
An example of petechiae on the surface of a heart scanned at 1.6 MHz, 0 dB, which had a petechiae count of 532. The upper photograph shows the effect in the scan plane (scale bar 2 mm) and the lower photograph at higher magnification (scale bar 1 mm) shows individual petechiae (arrows).
Figure 6
Figure 6
The numbers of petechial hemorrhages counted on the heart surface after exposure. The PRPA-response trend was an increase above an apparent threshold for each frequency with a relatively stronger response at the higher frequencies than the PC response shown in Fig. 2.
Figure 7
Figure 7
The relationship between the petechial hemorrhage counts (PH) (Fig. 6) and the numbers of premature complexes (PCs) in the ECG (Fig. 3) for the rats with PH counts. The linear regressions on the data for the different frequencies have a nonzero intercept, indicating that PH can occur without PCs.
Figure 8
Figure 8
The observed areas of microvascular leakage of the Evans blue dye after exposure. The exposure response trends appear similar to the petechial hemorrhage trends (Fig. 6).
Figure 9
Figure 9
A scatter plot of all the Evans blue leakage areas against the numbers of petechial hemorrhages (PH). The approximately zero intercept of the linear regression (slope of 0.091 mm2 per petechiae, intercept of 2.3 mm2, r2=0.76) implies that little leakage occurs without PH.
Figure 10
Figure 10
Plasma troponin results for the 0 dB maximal exposure at each frequency plotted as a log-log presentation. The regression shows a very strong negative correlation (exponential -3.24, r2=0.77) of plasma troponin I with ultrasonic frequency.
Figure 11
Figure 11
Examples of histology results for H&E staining (Top) and fibrinogen immunohistochemistry (Bottom). Injured cardiomyocytes can be identified in the H&E staining by hypercontraction (disruption of the myocyte striations), and also appear to be stained by the fibrin/fibrinogen antibody. Scale bar: 50 μm.
Figure 12
Figure 12
The Evans blue stained cell scores increased above apparent thresholds for each frequency. These trends are similar in appearance to the premature complex trends shown in Fig. 3.
Figure 13
Figure 13
A direct comparison of the stained cell scores at 24 h with the premature complexes during MCE for the third part of the study. The linear regression on the 1.6 MHz data shows a clear relationship between the two endpoints (r2=0.86). However, there was no clear relationship for the higher frequencies.
Figure 14
Figure 14
Thresholds for petechial hemorrhages and stained cells scores (cardiomyocyte necrosis) presented as a log-log plot against ultrasonic frequency. The linear regressions gave frequency-dependence exponents (see text) of 1.07 for petechial hemorrhages and 0.8 for the stained cell scores. For comparison, the dependence of cavitation nucleation for optimum nuclei in plasma (Apfel and Holland, 1991) is shown as the lower dotted line. The guideline upper limits MI=1.9 and MI=0.8 for diagnostic ultrasound and Definity contrast imaging are shown as the upper and lower dashed lines, respectively.

References

    1. Apfel RE, Holland CK. Gauging the likelihood of cavitation from short-pulse, low-duty cycle diagnostic ultrasound. Ultrasound Med Biol. 1991;17:179–85. - PubMed
    1. Boyd JH, Chau EH, Tokunanga C, Bateman RM, Haljan G, Davani EY, Wang Y, Walley KR. Fibrinogen decreases cardiomyocyte contractility through an ICAM-1-dependent mechanism. Crit Care. 2008;12(1):R2. - PMC - PubMed
    1. Chapman S, Windle J, Xie F, McGrain A, Porter TR. Incidence of cardiac arrhythmias with therapeutic versus diagnostic ultrasound and intravenous microbubbles. J Ultrasound Med. 2005;24:1099–1107. - PubMed
    1. Chen S, Kroll MH, Shohet RV, Frenkel P, Mayer SA, Grayburn PA. Bioeffects of myocardial contrast microbubble destruction by echocardiography. Echocardiography. 2002;19:495–500. - PubMed
    1. Church CC, Carstensen EL, Nyborg WL, Carson PL, Frizzell LA, Bailey MR. The risk of exposure to diagnostic ultrasound in postnatal subjects: nonthermal mechanisms. J Ultrasound Med. 2008;27:565–92. - PubMed